Races in Savage, Minnesota (MN) Detailed Stats
Data:
Races - White alone (%)
Races - White alone (% change since 2000)
Races - Black alone (%)
Races - Black alone (% change since 2000)
Races - American Indian alone (%)
Races - American Indian alone (% change since 2000)
Races - Asian alone (%)
Races - Asian alone (% change since 2000)
Races - Hispanic (%)
Races - Hispanic (% change since 2000)
Races - Native Hawaiian and Other Pacific Islander alone (%)
Races - Native Hawaiian and Other Pacific Islander alone (% change since 2000)
Races - Two or more races(%)
Races - Two or more races(% change since 2000)
Races - Other race alone (%)
Races - Other race alone (% change since 2000)
Racial diversity
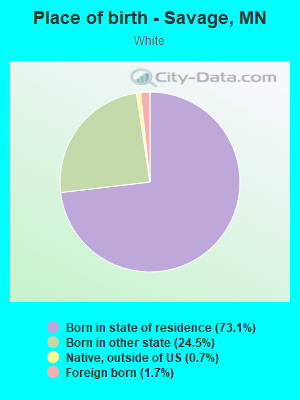
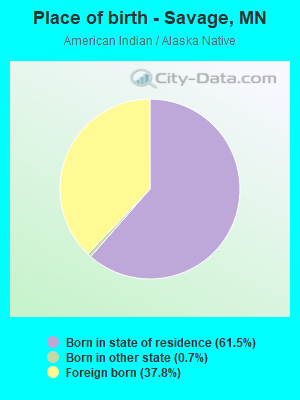
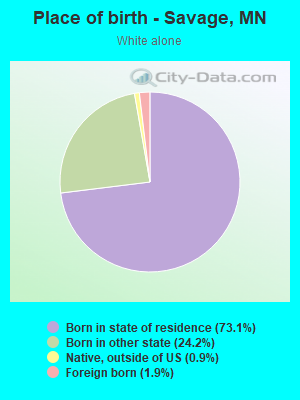
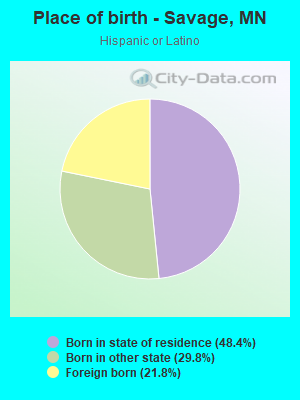
Place of birth - Born in state of residence (%)
Place of birth - Born in state of residence (%) - White
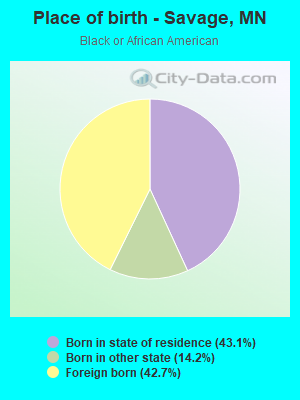
Place of birth - Born in state of residence (%) - Black or African American
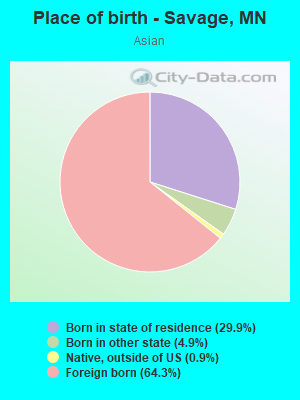
Place of birth - Born in state of residence (%) - Asian
Place of birth - Born in state of residence (%) - Hispanic or Latino
Place of birth - Born in state of residence (%) - American Indian and Alaska Native
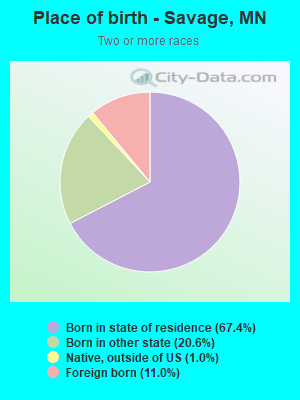
Place of birth - Born in state of residence (%) - Multirace
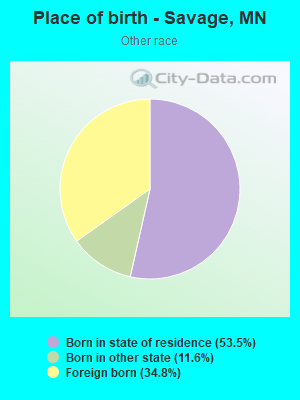
Place of birth - Born in state of residence (%) - Other Race
Place of birth - Born in other state (%)
Place of birth - Born in other state (%) - White
Place of birth - Born in other state (%) - Black or African American
Place of birth - Born in other state (%) - Asian
Place of birth - Born in other state (%) - Hispanic or Latino
Place of birth - Born in other state (%) - American Indian and Alaska Native
Place of birth - Born in other state (%) - Multirace
Place of birth - Born in other state (%) - Other Race
Place of birth - Native, outside of US (%)
Place of birth - Native, outside of US (%) - White
Place of birth - Native, outside of US (%) - Black or African American
Place of birth - Native, outside of US (%) - Asian
Place of birth - Native, outside of US (%) - Hispanic or Latino
Place of birth - Native, outside of US (%) - American Indian and Alaska Native
Place of birth - Native, outside of US (%) - Multirace
Place of birth - Native, outside of US (%) - Other Race
Place of birth - Foreign born (%)
Place of birth - Foreign born (%) - White
Place of birth - Foreign born (%) - Black or African American
Place of birth - Foreign born (%) - Asian
Place of birth - Foreign born (%) - Hispanic or Latino
Place of birth - Foreign born (%) - American Indian and Alaska Native
Place of birth - Foreign born (%) - Multirace
Place of birth - Foreign born (%) - Other Race
Residents speaking English at home (%)
Residents speaking English at home - Born in the United States (%)
Residents speaking English at home - Native, born elsewhere (%)
Residents speaking English at home - Foreign born (%)
Residents speaking Spanish at home (%)
Residents speaking Spanish at home - Born in the United States (%)
Residents speaking Spanish at home - Native, born elsewhere (%)
Residents speaking Spanish at home - Foreign born (%)
Residents speaking other language at home (%)
Residents speaking other language at home - Born in the United States (%)
Residents speaking other language at home - Native, born elsewhere (%)
Residents speaking other language at home - Foreign born (%)
Marital status - Never married (%)
Marital status - Now married (%)
Marital status - Separated (%)
Marital status - Widowed (%)
Marital status - Divorced (%)
Ancestries Reported - Arab (%)
Ancestries Reported - Czech (%)
Ancestries Reported - Danish (%)
Ancestries Reported - Dutch (%)
Ancestries Reported - English (%)
Ancestries Reported - French (%)
Ancestries Reported - French Canadian (%)
Ancestries Reported - German (%)
Ancestries Reported - Greek (%)
Ancestries Reported - Hungarian (%)
Ancestries Reported - Irish (%)
Ancestries Reported - Italian (%)
Ancestries Reported - Lithuanian (%)
Ancestries Reported - Norwegian (%)
Ancestries Reported - Polish (%)
Ancestries Reported - Portuguese (%)
Ancestries Reported - Russian (%)
Ancestries Reported - Scotch-Irish (%)
Ancestries Reported - Scottish (%)
Ancestries Reported - Slovak (%)
Ancestries Reported - Subsaharan African (%)
Ancestries Reported - Swedish (%)
Ancestries Reported - Swiss (%)
Ancestries Reported - Ukrainian (%)
Ancestries Reported - United States (%)
Ancestries Reported - Welsh (%)
Ancestries Reported - West Indian (%)
Ancestries Reported - Other (%)
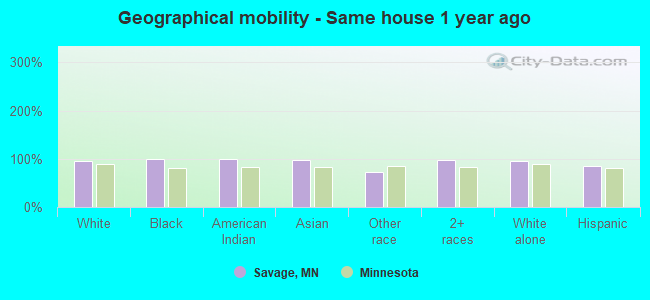
Geographical mobility - Same house 1 year ago (%)
Geographical mobility - Same house 1 year ago (%) - White
Geographical mobility - Same house 1 year ago (%) - Black or African American
Geographical mobility - Same house 1 year ago (%) - Asian
Geographical mobility - Same house 1 year ago (%) - Hispanic or Latino
Geographical mobility - Same house 1 year ago (%) - American Indian and Alaska Native
Geographical mobility - Same house 1 year ago (%) - Multirace
Geographical mobility - Same house 1 year ago (%) - Other Race
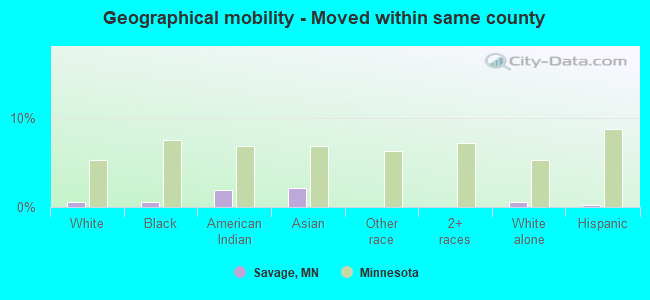
Geographical mobility - Moved within same county (%)
Geographical mobility - Moved within same county (%) - White
Geographical mobility - Moved within same county (%) - Black or African American
Geographical mobility - Moved within same county (%) - Asian
Geographical mobility - Moved within same county (%) - Hispanic or Latino
Geographical mobility - Moved within same county (%) - American Indian and Alaska Native
Geographical mobility - Moved within same county (%) - Multirace
Geographical mobility - Moved within same county (%) - Other Race
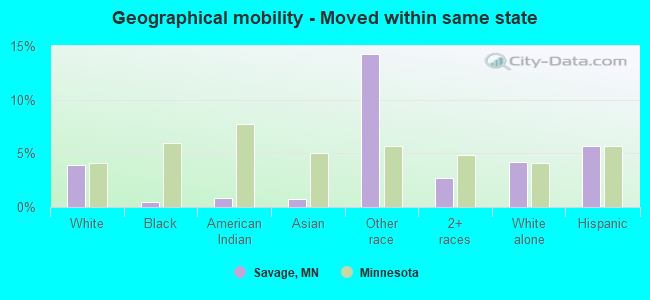
Geographical mobility - Moved from different county within same state (%)
Geographical mobility - Moved from different county within same state (%) - White
Geographical mobility - Moved from different county within same state (%) - Black or African American
Geographical mobility - Moved from different county within same state (%) - Asian
Geographical mobility - Moved from different county within same state (%) - Hispanic or Latino
Geographical mobility - Moved from different county within same state (%) - American Indian and Alaska Native
Geographical mobility - Moved from different county within same state (%) - Multirace
Geographical mobility - Moved from different county within same state (%) - Other Race
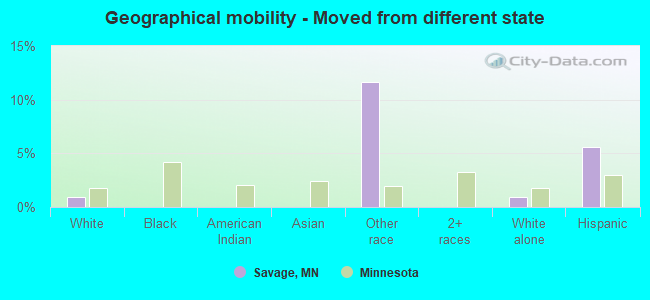
Geographical mobility - Moved from different state (%)
Geographical mobility - Moved from different state (%) - White
Geographical mobility - Moved from different state (%) - Black or African American
Geographical mobility - Moved from different state (%) - Asian
Geographical mobility - Moved from different state (%) - Hispanic or Latino
Geographical mobility - Moved from different state (%) - American Indian and Alaska Native
Geographical mobility - Moved from different state (%) - Multirace
Geographical mobility - Moved from different state (%) - Other Race
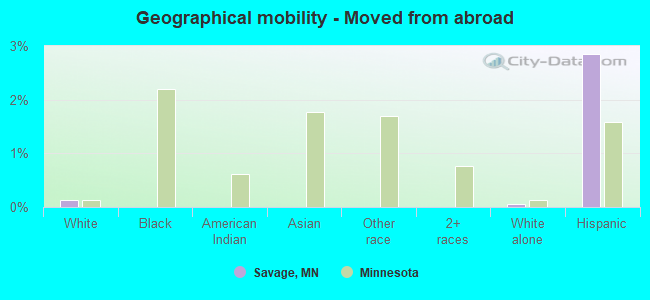
Geographical mobility - Moved from abroad (%)
Geographical mobility - Moved from abroad (%) - White
Geographical mobility - Moved from abroad (%) - Black or African American
Geographical mobility - Moved from abroad (%) - Asian
Geographical mobility - Moved from abroad (%) - Hispanic or Latino
Geographical mobility - Moved from abroad (%) - American Indian and Alaska Native
Geographical mobility - Moved from abroad (%) - Multirace
Geographical mobility - Moved from abroad (%) - Other Race
Place of birth for the foreign-born population - Ireland (%)
Place of birth for the foreign-born population - Denmark (%)
Place of birth for the foreign-born population - Norway (%)
Place of birth for the foreign-born population - Sweden (%)
Place of birth for the foreign-born population - United Kingdom (%)
Place of birth for the foreign-born population - England (%)
Place of birth for the foreign-born population - Scotland (%)
Place of birth for the foreign-born population - Other Northern Europe (%)
Place of birth for the foreign-born population - Austria (%)
Place of birth for the foreign-born population - Belgium (%)
Place of birth for the foreign-born population - France (%)
Place of birth for the foreign-born population - Germany (%)
Place of birth for the foreign-born population - Netherlands (%)
Place of birth for the foreign-born population - Switzerland (%)
Place of birth for the foreign-born population - Other Western Europe (%)
Place of birth for the foreign-born population - Greece (%)
Place of birth for the foreign-born population - Italy (%)
Place of birth for the foreign-born population - Portugal (%)
Place of birth for the foreign-born population - Spain (%)
Place of birth for the foreign-born population - Other Southern Europe (%)
Place of birth for the foreign-born population - Albania (%)
Place of birth for the foreign-born population - Belarus (%)
Place of birth for the foreign-born population - Bosnia and Herzegovina (%)
Place of birth for the foreign-born population - Bulgaria (%)
Place of birth for the foreign-born population - Croatia (%)
Place of birth for the foreign-born population - Czechoslovakia (%)
Place of birth for the foreign-born population - Hungary (%)
Place of birth for the foreign-born population - Latvia (%)
Place of birth for the foreign-born population - Lithuania (%)
Place of birth for the foreign-born population - North Macedonia (Macedonia) (%)
Place of birth for the foreign-born population - Moldova (%)
Place of birth for the foreign-born population - Poland (%)
Place of birth for the foreign-born population - Romania (%)
Place of birth for the foreign-born population - Russia (%)
Place of birth for the foreign-born population - Serbia (%)
Place of birth for the foreign-born population - Ukraine (%)
Place of birth for the foreign-born population - Other Eastern Europe (%)
Place of birth for the foreign-born population - China (%)
Place of birth for the foreign-born population - Hong Kong (%)
Place of birth for the foreign-born population - Taiwan (%)
Place of birth for the foreign-born population - Japan (%)
Place of birth for the foreign-born population - Korea (%)
Place of birth for the foreign-born population - Other Eastern Asia (%)
Place of birth for the foreign-born population - Afghanistan (%)
Place of birth for the foreign-born population - Bangladesh (%)
Place of birth for the foreign-born population - India (%)
Place of birth for the foreign-born population - Iran (%)
Place of birth for the foreign-born population - Kazakhstan (%)
Place of birth for the foreign-born population - Nepal (%)
Place of birth for the foreign-born population - Pakistan (%)
Place of birth for the foreign-born population - Sri Lanka (%)
Place of birth for the foreign-born population - Uzbekistan (%)
Place of birth for the foreign-born population - Other South Central Asia (%)
Place of birth for the foreign-born population - Burma (%)
Place of birth for the foreign-born population - Cambodia (%)
Place of birth for the foreign-born population - Indonesia (%)
Place of birth for the foreign-born population - Laos (%)
Place of birth for the foreign-born population - Malaysia (%)
Place of birth for the foreign-born population - Philippines (%)
Place of birth for the foreign-born population - Singapore (%)
Place of birth for the foreign-born population - Thailand (%)
Place of birth for the foreign-born population - Vietnam (%)
Place of birth for the foreign-born population - Other South Eastern Asia (%)
Place of birth for the foreign-born population - Armenia (%)
Place of birth for the foreign-born population - Iraq (%)
Place of birth for the foreign-born population - Israel (%)
Place of birth for the foreign-born population - Jordan (%)
Place of birth for the foreign-born population - Kuwait (%)
Place of birth for the foreign-born population - Lebanon (%)
Place of birth for the foreign-born population - Saudi Arabia (%)
Place of birth for the foreign-born population - Syria (%)
Place of birth for the foreign-born population - Turkey (%)
Place of birth for the foreign-born population - Yemen (%)
Place of birth for the foreign-born population - Other Western Asia (%)
Place of birth for the foreign-born population - Eritrea (%)
Place of birth for the foreign-born population - Ethiopia (%)
Place of birth for the foreign-born population - Kenya (%)
Place of birth for the foreign-born population - Somalia (%)
Place of birth for the foreign-born population - Uganda (%)
Place of birth for the foreign-born population - Zimbabwe (%)
Place of birth for the foreign-born population - Other Eastern Africa (%)
Place of birth for the foreign-born population - Cameroon (%)
Place of birth for the foreign-born population - Congo (%)
Place of birth for the foreign-born population - Democratic Republic of Congo (Zaire) (%)
Place of birth for the foreign-born population - Other Middle Africa (%)
Place of birth for the foreign-born population - Egypt (%)
Place of birth for the foreign-born population - Morocco (%)
Place of birth for the foreign-born population - Sudan (%)
Place of birth for the foreign-born population - Other Northern Africa (%)
Place of birth for the foreign-born population - South Africa (%)
Place of birth for the foreign-born population - Other Southern Africa (%)
Place of birth for the foreign-born population - Cabo Verde (%)
Place of birth for the foreign-born population - Ghana (%)
Place of birth for the foreign-born population - Liberia (%)
Place of birth for the foreign-born population - Nigeria (%)
Place of birth for the foreign-born population - Senegal (%)
Place of birth for the foreign-born population - Sierra Leone (%)
Place of birth for the foreign-born population - Other Western Africa (%)
Place of birth for the foreign-born population - Australia (%)
Place of birth for the foreign-born population - New Zealand (%)
Place of birth for the foreign-born population - Fiji (%)
Place of birth for the foreign-born population - Micronesia (%)
Place of birth for the foreign-born population - Bahamas (%)
Place of birth for the foreign-born population - Barbados (%)
Place of birth for the foreign-born population - Cuba (%)
Place of birth for the foreign-born population - Dominica (%)
Place of birth for the foreign-born population - Dominican Republic (%)
Place of birth for the foreign-born population - Grenada (%)
Place of birth for the foreign-born population - Haiti (%)
Place of birth for the foreign-born population - Jamaica (%)
Place of birth for the foreign-born population - St. Vincent and the Grenadines (%)
Place of birth for the foreign-born population - Trinidad and Tobago (%)
Place of birth for the foreign-born population - West Indies (%)
Place of birth for the foreign-born population - Other Caribbean (%)
Place of birth for the foreign-born population - Belize (%)
Place of birth for the foreign-born population - Costa Rica (%)
Place of birth for the foreign-born population - El Salvador (%)
Place of birth for the foreign-born population - Guatemala (%)
Place of birth for the foreign-born population - Honduras (%)
Place of birth for the foreign-born population - Mexico (%)
Place of birth for the foreign-born population - Nicaragua (%)
Place of birth for the foreign-born population - Panama (%)
Place of birth for the foreign-born population - Other Central America (%)
Place of birth for the foreign-born population - Argentina (%)
Place of birth for the foreign-born population - Bolivia (%)
Place of birth for the foreign-born population - Brazil (%)
Place of birth for the foreign-born population - Chile (%)
Place of birth for the foreign-born population - Colombia (%)
Place of birth for the foreign-born population - Ecuador (%)
Place of birth for the foreign-born population - Guyana (%)
Place of birth for the foreign-born population - Peru (%)
Place of birth for the foreign-born population - Uruguay (%)
Place of birth for the foreign-born population - Venezuela (%)
Place of birth for the foreign-born population - Other South America (%)
Place of birth for the foreign-born population - Canada (%)
Place of birth for the foreign-born population - Other Northern America (%)
Place of birth for the foreign-born population - Other (%)
Latest news about races in Savage, MN collected exclusively by city-data.com from local newspapers, TV, and radio stations
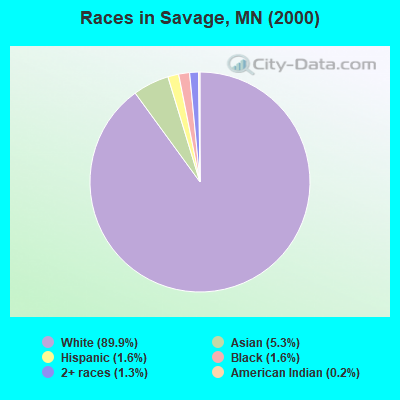
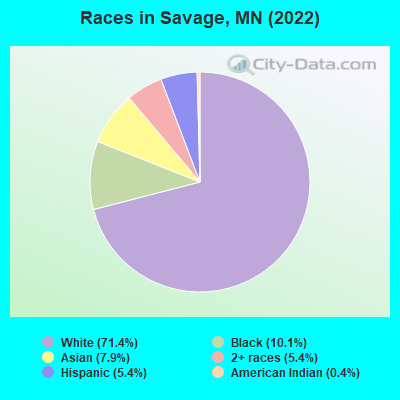
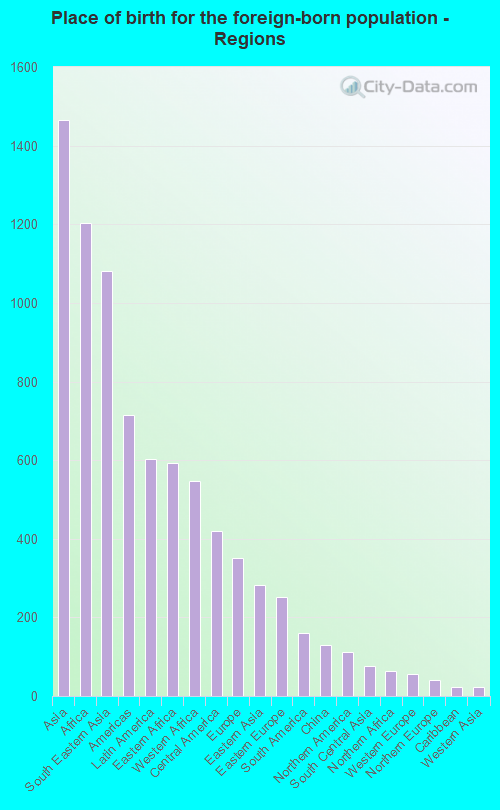
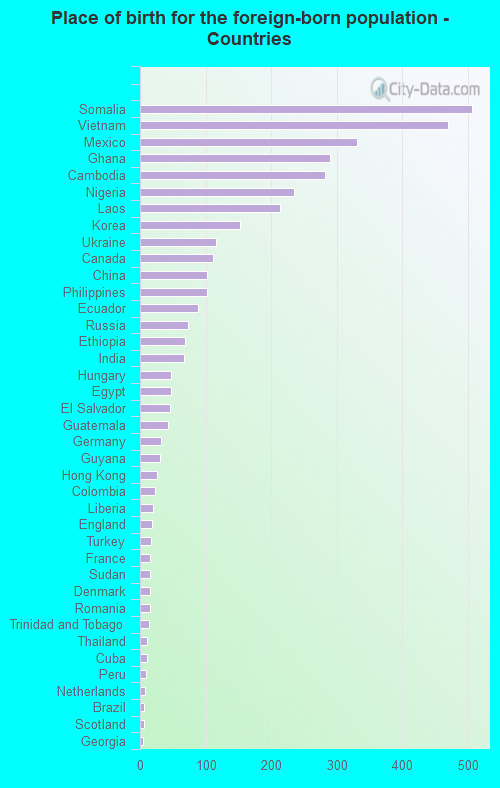
According to 2022 data, the most numerous races in Savage, MN are White alone (23,655 residents), Black alone (3,344 residents), and Hispanic (1,772 residents). 82.7% of Savage residents speak English at home. 11.3% of Savage, MN residents are foreign-born (4.4% born in Asia, 3.6% born in Africa, 1.8% born in Latin America), which is 29.1% greater than the foreign-born rate of 8.0% across the entire state of Minnesota.
Race distribution in Savage
2000 2022
4,337,143 88.2% White alone 168,813 3.4% Black alone 143,382 2.9% Hispanic 141,083 2.9% Asian alone 70,304 1.4% Two or more races 52,009 1.1% American Indian alone 5,031 0.1% Other race alone 1,714 0.03% Native Hawaiian and Other
4,356,347 76.2% White alone 395,179 6.9% Black alone 333,830 5.8% Hispanic 294,800 5.2% Asian alone 259,649 4.5% Two or more races 42,125 0.7% American Indian alone 32,976 0.6% Other race alone 2,278 0.04% Native Hawaiian and Other
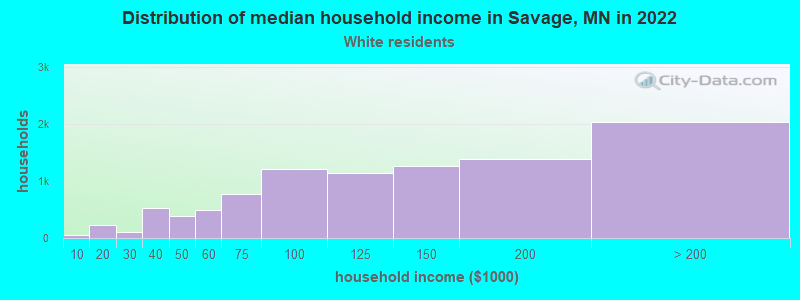
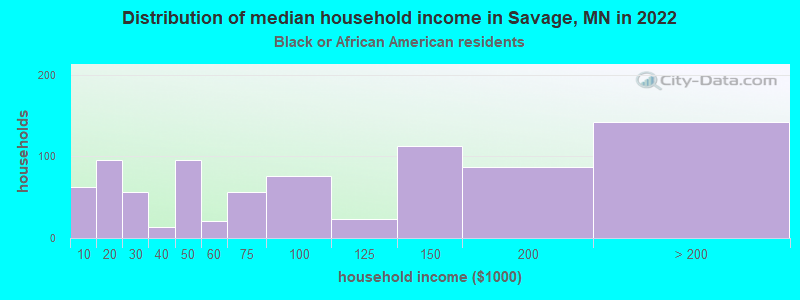
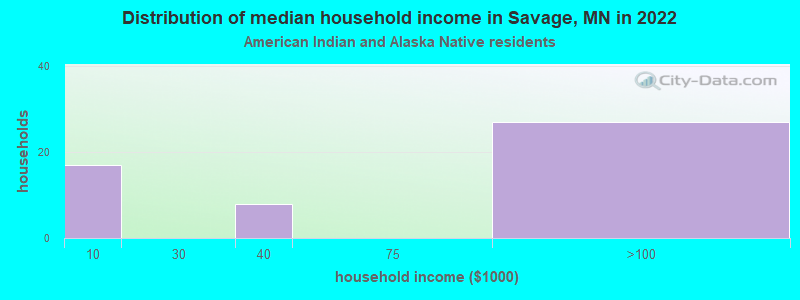
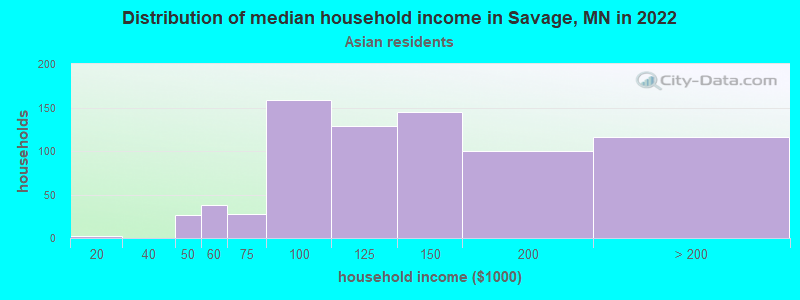
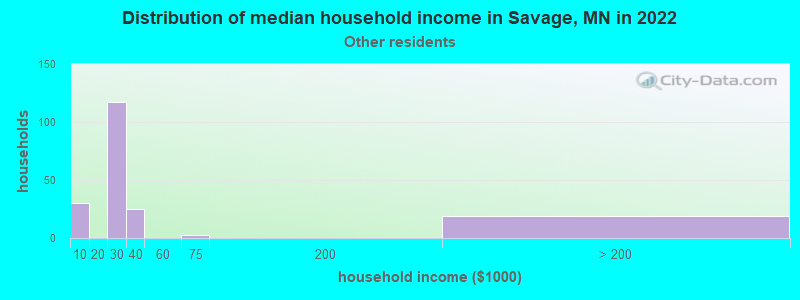
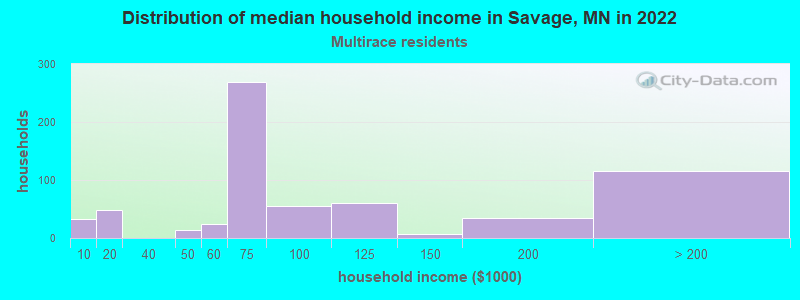
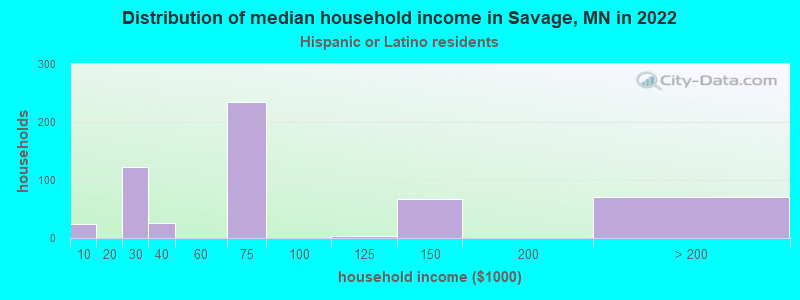
Income and house value in Savage Median household income in 2022 $121,197 White non-Hispanic householders$118,789 Black householders$138,165 Asian householders$32,059 Some other race householders$88,000 Two or more races householders$89,283 Hispanic or Latino race householdersMedian 2022 house value $398,770 White Non-Hispanic householders$369,022 Black or African American householders$424,269 American Indian or Alaska Native householders $353,911 Asian householders$291,109 Some other race householders$308,108 Two or more races householders$383,660 Hispanic or Latino householders
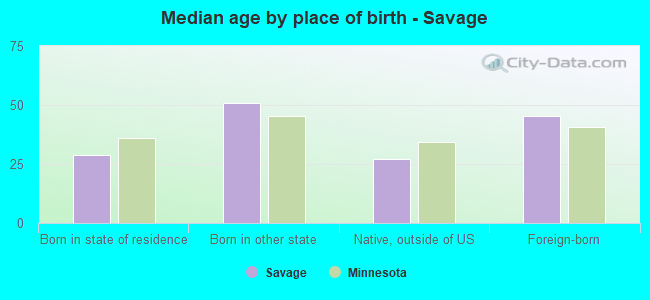
Median age by race in Savage
41.0 Median age for White residents39.6 42.6 24.2 Median age for Black or African American residents37.5 17.3 54.0 Median age for American Indian / Alaska Native residents8.0 57.2 38.1 Median age for Asian residents43.4 35.4 -744,336,568.8 Median age for Native Hawaiian / Pacific Islander residents-856,799,036.4 -534,959,349.1 29.8 Median age for Other race residents25.1 36.2 23.2 Median age for Two or more races residents25.8 16.5 41.4 Median age for White alone residents39.8 42.8 38.2 Median age for Hispanic or Latino residents34.3 33.6
Owner/renter occupied households by race in Savage
House owners and renters - White residents 8,479 88.6% Owner occupied1,094 11.4% Renter occupiedHouse owners and renters - Black or African American residents 540 61.3% Owner occupied341 38.7% Renter occupiedHouse owners and renters - American Indian / Alaska Native residents 53 100.0% Owner occupiedHouse owners and renters - Asian residents 681 96.8% Owner occupied22 3.2% Renter occupiedHouse owners and renters - Other race residents 74 46.2% Owner occupied86 53.8% Renter occupiedHouse owners and renters - Two or more races residents 470 86.3% Owner occupied74 13.7% Renter occupiedHouse owners and renters - White alone residents 8,335 88.2% Owner occupied1,111 11.8% Renter occupiedHouse owners and renters - Hispanic or Latino residents 445 87.4% Owner occupied64 12.6% Renter occupied
Language usage in Savage
English speakers - Total 82.7% of residents of Savage speak English at home.
3.9% of residents speak Spanish at home 800 66.0% Speak English very well413 34.0% Speak English less than very well13.5% of residents speak other language at home 2,587 61.7% Speak English very well1,606 38.3% Speak English less than very well
English speakers - Born in the United States 96.5% of residents of Savage speak English at home.
2.6% of residents speak Spanish at home 140 78.2% Speak English very well39 21.8% Speak English less than very well1.1% of residents speak other language at home 59 79.7% Speak English very well15 20.3% Speak English less than very well
English speakers - Native, born elsewhere 60.4% of residents of Savage speak English at home.
10.4% of residents speak other language at home 4 15.4% Speak English very well22 84.6% Speak English less than very well
English speakers - Foreign-born 13.7% of residents of Savage speak English at home.
10.5% of residents speak Spanish at home 138 34.7% Speak English very well260 65.3% Speak English less than very well76.7% of residents speak other language at home 1,561 53.9% Speak English very well1,337 46.1% Speak English less than very well
White (Caucasian) - Speak only English Native:
96.8% (21,943)Foreign-born:
44.5% (178)
White (Caucasian) - Speak another language Native:
3.1% (711)Foreign-born:
59.9% (239)
Black or African American - Speak only English Native:
66.2% (1,163)Foreign-born:
9.4% (126)
Black or African American - Speak another language Native:
32.8% (577)Foreign-born:
90.0% (1,209)
American Indian / Alaska Native - Speak only English Native:
100.0% (90)Foreign-born:
62.1% (34)
Asian - Speak only English Native:
45.5% (348)Foreign-born:
11.2% (196)
Asian - Speak another language Native:
55.7% (426)Foreign-born:
88.8% (1,551)
Other race - Speak only English Native:
5.5% (19)Foreign-born:
8.0% (17)
Other race - Speak another language Native:
66.8% (224)Foreign-born:
100.0% (213)
Two or more races - Speak another language Native:
5.6% (79)Foreign-born:
100.0% (282)
White alone - Speak only English Native:
97.0% (21,398)Foreign-born:
46.5% (207)
White alone - Speak another language Native:
3.0% (672)Foreign-born:
57.4% (255)
Hispanic or Latino - Speak only English Native:
64.0% (797)Foreign-born:
6.7% (26)
Hispanic or Latino - Speak another language Native:
35.3% (440)Foreign-born:
100.0% (389)
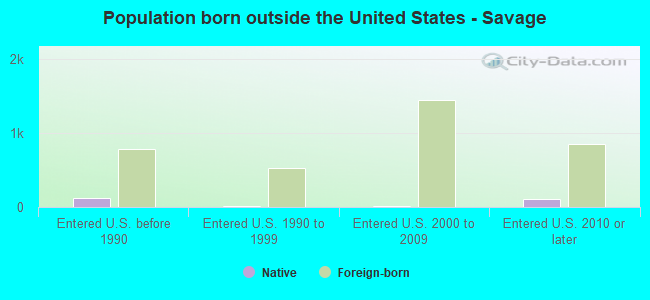
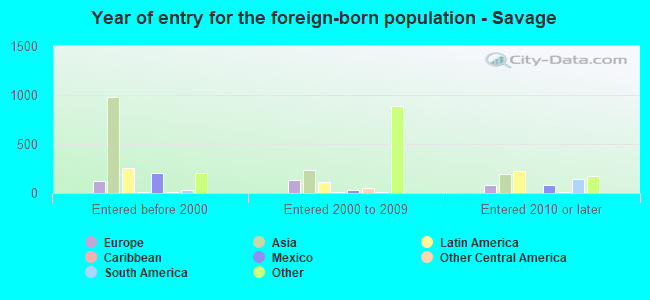
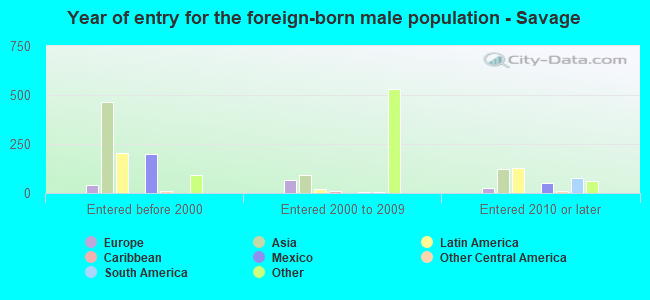
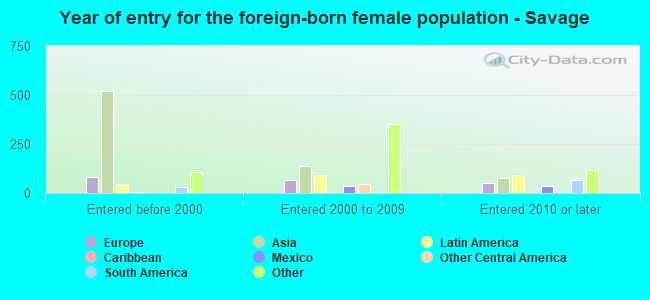
Foreign-born residents in Savage 3,736 residents are foreign born (4.4% Asia , 3.6% Africa , 1.8% Latin America ).
This city:
11.3%Minnesota:
8.5%
Marital status for residents in Savage Marital status - White (Caucasian) population 15 years and over
Males 33.5% Never married59.6% Now married0.0% Separated1.6% Widowed5.3% DivorcedFemales 22.7% Never married61.4% Now married0.1% Separated4.4% Widowed11.3% DivorcedWomen who gave birth in the past 12 months Now married:
100.0% (262)Unmarried:
0.0% (0)
Women who did not give birth in the past 12 months Now married:
53.7% (2,713)Unmarried:
46.3% (2,342)
Marital status - Black or African American population 15 years and over
Males 13.3% Never married77.1% Now married0.0% Separated3.1% Widowed6.6% DivorcedFemales 44.0% Never married43.1% Now married1.7% Separated4.6% Widowed6.6% DivorcedWomen who gave birth in the past 12 months Now married:
100.0% (2)Unmarried:
0.0% (0)
Women who did not give birth in the past 12 months Now married:
43.3% (289)Unmarried:
56.7% (378)
Marital status - American Indian / Alaska Native population 15 years and over
Males 100.0% Never married0.0% Now married0.0% Separated0.0% Widowed0.0% DivorcedFemales 40.0% Never married33.3% Now married0.0% Separated0.0% Widowed26.7% DivorcedWomen who did not give birth in the past 12 months Now married:
15.2% (7)Unmarried:
84.8% (41)
Marital status - Asian population 15 years and over
Males 39.0% Never married48.3% Now married0.0% Separated0.0% Widowed12.7% DivorcedFemales 23.9% Never married56.9% Now married1.0% Separated2.8% Widowed15.4% DivorcedWomen who gave birth in the past 12 months Now married:
100.0% (43)Unmarried:
0.0% (0)
Women who did not give birth in the past 12 months Now married:
50.2% (352)Unmarried:
49.8% (350)
Marital status - Other race population 15 years and over
Males 36.7% Never married56.6% Now married0.0% Separated0.0% Widowed6.6% DivorcedFemales 57.2% Never married41.9% Now married0.9% Separated0.0% Widowed0.0% DivorcedWomen who did not give birth in the past 12 months Now married:
42.8% (120)Unmarried:
57.2% (161)
Marital status - Two or more races population 15 years and over
Males 31.2% Never married68.1% Now married0.0% Separated0.0% Widowed0.7% DivorcedFemales 44.8% Never married40.5% Now married0.0% Separated5.7% Widowed9.0% DivorcedWomen who did not give birth in the past 12 months Now married:
39.2% (150)Unmarried:
60.8% (232)
Marital status - White alone, not Hispanic / Latino population 15 years and over
Males 32.5% Never married60.3% Now married0.0% Separated1.7% Widowed5.5% DivorcedFemales 22.6% Never married61.2% Now married0.1% Separated4.5% Widowed11.5% DivorcedWomen who gave birth in the past 12 months Now married:
100.0% (262)Unmarried:
0.0% (0)
Women who did not give birth in the past 12 months Now married:
53.7% (2,666)Unmarried:
46.3% (2,295)
Marital status - Hispanic or Latino population 15 years and over
Males 36.8% Never married61.4% Now married0.0% Separated0.0% Widowed1.8% DivorcedFemales 41.6% Never married57.9% Now married0.5% Separated0.0% Widowed0.0% DivorcedWomen who did not give birth in the past 12 months Now married:
45.0% (132)Unmarried:
55.0% (162)
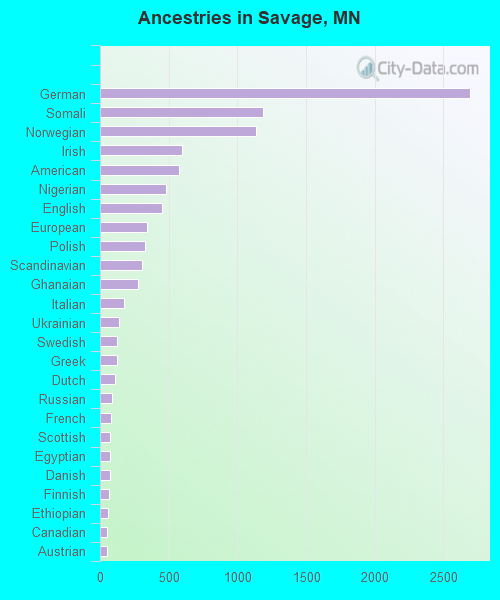
Ancestries in Savage
2,697 19.5% German1,184 8.5% Somali1,138 8.2% Norwegian597 4.3% Irish574 4.1% American480 3.5% Nigerian454 3.3% English341 2.5% European331 2.4% Polish304 2.2% Scandinavian274 2.0% Ghanaian173 1.2% Italian136 1.0% Ukrainian126 0.9% Swedish125 0.9% Greek110 0.8% Dutch89 0.6% Russian80 0.6% French75 0.5% Scottish74 0.5% Egyptian71 0.5% Danish68 0.5% Finnish56 0.4% Ethiopian52 0.4% Canadian51 0.4% Austrian49 0.4% French Canadian47 0.3% Northern European39 0.3% West Indian38 0.3% Hungarian32 0.2% Liberian29 0.2% Czech28 0.2% Belgian25 0.2% Palestinian23 0.2% Slovak23 0.2% African22 0.2% Czechoslovakian22 0.2% Turkish20 0.1% Eastern European18 0.1% Sudanese15 0.1% Romanian13 0.09% Slovene10 0.07% Estonian9 0.06% Welsh6 0.04% Lebanese5 0.04% Scotch-Irish3 0.02% Serbian3 0.02% Icelander2 0.01% British
Geographical mobility in Savage Same house 1 year ago 22,899 95.4% White (Caucasian)2,983 99.2% Black or African American129 98.6% American Indian / Alaska Native2,429 97.8% Asian547 72.9% Other race1,955 97.9% Two or more races22,274 95.0% White alone, not Hispanic / Latino1,430 85.7% Hispanic or LatinoMoved within same county 122 0.5% White / Caucasian17 0.6% Black or African American2 1.9% American Indian / Alaska Native54 2.2% Asian124 0.5% White alone, not Hispanic / Latino3 0.2% Hispanic or LatinoMoved within same state 938 3.9% White / Caucasian15 0.5% Black or African American1 0.9% American Indian / Alaska Native18 0.7% Asian107 14.3% Other race53 2.7% Two or more races975 4.2% White alone, not Hispanic / Latino94 5.7% Hispanic or LatinoMoved from different state 227 0.9% White / Caucasian88 11.7% Other race222 0.9% White alone, not Hispanic / Latino93 5.6% Hispanic or LatinoMoved from abroad 31 0.1% White12 0.1% White alone, not Hispanic / Latino48 2.9% Hispanic or Latino
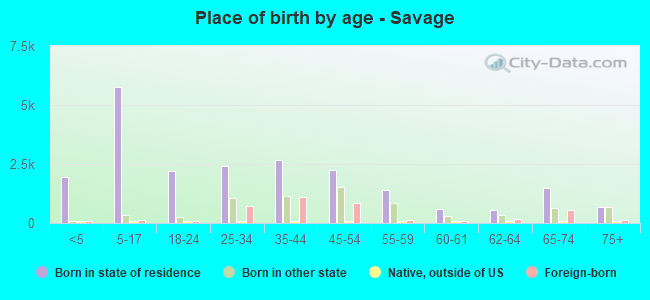
Children Nativity (place of birth) in Savage
Children under 6 years - Living with two parents Both parents native 1,578 100.0% NativeBoth parents foreign-born 548 98.7% Native7 1.3% Foreign-bornOne native, one foreign-born parent 115 100.0% NativeChildren under 6 years - Living with one parent Native parent 209 100.0% NativeForeign-born parent 87 90.2% Native10 9.8% Foreign-bornChildren 6 to 17 years - Living with two parents Both parents native 2,674 99.4% Native15 0.6% Foreign-bornBoth parents foreign-born 777 88.0% Native106 12.0% Foreign-bornOne native, one foreign-born parent 663 99.3% Native5 0.7% Foreign-bornChildren 6 to 17 years - Living with one parent Native parent 877 100.0% NativeForeign-born parent 179 51.1% Native171 48.9% Foreign-born
Grandparents responsible for own grandchildren in Savage
Grandparents (30 to 59 years) White / Caucasian 75 100.0% Not responsible for grandchildrenBlack or African American 13 100.0% Responsible for grandchildrenAsian 4 100.0% Not responsible for grandchildrenWhite alone, not Hispanic / Latino 75 100.0% Not responsible for grandchildrenGrandparents (60 years and over) White / Caucasian 48 67.6% Responsible for grandchildren23 32.4% Not responsible for grandchildrenBlack or African American 49 35.5% Responsible for grandchildren89 64.5% Not responsible for grandchildrenAsian 78 100.0% Not responsible for grandchildrenWhite alone, not Hispanic / Latino 48 67.0% Responsible for grandchildren24 33.0% Not responsible for grandchildren