Races in Santa Fe, New Mexico (NM) Detailed Stats
Data:
Races - White alone (%)
Races - White alone (% change since 2000)
Races - Black alone (%)
Races - Black alone (% change since 2000)
Races - American Indian alone (%)
Races - American Indian alone (% change since 2000)
Races - Asian alone (%)
Races - Asian alone (% change since 2000)
Races - Hispanic (%)
Races - Hispanic (% change since 2000)
Races - Native Hawaiian and Other Pacific Islander alone (%)
Races - Native Hawaiian and Other Pacific Islander alone (% change since 2000)
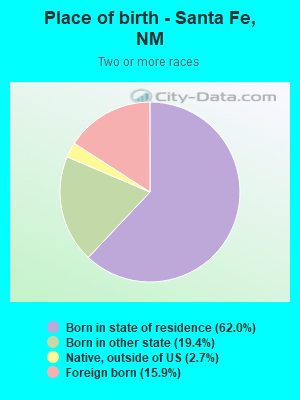
Races - Two or more races(%)
Races - Two or more races(% change since 2000)
Races - Other race alone (%)
Races - Other race alone (% change since 2000)
Racial diversity
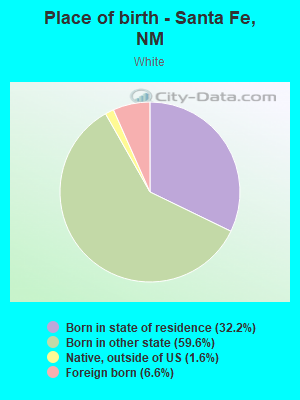
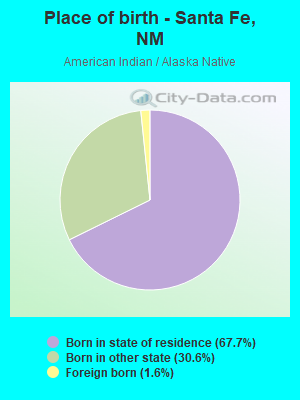
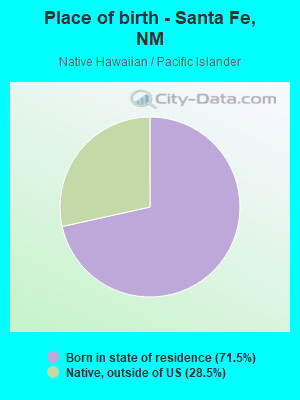
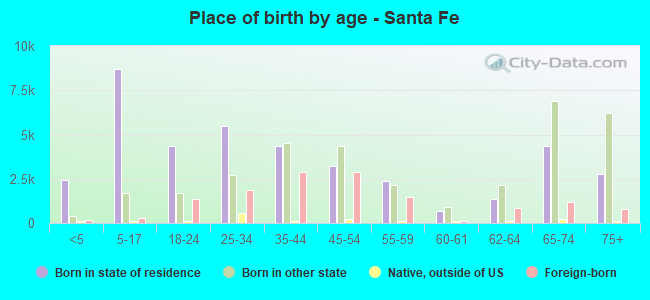
Place of birth - Born in state of residence (%)
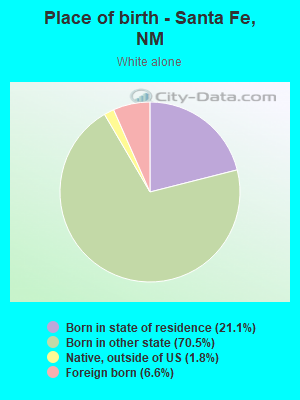
Place of birth - Born in state of residence (%) - White
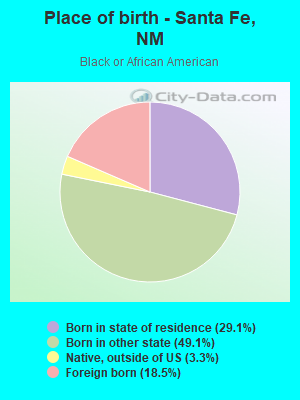
Place of birth - Born in state of residence (%) - Black or African American
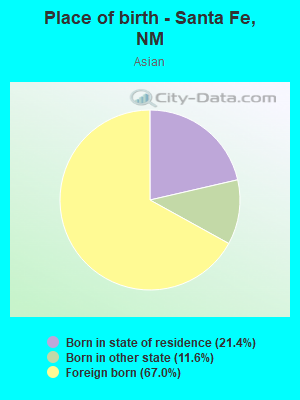
Place of birth - Born in state of residence (%) - Asian
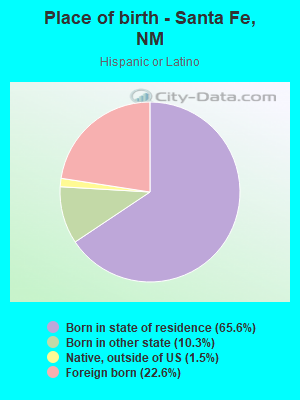
Place of birth - Born in state of residence (%) - Hispanic or Latino
Place of birth - Born in state of residence (%) - American Indian and Alaska Native
Place of birth - Born in state of residence (%) - Multirace
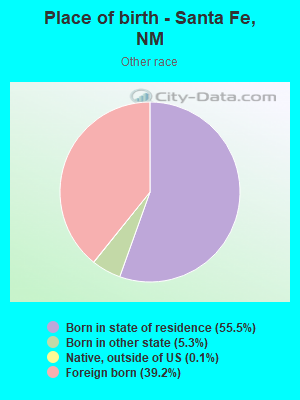
Place of birth - Born in state of residence (%) - Other Race
Place of birth - Born in other state (%)
Place of birth - Born in other state (%) - White
Place of birth - Born in other state (%) - Black or African American
Place of birth - Born in other state (%) - Asian
Place of birth - Born in other state (%) - Hispanic or Latino
Place of birth - Born in other state (%) - American Indian and Alaska Native
Place of birth - Born in other state (%) - Multirace
Place of birth - Born in other state (%) - Other Race
Place of birth - Native, outside of US (%)
Place of birth - Native, outside of US (%) - White
Place of birth - Native, outside of US (%) - Black or African American
Place of birth - Native, outside of US (%) - Asian
Place of birth - Native, outside of US (%) - Hispanic or Latino
Place of birth - Native, outside of US (%) - American Indian and Alaska Native
Place of birth - Native, outside of US (%) - Multirace
Place of birth - Native, outside of US (%) - Other Race
Place of birth - Foreign born (%)
Place of birth - Foreign born (%) - White
Place of birth - Foreign born (%) - Black or African American
Place of birth - Foreign born (%) - Asian
Place of birth - Foreign born (%) - Hispanic or Latino
Place of birth - Foreign born (%) - American Indian and Alaska Native
Place of birth - Foreign born (%) - Multirace
Place of birth - Foreign born (%) - Other Race
Residents speaking English at home (%)
Residents speaking English at home - Born in the United States (%)
Residents speaking English at home - Native, born elsewhere (%)
Residents speaking English at home - Foreign born (%)
Residents speaking Spanish at home (%)
Residents speaking Spanish at home - Born in the United States (%)
Residents speaking Spanish at home - Native, born elsewhere (%)
Residents speaking Spanish at home - Foreign born (%)
Residents speaking other language at home (%)
Residents speaking other language at home - Born in the United States (%)
Residents speaking other language at home - Native, born elsewhere (%)
Residents speaking other language at home - Foreign born (%)
Marital status - Never married (%)
Marital status - Now married (%)
Marital status - Separated (%)
Marital status - Widowed (%)
Marital status - Divorced (%)
Ancestries Reported - Arab (%)
Ancestries Reported - Czech (%)
Ancestries Reported - Danish (%)
Ancestries Reported - Dutch (%)
Ancestries Reported - English (%)
Ancestries Reported - French (%)
Ancestries Reported - French Canadian (%)
Ancestries Reported - German (%)
Ancestries Reported - Greek (%)
Ancestries Reported - Hungarian (%)
Ancestries Reported - Irish (%)
Ancestries Reported - Italian (%)
Ancestries Reported - Lithuanian (%)
Ancestries Reported - Norwegian (%)
Ancestries Reported - Polish (%)
Ancestries Reported - Portuguese (%)
Ancestries Reported - Russian (%)
Ancestries Reported - Scotch-Irish (%)
Ancestries Reported - Scottish (%)
Ancestries Reported - Slovak (%)
Ancestries Reported - Subsaharan African (%)
Ancestries Reported - Swedish (%)
Ancestries Reported - Swiss (%)
Ancestries Reported - Ukrainian (%)
Ancestries Reported - United States (%)
Ancestries Reported - Welsh (%)
Ancestries Reported - West Indian (%)
Ancestries Reported - Other (%)
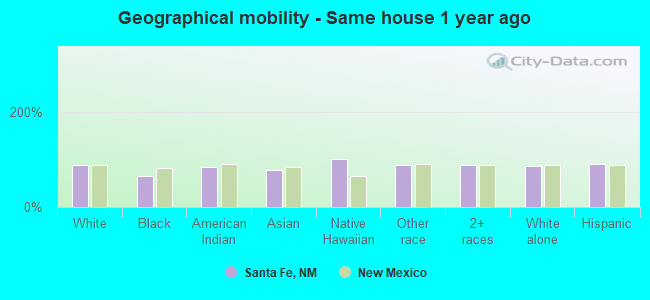
Geographical mobility - Same house 1 year ago (%)
Geographical mobility - Same house 1 year ago (%) - White
Geographical mobility - Same house 1 year ago (%) - Black or African American
Geographical mobility - Same house 1 year ago (%) - Asian
Geographical mobility - Same house 1 year ago (%) - Hispanic or Latino
Geographical mobility - Same house 1 year ago (%) - American Indian and Alaska Native
Geographical mobility - Same house 1 year ago (%) - Multirace
Geographical mobility - Same house 1 year ago (%) - Other Race
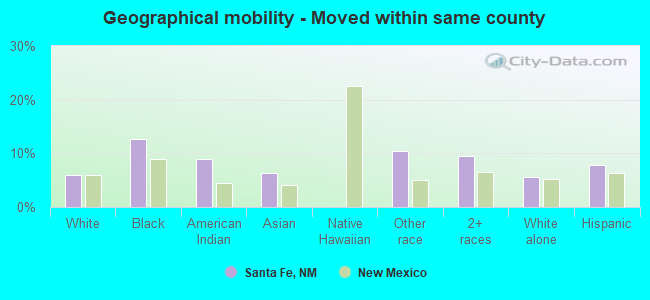
Geographical mobility - Moved within same county (%)
Geographical mobility - Moved within same county (%) - White
Geographical mobility - Moved within same county (%) - Black or African American
Geographical mobility - Moved within same county (%) - Asian
Geographical mobility - Moved within same county (%) - Hispanic or Latino
Geographical mobility - Moved within same county (%) - American Indian and Alaska Native
Geographical mobility - Moved within same county (%) - Multirace
Geographical mobility - Moved within same county (%) - Other Race
Geographical mobility - Moved from different county within same state (%)
Geographical mobility - Moved from different county within same state (%) - White
Geographical mobility - Moved from different county within same state (%) - Black or African American
Geographical mobility - Moved from different county within same state (%) - Asian
Geographical mobility - Moved from different county within same state (%) - Hispanic or Latino
Geographical mobility - Moved from different county within same state (%) - American Indian and Alaska Native
Geographical mobility - Moved from different county within same state (%) - Multirace
Geographical mobility - Moved from different county within same state (%) - Other Race
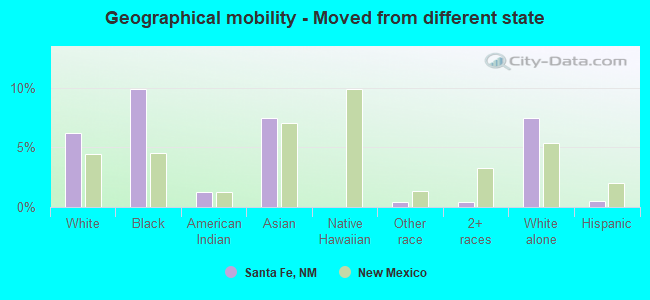
Geographical mobility - Moved from different state (%)
Geographical mobility - Moved from different state (%) - White
Geographical mobility - Moved from different state (%) - Black or African American
Geographical mobility - Moved from different state (%) - Asian
Geographical mobility - Moved from different state (%) - Hispanic or Latino
Geographical mobility - Moved from different state (%) - American Indian and Alaska Native
Geographical mobility - Moved from different state (%) - Multirace
Geographical mobility - Moved from different state (%) - Other Race
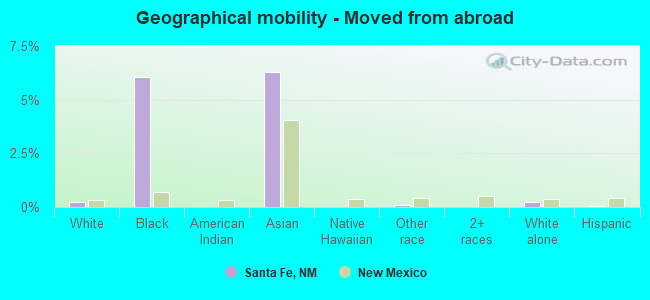
Geographical mobility - Moved from abroad (%)
Geographical mobility - Moved from abroad (%) - White
Geographical mobility - Moved from abroad (%) - Black or African American
Geographical mobility - Moved from abroad (%) - Asian
Geographical mobility - Moved from abroad (%) - Hispanic or Latino
Geographical mobility - Moved from abroad (%) - American Indian and Alaska Native
Geographical mobility - Moved from abroad (%) - Multirace
Geographical mobility - Moved from abroad (%) - Other Race
Place of birth for the foreign-born population - Ireland (%)
Place of birth for the foreign-born population - Denmark (%)
Place of birth for the foreign-born population - Norway (%)
Place of birth for the foreign-born population - Sweden (%)
Place of birth for the foreign-born population - United Kingdom (%)
Place of birth for the foreign-born population - England (%)
Place of birth for the foreign-born population - Scotland (%)
Place of birth for the foreign-born population - Other Northern Europe (%)
Place of birth for the foreign-born population - Austria (%)
Place of birth for the foreign-born population - Belgium (%)
Place of birth for the foreign-born population - France (%)
Place of birth for the foreign-born population - Germany (%)
Place of birth for the foreign-born population - Netherlands (%)
Place of birth for the foreign-born population - Switzerland (%)
Place of birth for the foreign-born population - Other Western Europe (%)
Place of birth for the foreign-born population - Greece (%)
Place of birth for the foreign-born population - Italy (%)
Place of birth for the foreign-born population - Portugal (%)
Place of birth for the foreign-born population - Spain (%)
Place of birth for the foreign-born population - Other Southern Europe (%)
Place of birth for the foreign-born population - Albania (%)
Place of birth for the foreign-born population - Belarus (%)
Place of birth for the foreign-born population - Bosnia and Herzegovina (%)
Place of birth for the foreign-born population - Bulgaria (%)
Place of birth for the foreign-born population - Croatia (%)
Place of birth for the foreign-born population - Czechoslovakia (%)
Place of birth for the foreign-born population - Hungary (%)
Place of birth for the foreign-born population - Latvia (%)
Place of birth for the foreign-born population - Lithuania (%)
Place of birth for the foreign-born population - North Macedonia (Macedonia) (%)
Place of birth for the foreign-born population - Moldova (%)
Place of birth for the foreign-born population - Poland (%)
Place of birth for the foreign-born population - Romania (%)
Place of birth for the foreign-born population - Russia (%)
Place of birth for the foreign-born population - Serbia (%)
Place of birth for the foreign-born population - Ukraine (%)
Place of birth for the foreign-born population - Other Eastern Europe (%)
Place of birth for the foreign-born population - China (%)
Place of birth for the foreign-born population - Hong Kong (%)
Place of birth for the foreign-born population - Taiwan (%)
Place of birth for the foreign-born population - Japan (%)
Place of birth for the foreign-born population - Korea (%)
Place of birth for the foreign-born population - Other Eastern Asia (%)
Place of birth for the foreign-born population - Afghanistan (%)
Place of birth for the foreign-born population - Bangladesh (%)
Place of birth for the foreign-born population - India (%)
Place of birth for the foreign-born population - Iran (%)
Place of birth for the foreign-born population - Kazakhstan (%)
Place of birth for the foreign-born population - Nepal (%)
Place of birth for the foreign-born population - Pakistan (%)
Place of birth for the foreign-born population - Sri Lanka (%)
Place of birth for the foreign-born population - Uzbekistan (%)
Place of birth for the foreign-born population - Other South Central Asia (%)
Place of birth for the foreign-born population - Burma (%)
Place of birth for the foreign-born population - Cambodia (%)
Place of birth for the foreign-born population - Indonesia (%)
Place of birth for the foreign-born population - Laos (%)
Place of birth for the foreign-born population - Malaysia (%)
Place of birth for the foreign-born population - Philippines (%)
Place of birth for the foreign-born population - Singapore (%)
Place of birth for the foreign-born population - Thailand (%)
Place of birth for the foreign-born population - Vietnam (%)
Place of birth for the foreign-born population - Other South Eastern Asia (%)
Place of birth for the foreign-born population - Armenia (%)
Place of birth for the foreign-born population - Iraq (%)
Place of birth for the foreign-born population - Israel (%)
Place of birth for the foreign-born population - Jordan (%)
Place of birth for the foreign-born population - Kuwait (%)
Place of birth for the foreign-born population - Lebanon (%)
Place of birth for the foreign-born population - Saudi Arabia (%)
Place of birth for the foreign-born population - Syria (%)
Place of birth for the foreign-born population - Turkey (%)
Place of birth for the foreign-born population - Yemen (%)
Place of birth for the foreign-born population - Other Western Asia (%)
Place of birth for the foreign-born population - Eritrea (%)
Place of birth for the foreign-born population - Ethiopia (%)
Place of birth for the foreign-born population - Kenya (%)
Place of birth for the foreign-born population - Somalia (%)
Place of birth for the foreign-born population - Uganda (%)
Place of birth for the foreign-born population - Zimbabwe (%)
Place of birth for the foreign-born population - Other Eastern Africa (%)
Place of birth for the foreign-born population - Cameroon (%)
Place of birth for the foreign-born population - Congo (%)
Place of birth for the foreign-born population - Democratic Republic of Congo (Zaire) (%)
Place of birth for the foreign-born population - Other Middle Africa (%)
Place of birth for the foreign-born population - Egypt (%)
Place of birth for the foreign-born population - Morocco (%)
Place of birth for the foreign-born population - Sudan (%)
Place of birth for the foreign-born population - Other Northern Africa (%)
Place of birth for the foreign-born population - South Africa (%)
Place of birth for the foreign-born population - Other Southern Africa (%)
Place of birth for the foreign-born population - Cabo Verde (%)
Place of birth for the foreign-born population - Ghana (%)
Place of birth for the foreign-born population - Liberia (%)
Place of birth for the foreign-born population - Nigeria (%)
Place of birth for the foreign-born population - Senegal (%)
Place of birth for the foreign-born population - Sierra Leone (%)
Place of birth for the foreign-born population - Other Western Africa (%)
Place of birth for the foreign-born population - Australia (%)
Place of birth for the foreign-born population - New Zealand (%)
Place of birth for the foreign-born population - Fiji (%)
Place of birth for the foreign-born population - Micronesia (%)
Place of birth for the foreign-born population - Bahamas (%)
Place of birth for the foreign-born population - Barbados (%)
Place of birth for the foreign-born population - Cuba (%)
Place of birth for the foreign-born population - Dominica (%)
Place of birth for the foreign-born population - Dominican Republic (%)
Place of birth for the foreign-born population - Grenada (%)
Place of birth for the foreign-born population - Haiti (%)
Place of birth for the foreign-born population - Jamaica (%)
Place of birth for the foreign-born population - St. Vincent and the Grenadines (%)
Place of birth for the foreign-born population - Trinidad and Tobago (%)
Place of birth for the foreign-born population - West Indies (%)
Place of birth for the foreign-born population - Other Caribbean (%)
Place of birth for the foreign-born population - Belize (%)
Place of birth for the foreign-born population - Costa Rica (%)
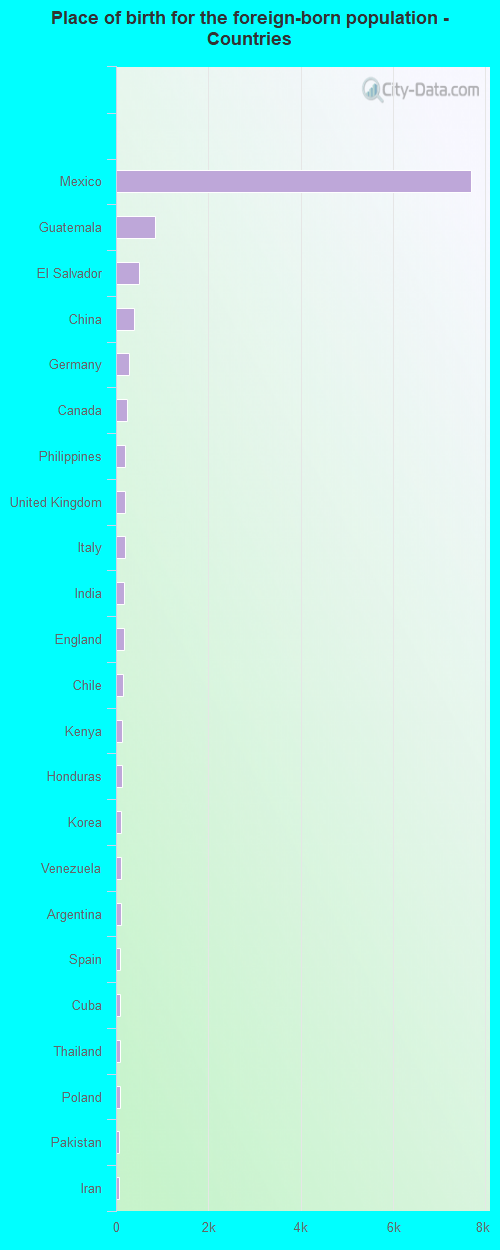
Place of birth for the foreign-born population - El Salvador (%)
Place of birth for the foreign-born population - Guatemala (%)
Place of birth for the foreign-born population - Honduras (%)
Place of birth for the foreign-born population - Mexico (%)
Place of birth for the foreign-born population - Nicaragua (%)
Place of birth for the foreign-born population - Panama (%)
Place of birth for the foreign-born population - Other Central America (%)
Place of birth for the foreign-born population - Argentina (%)
Place of birth for the foreign-born population - Bolivia (%)
Place of birth for the foreign-born population - Brazil (%)
Place of birth for the foreign-born population - Chile (%)
Place of birth for the foreign-born population - Colombia (%)
Place of birth for the foreign-born population - Ecuador (%)
Place of birth for the foreign-born population - Guyana (%)
Place of birth for the foreign-born population - Peru (%)
Place of birth for the foreign-born population - Uruguay (%)
Place of birth for the foreign-born population - Venezuela (%)
Place of birth for the foreign-born population - Other South America (%)
Place of birth for the foreign-born population - Canada (%)
Place of birth for the foreign-born population - Other Northern America (%)
Place of birth for the foreign-born population - Other (%)
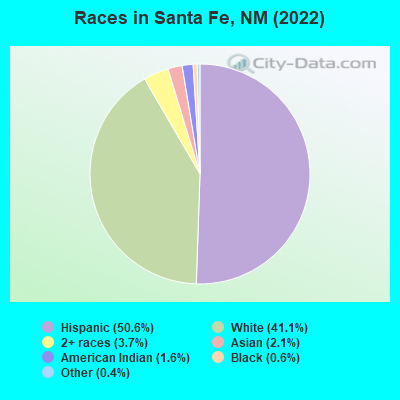
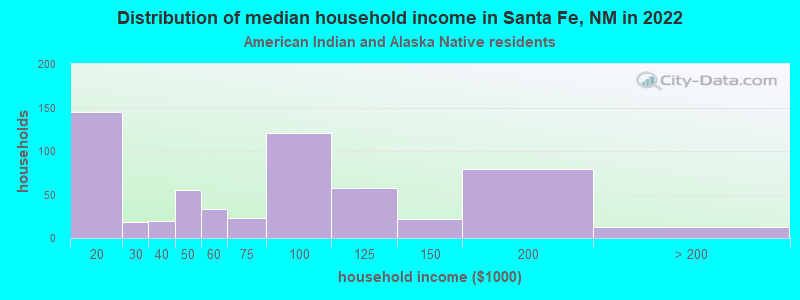
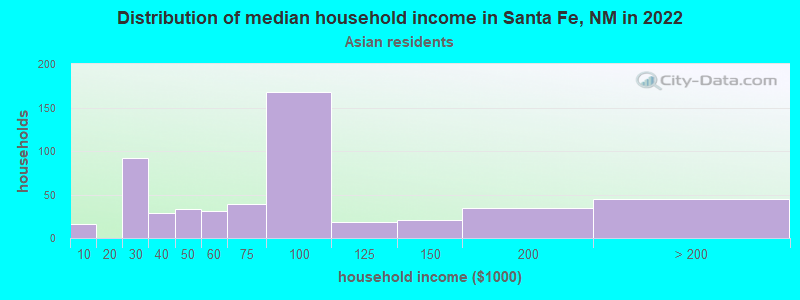
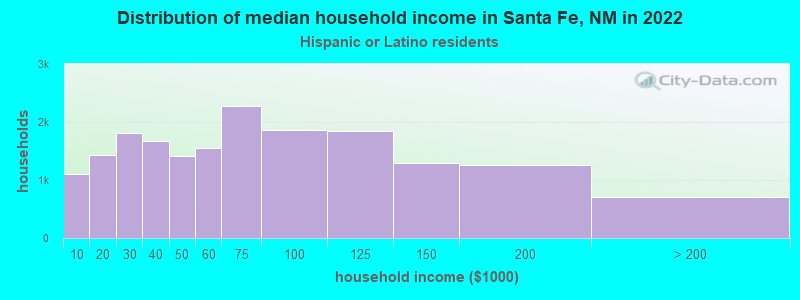
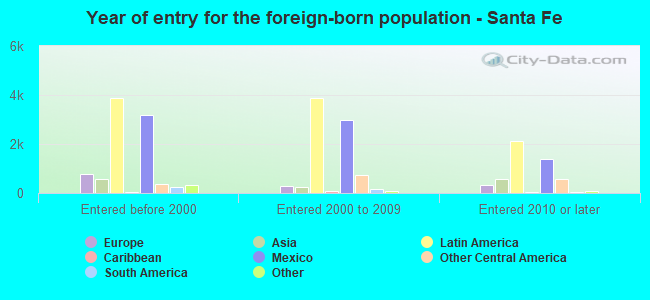
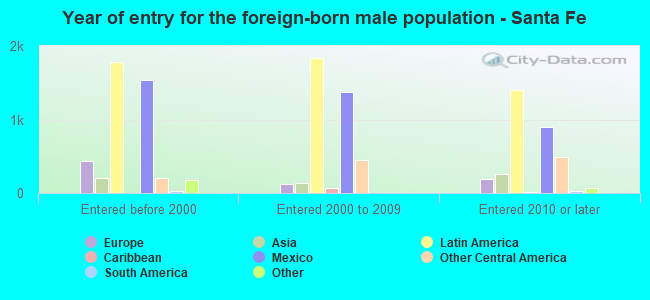
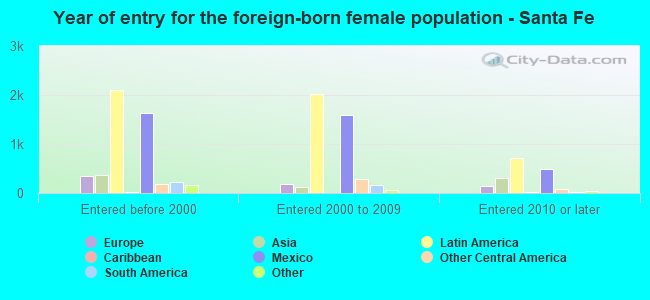
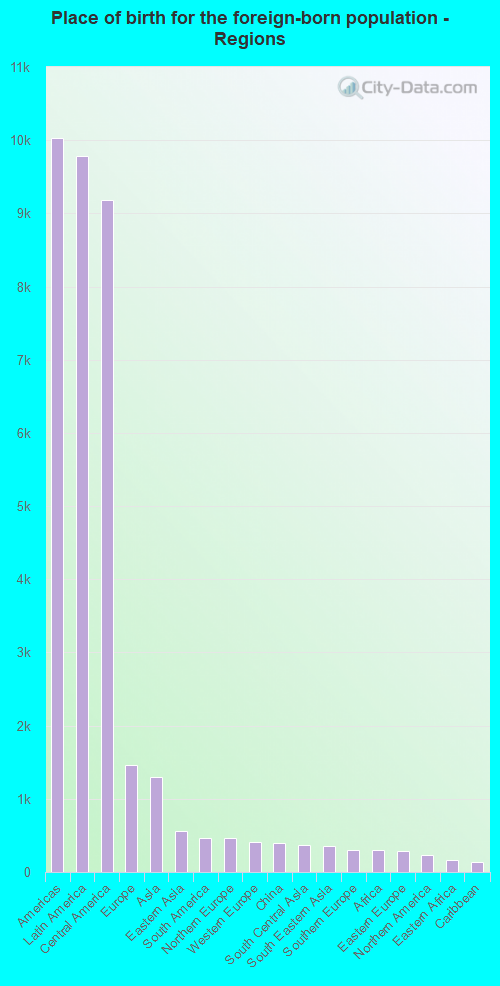
According to 2022 data, the most numerous races in Santa Fe, NM are Hispanic (45,013 residents), White alone (36,585 residents), and American Indian alone (1,413 residents). 71.1% of Santa Fe residents speak English at home. 14.8% of Santa Fe, NM residents are foreign-born (11.0% born in Latin America, 1.6% born in Europe), which is 39.4% greater than the foreign-born rate of 9.0% across the entire state of New Mexico.
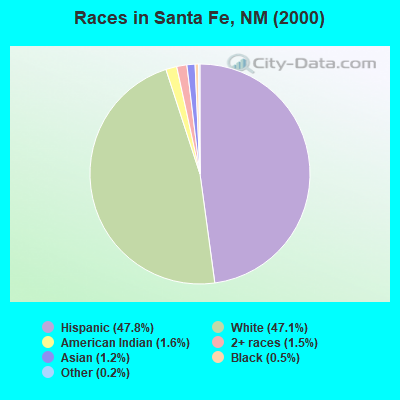
Race distribution in Santa Fe
2000 2022
813,495 44.7% White alone 765,386 42.1% Hispanic 161,460 8.9% American Indian alone 30,654 1.7% Black alone 25,793 1.4% Two or more races 18,257 1.0% Asian alone 3,009 0.2% Other race alone 992 0.05% Native Hawaiian and Other
1,059,867 50.2% Hispanic 735,478 34.8% White alone 171,808 8.1% American Indian alone 65,084 3.1% Two or more races 36,870 1.7% Black alone 35,870 1.7% Asian alone 7,582 0.4% Other race alone 785 0.04% Native Hawaiian and Other
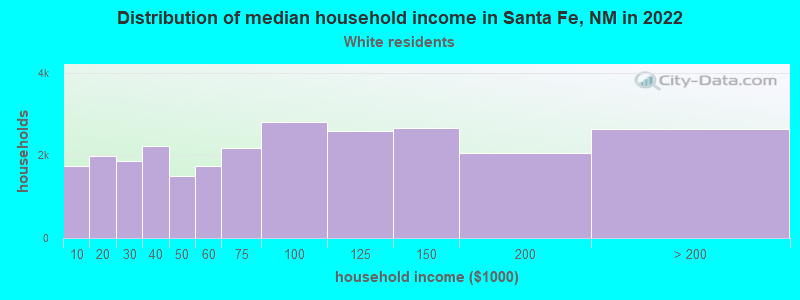
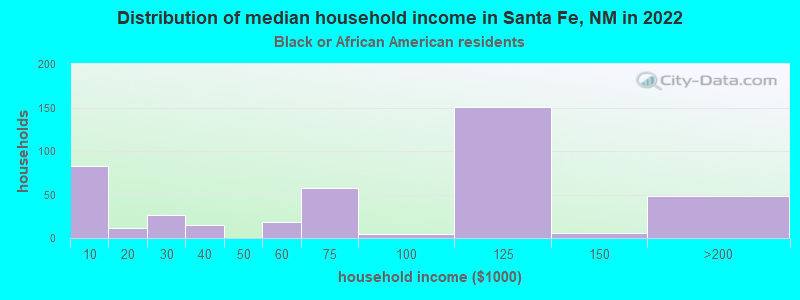
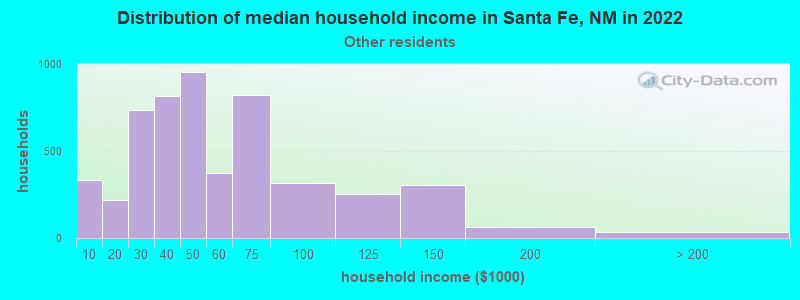
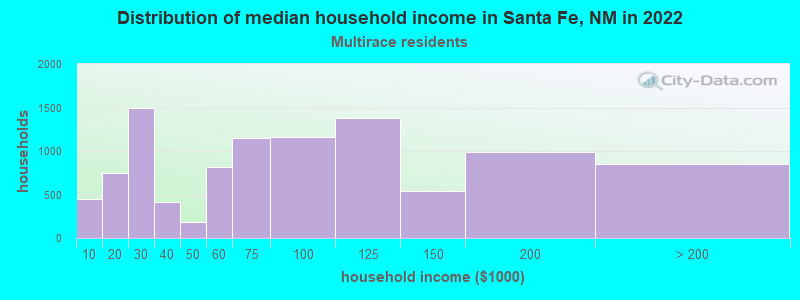
Income and house value in Santa Fe Median household income in 2022 $78,783 White non-Hispanic householders$107,987 Black householders$40,940 American Indian and Alaska Native householders$98,383 Asian householders$43,561 Some other race householders$74,173 Two or more races householders$60,608 Hispanic or Latino race householdersMedian 2022 house value $562,121 White Non-Hispanic householders$403,437 Black or African American householders$344,534 American Indian or Alaska Native householders $359,767 Asian householders$403,945 Some other race householders$413,339 Two or more races householders$407,245 Hispanic or Latino householders
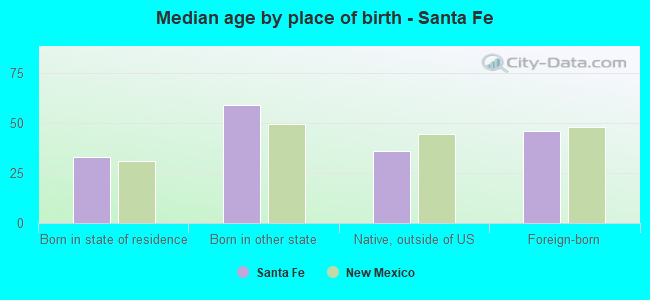
Median age by race in Santa Fe
56.4 Median age for White residents54.6 57.6 33.2 Median age for Black or African American residents43.2 24.1 50.1 Median age for American Indian / Alaska Native residents29.9 50.9 38.4 Median age for Asian residents34.2 47.0 -666,666,666.0 Median age for Native Hawaiian / Pacific Islander residents-666,666,666.0 -666,666,666.0 35.4 Median age for Other race residents28.8 37.8 36.6 Median age for Two or more races residents37.4 35.8 59.7 Median age for White alone residents58.7 60.8 37.4 Median age for Hispanic or Latino residents37.1 37.5
Owner/renter occupied households by race in Santa Fe
House owners and renters - White residents 15,736 60.5% Owner occupied10,293 39.5% Renter occupiedHouse owners and renters - Black or African American residents 163 40.6% Owner occupied238 59.4% Renter occupiedHouse owners and renters - American Indian / Alaska Native residents 400 48.1% Owner occupied432 51.9% Renter occupiedHouse owners and renters - Asian residents 656 71.9% Owner occupied256 28.1% Renter occupiedHouse owners and renters - Native Hawaiian / Pacific Islander residents 72 100.0% Renter occupiedHouse owners and renters - Other race residents 3,443 65.9% Owner occupied1,779 34.1% Renter occupiedHouse owners and renters - Two or more races residents 6,020 59.3% Owner occupied4,136 40.7% Renter occupiedHouse owners and renters - White alone residents 12,810 58.4% Owner occupied9,124 41.6% Renter occupiedHouse owners and renters - Hispanic or Latino residents 11,775 64.7% Owner occupied6,431 35.3% Renter occupied
Language usage in Santa Fe
English speakers - Total 71.1% of residents of Santa Fe speak English at home.
23.8% of residents speak Spanish at home 13,452 65.7% Speak English very well7,019 34.3% Speak English less than very well5.1% of residents speak other language at home 3,601 82.7% Speak English very well754 17.3% Speak English less than very well
English speakers - Born in the United States 90.4% of residents of Santa Fe speak English at home.
5.8% of residents speak Spanish at home 1,817 95.1% Speak English very well94 4.9% Speak English less than very well3.9% of residents speak other language at home 1,102 85.7% Speak English very well184 14.3% Speak English less than very well
English speakers - Native, born elsewhere 54.7% of residents of Santa Fe speak English at home.
39.0% of residents speak Spanish at home 374 68.4% Speak English very well173 31.6% Speak English less than very well6.2% of residents speak other language at home 87 100.0% Speak English very well
English speakers - Foreign-born 28.0% of residents of Santa Fe speak English at home.
57.6% of residents speak Spanish at home 2,639 33.5% Speak English very well5,249 66.5% Speak English less than very well14.4% of residents speak other language at home 1,484 75.1% Speak English very well491 24.9% Speak English less than very well
White (Caucasian) - Speak only English Native:
91.3% (37,525)Foreign-born:
43.3% (1,300)
White (Caucasian) - Speak another language Native:
8.7% (3,570)Foreign-born:
56.7% (1,705)
Black or African American - Speak only English Native:
95.0% (876)Foreign-born:
27.1% (52)
Black or African American - Speak another language Native:
5.0% (46)Foreign-born:
64.4% (124)
American Indian / Alaska Native - Speak only English Native:
88.3% (1,347)Foreign-born:
22.5% (6)
American Indian / Alaska Native - Speak another language Native:
21.6% (329)Foreign-born:
68.9% (19)
Asian - Speak only English Native:
52.6% (276)Foreign-born:
27.0% (334)
Asian - Speak another language Native:
47.4% (249)Foreign-born:
73.0% (902)
Other race - Speak only English Native:
49.3% (4,018)Foreign-born:
10.7% (577)
Other race - Speak another language Native:
50.7% (4,131)Foreign-born:
89.3% (4,839)
Two or more races - Speak only English Native:
69.3% (13,787)Foreign-born:
40.2% (1,591)
Two or more races - Speak another language Native:
30.7% (6,122)Foreign-born:
59.8% (2,370)
White alone - Speak only English Native:
94.7% (31,699)Foreign-born:
53.7% (1,300)
White alone - Speak another language Native:
5.3% (1,783)Foreign-born:
46.3% (1,119)
Hispanic or Latino - Speak only English Native:
64.3% (21,200)Foreign-born:
21.8% (2,168)
Hispanic or Latino - Speak another language Native:
35.7% (11,761)Foreign-born:
78.2% (7,795)
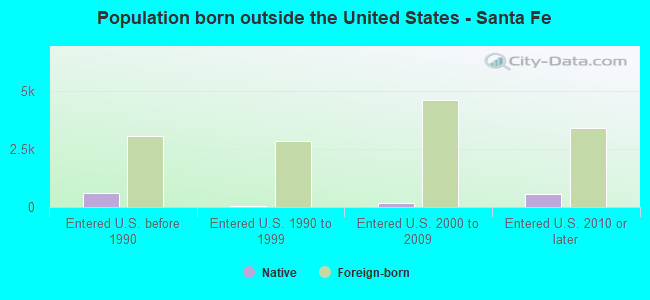
Foreign-born residents in Santa Fe 13,103 residents are foreign born (11.0% Latin America , 1.6% Europe ).
This city:
14.8%New Mexico:
9.2%
Marital status for residents in Santa Fe Marital status - White (Caucasian) population 15 years and over
Males 31.8% Never married45.2% Now married1.3% Separated3.9% Widowed17.9% DivorcedFemales 30.1% Never married37.5% Now married0.8% Separated12.1% Widowed19.5% DivorcedWomen who gave birth in the past 12 months Now married:
100.0% (179)Unmarried:
0.0% (0)
Women who did not give birth in the past 12 months Now married:
39.8% (3,211)Unmarried:
60.2% (4,853)
Marital status - Black or African American population 15 years and over
Males 51.4% Never married28.2% Now married1.5% Separated9.1% Widowed9.9% DivorcedFemales 35.6% Never married38.1% Now married4.8% Separated0.0% Widowed21.5% DivorcedWomen who gave birth in the past 12 months Now married:
100.0% (15)Unmarried:
0.0% (0)
Women who did not give birth in the past 12 months Now married:
27.0% (50)Unmarried:
73.0% (136)
Marital status - American Indian / Alaska Native population 15 years and over
Males 57.7% Never married21.4% Now married1.6% Separated0.0% Widowed19.4% DivorcedFemales 40.9% Never married17.7% Now married2.0% Separated11.4% Widowed28.0% DivorcedWomen who did not give birth in the past 12 months Now married:
4.2% (14)Unmarried:
95.8% (325)
Marital status - Asian population 15 years and over
Males 35.1% Never married47.2% Now married0.0% Separated0.0% Widowed17.7% DivorcedFemales 31.5% Never married59.7% Now married0.9% Separated0.0% Widowed8.0% DivorcedWomen who gave birth in the past 12 months Now married:
100.0% (28)Unmarried:
0.0% (0)
Women who did not give birth in the past 12 months Now married:
48.6% (282)Unmarried:
51.4% (299)
Marital status - Native Hawaiian / Pacific Islander population 15 years and over
Males 0.0% Never married100.0% Now married0.0% Separated0.0% Widowed0.0% DivorcedFemales 100.0% Never married0.0% Now married0.0% Separated0.0% Widowed0.0% DivorcedMarital status - Other race population 15 years and over
Males 42.6% Never married46.4% Now married0.0% Separated0.0% Widowed11.0% DivorcedFemales 39.6% Never married41.6% Now married0.0% Separated3.7% Widowed15.1% DivorcedWomen who gave birth in the past 12 months Now married:
44.0% (16)Unmarried:
56.0% (20)
Women who did not give birth in the past 12 months Now married:
42.7% (1,249)Unmarried:
57.3% (1,675)
Marital status - Two or more races population 15 years and over
Males 43.3% Never married33.8% Now married4.5% Separated2.5% Widowed15.9% DivorcedFemales 42.0% Never married35.5% Now married0.9% Separated4.2% Widowed17.4% DivorcedWomen who gave birth in the past 12 months Now married:
100.0% (373)Unmarried:
0.0% (0)
Women who did not give birth in the past 12 months Now married:
29.2% (2,064)Unmarried:
70.8% (5,009)
Marital status - White alone, not Hispanic / Latino population 15 years and over
Males 32.9% Never married45.5% Now married1.0% Separated2.7% Widowed18.0% DivorcedFemales 28.0% Never married37.7% Now married0.7% Separated12.1% Widowed21.4% DivorcedWomen who gave birth in the past 12 months Now married:
100.0% (104)Unmarried:
0.0% (0)
Women who did not give birth in the past 12 months Now married:
40.1% (2,382)Unmarried:
59.9% (3,557)
Marital status - Hispanic or Latino population 15 years and over
Males 39.5% Never married41.1% Now married2.9% Separated2.1% Widowed14.4% DivorcedFemales 40.5% Never married36.7% Now married0.8% Separated5.6% Widowed16.5% DivorcedWomen who gave birth in the past 12 months Now married:
100.0% (494)Unmarried:
0.0% (0)
Women who did not give birth in the past 12 months Now married:
32.2% (3,662)Unmarried:
67.8% (7,695)
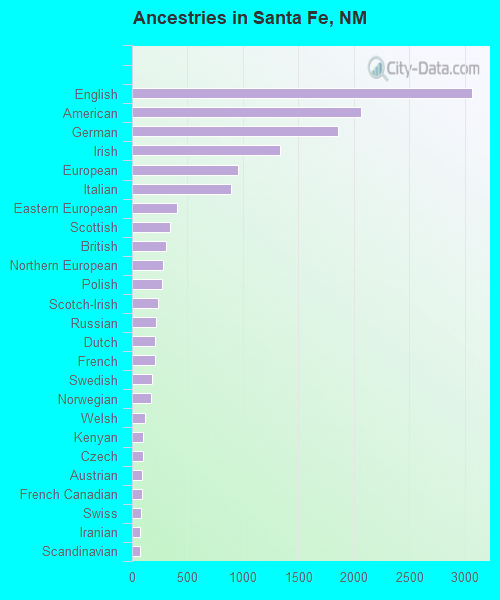
Ancestries in Santa Fe
3,066 6.1% English2,067 4.1% American1,860 3.7% German1,335 2.6% Irish959 1.9% European896 1.8% Italian402 0.8% Eastern European339 0.7% Scottish307 0.6% British283 0.6% Northern European267 0.5% Polish230 0.5% Scotch-Irish220 0.4% Russian209 0.4% Dutch205 0.4% French177 0.4% Swedish175 0.3% Norwegian114 0.2% Welsh100 0.2% Kenyan96 0.2% Czech90 0.2% Austrian89 0.2% French Canadian83 0.2% Swiss73 0.1% Iranian71 0.1% Scandinavian59 0.1% South African55 0.1% Greek52 0.1% Slovak51 0.1% Cajun48 0.09% Finnish43 0.09% Basque37 0.07% Belgian37 0.07% Ukrainian36 0.07% Hungarian33 0.07% African33 0.07% Slavic33 0.07% Australian27 0.05% Lithuanian27 0.05% Canadian27 0.05% Portuguese26 0.05% Serbian25 0.05% Croatian22 0.04% Romanian21 0.04% Danish19 0.04% Jamaican17 0.03% Celtic12 0.02% Turkish11 0.02% Albanian11 0.02% Afghan9 0.02% Brazilian7 0.01% Arab4 0.01% Estonian
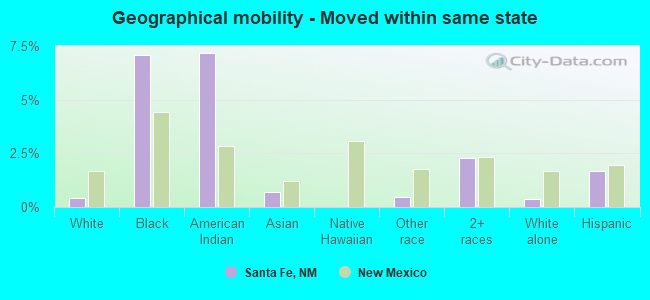
Geographical mobility in Santa Fe Same house 1 year ago 39,231 87.1% White (Caucasian)502 64.4% Black or African American1,334 82.7% American Indian / Alaska Native1,302 76.9% Asian121 100.0% Native Hawaiian / Pacific Islander12,559 88.6% Other race21,608 87.8% Two or more races31,539 86.3% White alone, not Hispanic / Latino39,906 89.9% Hispanic or LatinoMoved within same county 2,716 6.0% White / Caucasian98 12.6% Black or African American144 8.9% American Indian / Alaska Native106 6.3% Asian1,482 10.5% Other race2,359 9.6% Two or more races2,072 5.7% White alone, not Hispanic / Latino3,478 7.8% Hispanic or LatinoMoved within same state 190 0.4% White / Caucasian55 7.1% Black or African American116 7.2% American Indian / Alaska Native12 0.7% Asian66 0.5% Other race558 2.3% Two or more races135 0.4% White alone, not Hispanic / Latino754 1.7% Hispanic or LatinoMoved from different state 2,810 6.2% White / Caucasian77 9.9% Black or African American21 1.3% American Indian / Alaska Native126 7.5% Asian62 0.4% Other race96 0.4% Two or more races2,733 7.5% White alone, not Hispanic / Latino235 0.5% Hispanic or LatinoMoved from abroad 96 0.2% White47 6.0% Black or African American106 6.3% Asian11 0.1% Other race77 0.2% White alone, not Hispanic / Latino30 0.1% Hispanic or Latino
Children Nativity (place of birth) in Santa Fe
Children under 6 years - Living with two parents Both parents native 1,320 100.0% NativeBoth parents foreign-born 238 60.7% Native154 39.3% Foreign-bornOne native, one foreign-born parent 526 100.0% NativeChildren under 6 years - Living with one parent Native parent 684 100.0% NativeForeign-born parent 476 100.0% NativeChildren 6 to 17 years - Living with two parents Both parents native 1,567 100.0% NativeBoth parents foreign-born 1,482 85.8% Native245 14.2% Foreign-bornOne native, one foreign-born parent 769 100.0% NativeChildren 6 to 17 years - Living with one parent Native parent 4,401 100.0% NativeForeign-born parent 1,471 50.0% Native1,471 50.0% Foreign-born
Grandparents responsible for own grandchildren in Santa Fe
Grandparents (30 to 59 years) White / Caucasian 122 57.3% Responsible for grandchildren91 42.7% Not responsible for grandchildrenOther race 188 85.7% Responsible for grandchildren31 14.3% Not responsible for grandchildrenTwo or more races 265 91.1% Responsible for grandchildren26 8.9% Not responsible for grandchildrenWhite alone, not Hispanic / Latino 5 24.1% Responsible for grandchildren17 75.9% Not responsible for grandchildrenHispanic or Latino 316 60.2% Responsible for grandchildren209 39.8% Not responsible for grandchildrenGrandparents (60 years and over) White / Caucasian 170 36.6% Responsible for grandchildren295 63.4% Not responsible for grandchildrenOther race 16 9.6% Responsible for grandchildren153 90.4% Not responsible for grandchildrenTwo or more races 134 36.0% Responsible for grandchildren238 64.0% Not responsible for grandchildrenWhite alone, not Hispanic / Latino 36 19.2% Responsible for grandchildren153 80.8% Not responsible for grandchildrenHispanic or Latino 135 15.0% Responsible for grandchildren765 85.0% Not responsible for grandchildren