Races in Sandy, Utah (UT) Detailed Stats
Data:
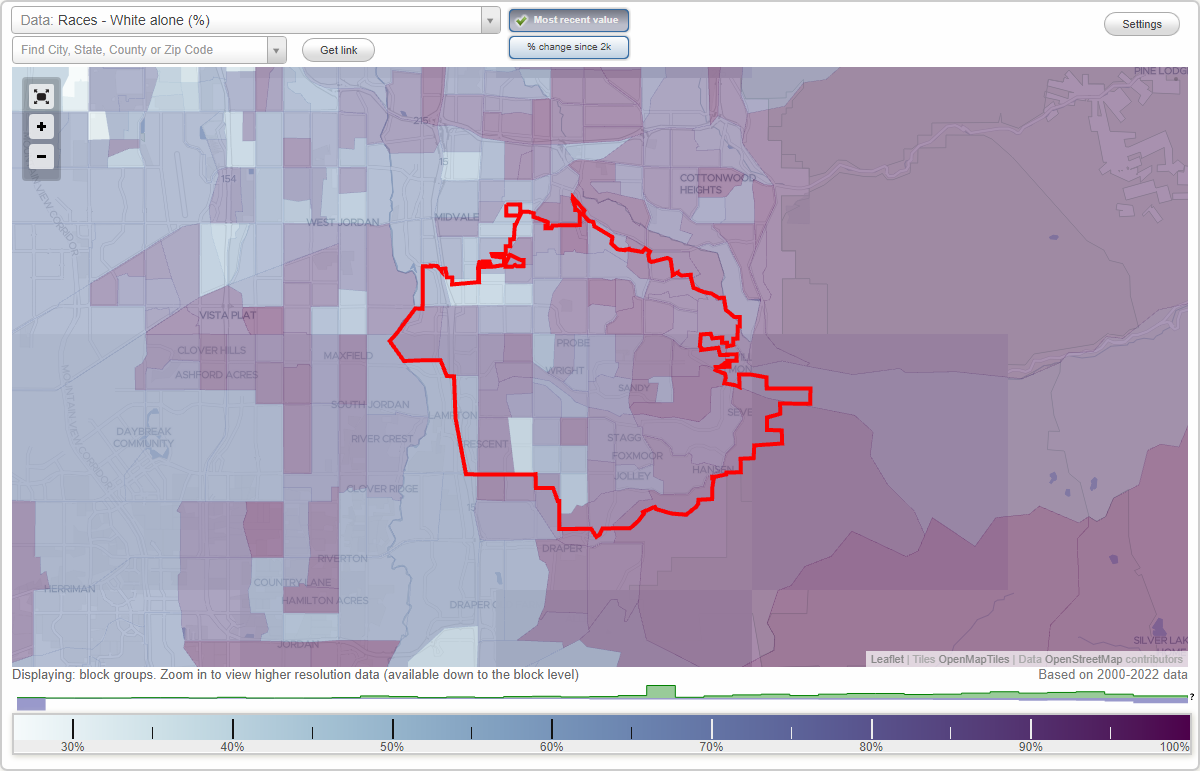
Races - White alone (%)
Races - White alone (% change since 2000)
Races - Black alone (%)
Races - Black alone (% change since 2000)
Races - American Indian alone (%)
Races - American Indian alone (% change since 2000)
Races - Asian alone (%)
Races - Asian alone (% change since 2000)
Races - Hispanic (%)
Races - Hispanic (% change since 2000)
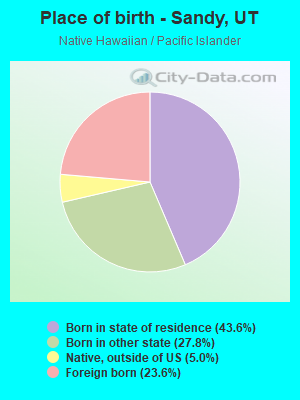
Races - Native Hawaiian and Other Pacific Islander alone (%)
Races - Native Hawaiian and Other Pacific Islander alone (% change since 2000)
Races - Two or more races(%)
Races - Two or more races(% change since 2000)
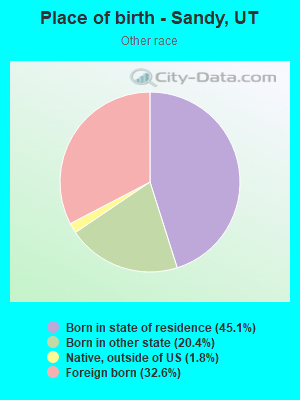
Races - Other race alone (%)
Races - Other race alone (% change since 2000)
Racial diversity
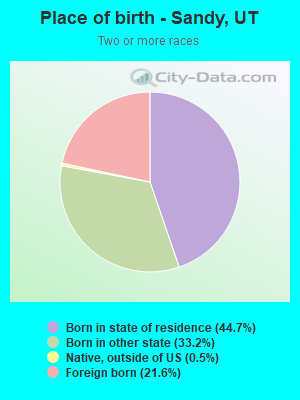
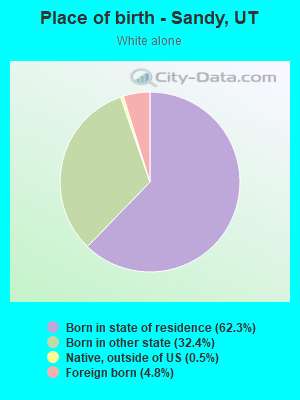
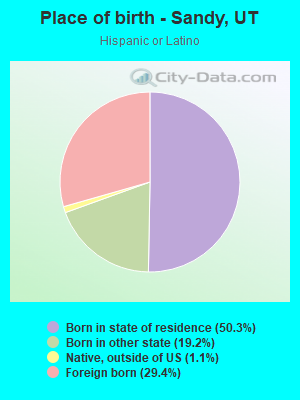
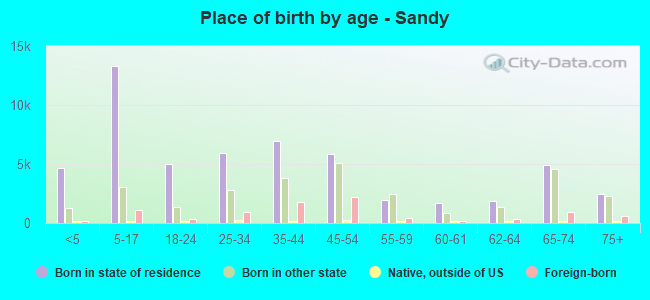
Place of birth - Born in state of residence (%)
Place of birth - Born in state of residence (%) - White
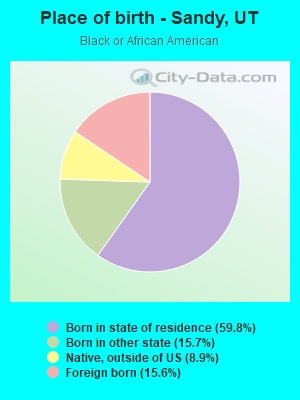
Place of birth - Born in state of residence (%) - Black or African American
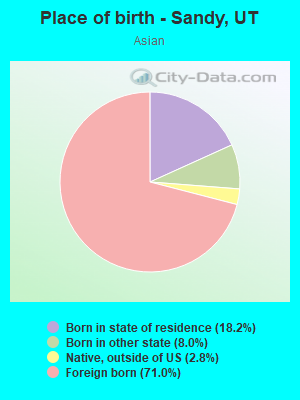
Place of birth - Born in state of residence (%) - Asian
Place of birth - Born in state of residence (%) - Hispanic or Latino
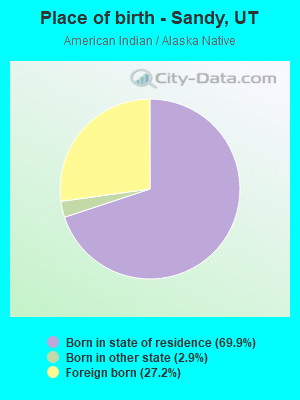
Place of birth - Born in state of residence (%) - American Indian and Alaska Native
Place of birth - Born in state of residence (%) - Multirace
Place of birth - Born in state of residence (%) - Other Race
Place of birth - Born in other state (%)
Place of birth - Born in other state (%) - White
Place of birth - Born in other state (%) - Black or African American
Place of birth - Born in other state (%) - Asian
Place of birth - Born in other state (%) - Hispanic or Latino
Place of birth - Born in other state (%) - American Indian and Alaska Native
Place of birth - Born in other state (%) - Multirace
Place of birth - Born in other state (%) - Other Race
Place of birth - Native, outside of US (%)
Place of birth - Native, outside of US (%) - White
Place of birth - Native, outside of US (%) - Black or African American
Place of birth - Native, outside of US (%) - Asian
Place of birth - Native, outside of US (%) - Hispanic or Latino
Place of birth - Native, outside of US (%) - American Indian and Alaska Native
Place of birth - Native, outside of US (%) - Multirace
Place of birth - Native, outside of US (%) - Other Race
Place of birth - Foreign born (%)
Place of birth - Foreign born (%) - White
Place of birth - Foreign born (%) - Black or African American
Place of birth - Foreign born (%) - Asian
Place of birth - Foreign born (%) - Hispanic or Latino
Place of birth - Foreign born (%) - American Indian and Alaska Native
Place of birth - Foreign born (%) - Multirace
Place of birth - Foreign born (%) - Other Race
Residents speaking English at home (%)
Residents speaking English at home - Born in the United States (%)
Residents speaking English at home - Native, born elsewhere (%)
Residents speaking English at home - Foreign born (%)
Residents speaking Spanish at home (%)
Residents speaking Spanish at home - Born in the United States (%)
Residents speaking Spanish at home - Native, born elsewhere (%)
Residents speaking Spanish at home - Foreign born (%)
Residents speaking other language at home (%)
Residents speaking other language at home - Born in the United States (%)
Residents speaking other language at home - Native, born elsewhere (%)
Residents speaking other language at home - Foreign born (%)
Marital status - Never married (%)
Marital status - Now married (%)
Marital status - Separated (%)
Marital status - Widowed (%)
Marital status - Divorced (%)
Ancestries Reported - Arab (%)
Ancestries Reported - Czech (%)
Ancestries Reported - Danish (%)
Ancestries Reported - Dutch (%)
Ancestries Reported - English (%)
Ancestries Reported - French (%)
Ancestries Reported - French Canadian (%)
Ancestries Reported - German (%)
Ancestries Reported - Greek (%)
Ancestries Reported - Hungarian (%)
Ancestries Reported - Irish (%)
Ancestries Reported - Italian (%)
Ancestries Reported - Lithuanian (%)
Ancestries Reported - Norwegian (%)
Ancestries Reported - Polish (%)
Ancestries Reported - Portuguese (%)
Ancestries Reported - Russian (%)
Ancestries Reported - Scotch-Irish (%)
Ancestries Reported - Scottish (%)
Ancestries Reported - Slovak (%)
Ancestries Reported - Subsaharan African (%)
Ancestries Reported - Swedish (%)
Ancestries Reported - Swiss (%)
Ancestries Reported - Ukrainian (%)
Ancestries Reported - United States (%)
Ancestries Reported - Welsh (%)
Ancestries Reported - West Indian (%)
Ancestries Reported - Other (%)
Geographical mobility - Same house 1 year ago (%)
Geographical mobility - Same house 1 year ago (%) - White
Geographical mobility - Same house 1 year ago (%) - Black or African American
Geographical mobility - Same house 1 year ago (%) - Asian
Geographical mobility - Same house 1 year ago (%) - Hispanic or Latino
Geographical mobility - Same house 1 year ago (%) - American Indian and Alaska Native
Geographical mobility - Same house 1 year ago (%) - Multirace
Geographical mobility - Same house 1 year ago (%) - Other Race
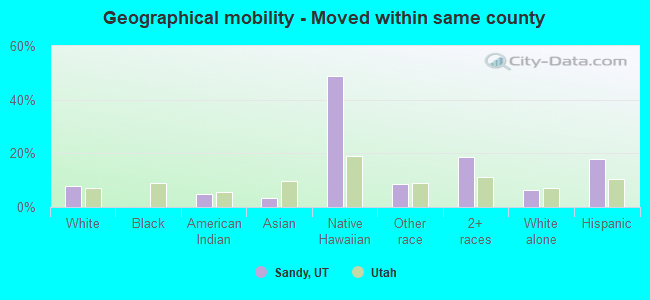
Geographical mobility - Moved within same county (%)
Geographical mobility - Moved within same county (%) - White
Geographical mobility - Moved within same county (%) - Black or African American
Geographical mobility - Moved within same county (%) - Asian
Geographical mobility - Moved within same county (%) - Hispanic or Latino
Geographical mobility - Moved within same county (%) - American Indian and Alaska Native
Geographical mobility - Moved within same county (%) - Multirace
Geographical mobility - Moved within same county (%) - Other Race
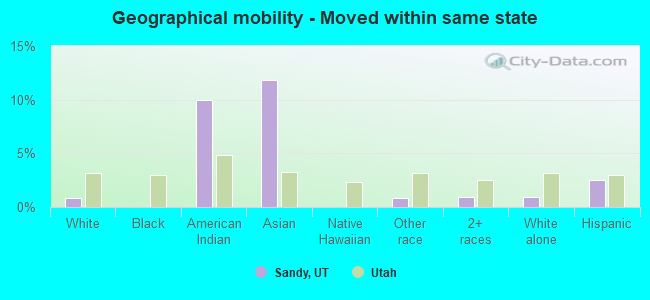
Geographical mobility - Moved from different county within same state (%)
Geographical mobility - Moved from different county within same state (%) - White
Geographical mobility - Moved from different county within same state (%) - Black or African American
Geographical mobility - Moved from different county within same state (%) - Asian
Geographical mobility - Moved from different county within same state (%) - Hispanic or Latino
Geographical mobility - Moved from different county within same state (%) - American Indian and Alaska Native
Geographical mobility - Moved from different county within same state (%) - Multirace
Geographical mobility - Moved from different county within same state (%) - Other Race
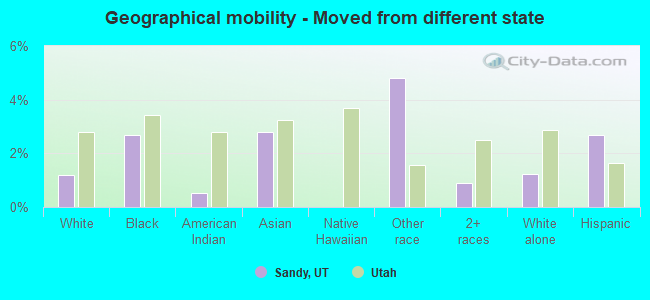
Geographical mobility - Moved from different state (%)
Geographical mobility - Moved from different state (%) - White
Geographical mobility - Moved from different state (%) - Black or African American
Geographical mobility - Moved from different state (%) - Asian
Geographical mobility - Moved from different state (%) - Hispanic or Latino
Geographical mobility - Moved from different state (%) - American Indian and Alaska Native
Geographical mobility - Moved from different state (%) - Multirace
Geographical mobility - Moved from different state (%) - Other Race
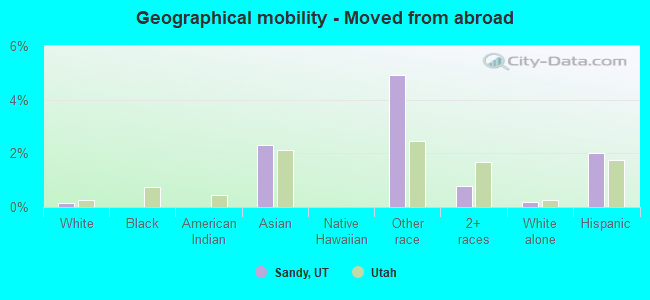
Geographical mobility - Moved from abroad (%)
Geographical mobility - Moved from abroad (%) - White
Geographical mobility - Moved from abroad (%) - Black or African American
Geographical mobility - Moved from abroad (%) - Asian
Geographical mobility - Moved from abroad (%) - Hispanic or Latino
Geographical mobility - Moved from abroad (%) - American Indian and Alaska Native
Geographical mobility - Moved from abroad (%) - Multirace
Geographical mobility - Moved from abroad (%) - Other Race
Place of birth for the foreign-born population - Ireland (%)
Place of birth for the foreign-born population - Denmark (%)
Place of birth for the foreign-born population - Norway (%)
Place of birth for the foreign-born population - Sweden (%)
Place of birth for the foreign-born population - United Kingdom (%)
Place of birth for the foreign-born population - England (%)
Place of birth for the foreign-born population - Scotland (%)
Place of birth for the foreign-born population - Other Northern Europe (%)
Place of birth for the foreign-born population - Austria (%)
Place of birth for the foreign-born population - Belgium (%)
Place of birth for the foreign-born population - France (%)
Place of birth for the foreign-born population - Germany (%)
Place of birth for the foreign-born population - Netherlands (%)
Place of birth for the foreign-born population - Switzerland (%)
Place of birth for the foreign-born population - Other Western Europe (%)
Place of birth for the foreign-born population - Greece (%)
Place of birth for the foreign-born population - Italy (%)
Place of birth for the foreign-born population - Portugal (%)
Place of birth for the foreign-born population - Spain (%)
Place of birth for the foreign-born population - Other Southern Europe (%)
Place of birth for the foreign-born population - Albania (%)
Place of birth for the foreign-born population - Belarus (%)
Place of birth for the foreign-born population - Bosnia and Herzegovina (%)
Place of birth for the foreign-born population - Bulgaria (%)
Place of birth for the foreign-born population - Croatia (%)
Place of birth for the foreign-born population - Czechoslovakia (%)
Place of birth for the foreign-born population - Hungary (%)
Place of birth for the foreign-born population - Latvia (%)
Place of birth for the foreign-born population - Lithuania (%)
Place of birth for the foreign-born population - North Macedonia (Macedonia) (%)
Place of birth for the foreign-born population - Moldova (%)
Place of birth for the foreign-born population - Poland (%)
Place of birth for the foreign-born population - Romania (%)
Place of birth for the foreign-born population - Russia (%)
Place of birth for the foreign-born population - Serbia (%)
Place of birth for the foreign-born population - Ukraine (%)
Place of birth for the foreign-born population - Other Eastern Europe (%)
Place of birth for the foreign-born population - China (%)
Place of birth for the foreign-born population - Hong Kong (%)
Place of birth for the foreign-born population - Taiwan (%)
Place of birth for the foreign-born population - Japan (%)
Place of birth for the foreign-born population - Korea (%)
Place of birth for the foreign-born population - Other Eastern Asia (%)
Place of birth for the foreign-born population - Afghanistan (%)
Place of birth for the foreign-born population - Bangladesh (%)
Place of birth for the foreign-born population - India (%)
Place of birth for the foreign-born population - Iran (%)
Place of birth for the foreign-born population - Kazakhstan (%)
Place of birth for the foreign-born population - Nepal (%)
Place of birth for the foreign-born population - Pakistan (%)
Place of birth for the foreign-born population - Sri Lanka (%)
Place of birth for the foreign-born population - Uzbekistan (%)
Place of birth for the foreign-born population - Other South Central Asia (%)
Place of birth for the foreign-born population - Burma (%)
Place of birth for the foreign-born population - Cambodia (%)
Place of birth for the foreign-born population - Indonesia (%)
Place of birth for the foreign-born population - Laos (%)
Place of birth for the foreign-born population - Malaysia (%)
Place of birth for the foreign-born population - Philippines (%)
Place of birth for the foreign-born population - Singapore (%)
Place of birth for the foreign-born population - Thailand (%)
Place of birth for the foreign-born population - Vietnam (%)
Place of birth for the foreign-born population - Other South Eastern Asia (%)
Place of birth for the foreign-born population - Armenia (%)
Place of birth for the foreign-born population - Iraq (%)
Place of birth for the foreign-born population - Israel (%)
Place of birth for the foreign-born population - Jordan (%)
Place of birth for the foreign-born population - Kuwait (%)
Place of birth for the foreign-born population - Lebanon (%)
Place of birth for the foreign-born population - Saudi Arabia (%)
Place of birth for the foreign-born population - Syria (%)
Place of birth for the foreign-born population - Turkey (%)
Place of birth for the foreign-born population - Yemen (%)
Place of birth for the foreign-born population - Other Western Asia (%)
Place of birth for the foreign-born population - Eritrea (%)
Place of birth for the foreign-born population - Ethiopia (%)
Place of birth for the foreign-born population - Kenya (%)
Place of birth for the foreign-born population - Somalia (%)
Place of birth for the foreign-born population - Uganda (%)
Place of birth for the foreign-born population - Zimbabwe (%)
Place of birth for the foreign-born population - Other Eastern Africa (%)
Place of birth for the foreign-born population - Cameroon (%)
Place of birth for the foreign-born population - Congo (%)
Place of birth for the foreign-born population - Democratic Republic of Congo (Zaire) (%)
Place of birth for the foreign-born population - Other Middle Africa (%)
Place of birth for the foreign-born population - Egypt (%)
Place of birth for the foreign-born population - Morocco (%)
Place of birth for the foreign-born population - Sudan (%)
Place of birth for the foreign-born population - Other Northern Africa (%)
Place of birth for the foreign-born population - South Africa (%)
Place of birth for the foreign-born population - Other Southern Africa (%)
Place of birth for the foreign-born population - Cabo Verde (%)
Place of birth for the foreign-born population - Ghana (%)
Place of birth for the foreign-born population - Liberia (%)
Place of birth for the foreign-born population - Nigeria (%)
Place of birth for the foreign-born population - Senegal (%)
Place of birth for the foreign-born population - Sierra Leone (%)
Place of birth for the foreign-born population - Other Western Africa (%)
Place of birth for the foreign-born population - Australia (%)
Place of birth for the foreign-born population - New Zealand (%)
Place of birth for the foreign-born population - Fiji (%)
Place of birth for the foreign-born population - Micronesia (%)
Place of birth for the foreign-born population - Bahamas (%)
Place of birth for the foreign-born population - Barbados (%)
Place of birth for the foreign-born population - Cuba (%)
Place of birth for the foreign-born population - Dominica (%)
Place of birth for the foreign-born population - Dominican Republic (%)
Place of birth for the foreign-born population - Grenada (%)
Place of birth for the foreign-born population - Haiti (%)
Place of birth for the foreign-born population - Jamaica (%)
Place of birth for the foreign-born population - St. Vincent and the Grenadines (%)
Place of birth for the foreign-born population - Trinidad and Tobago (%)
Place of birth for the foreign-born population - West Indies (%)
Place of birth for the foreign-born population - Other Caribbean (%)
Place of birth for the foreign-born population - Belize (%)
Place of birth for the foreign-born population - Costa Rica (%)
Place of birth for the foreign-born population - El Salvador (%)
Place of birth for the foreign-born population - Guatemala (%)
Place of birth for the foreign-born population - Honduras (%)
Place of birth for the foreign-born population - Mexico (%)
Place of birth for the foreign-born population - Nicaragua (%)
Place of birth for the foreign-born population - Panama (%)
Place of birth for the foreign-born population - Other Central America (%)
Place of birth for the foreign-born population - Argentina (%)
Place of birth for the foreign-born population - Bolivia (%)
Place of birth for the foreign-born population - Brazil (%)
Place of birth for the foreign-born population - Chile (%)
Place of birth for the foreign-born population - Colombia (%)
Place of birth for the foreign-born population - Ecuador (%)
Place of birth for the foreign-born population - Guyana (%)
Place of birth for the foreign-born population - Peru (%)
Place of birth for the foreign-born population - Uruguay (%)
Place of birth for the foreign-born population - Venezuela (%)
Place of birth for the foreign-born population - Other South America (%)
Place of birth for the foreign-born population - Canada (%)
Place of birth for the foreign-born population - Other Northern America (%)
Place of birth for the foreign-born population - Other (%)
Latest news about races in Sandy, UT collected exclusively by city-data.com from local newspapers, TV, and radio stations
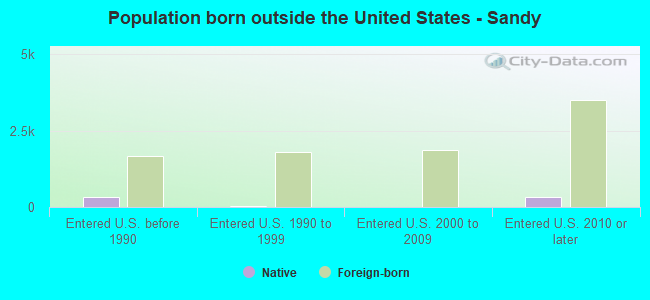
According to 2022 data, the most numerous races in Sandy, UT are White alone (71,713 residents), Hispanic (11,112 residents), and Two or more races (5,002 residents). 86.3% of Sandy residents speak English at home. 11.1% of Sandy, UT residents are foreign-born (4.4% born in Latin America, 3.6% born in Asia, 1.8% born in Europe), which is 28.0% greater than the foreign-born rate of 8.0% across the entire state of Utah.
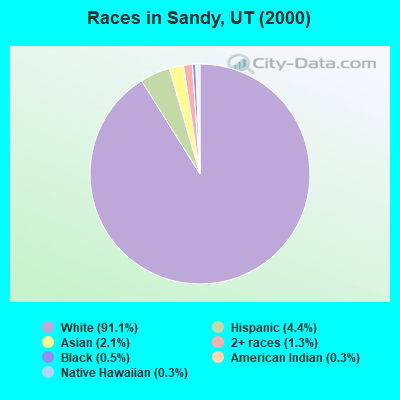
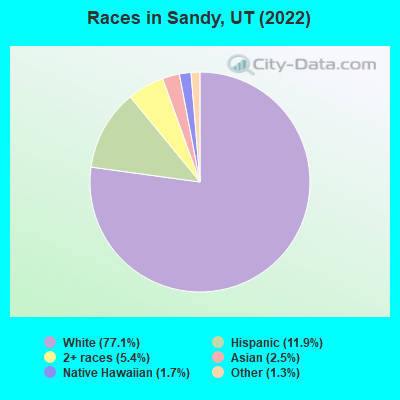
Race distribution in Sandy
2000 2022
80,523 91.1% White alone 3,875 4.4% Hispanic 1,894 2.1% Asian alone 1,126 1.3% Two or more races 404 0.5% Black alone 260 0.3% Native Hawaiian and Other 269 0.3% American Indian alone 67 0.08% Other race alone
71,713 77.1% White alone 11,112 11.9% Hispanic 5,002 5.4% Two or more races 2,313 2.5% Asian alone 1,555 1.7% Native Hawaiian and Other 1,236 1.3% Other race alone 93 0.10% Black alone 5 0.01% American Indian alone
2000 2022
1,904,265 85.3% White alone 201,559 9.0% Hispanic 36,483 1.6% Asian alone 31,308 1.4% Two or more races 26,663 1.2% American Indian alone 14,806 0.7% Native Hawaiian and Other 16,137 0.7% Black alone 1,948 0.09% Other race alone
2,557,466 75.6% White alone 512,086 15.1% Hispanic 119,308 3.5% Two or more races 82,388 2.4% Asian alone 36,978 1.1% Native Hawaiian and Other 34,873 1.0% Black alone 22,803 0.7% American Indian alone 14,898 0.4% Other race alone
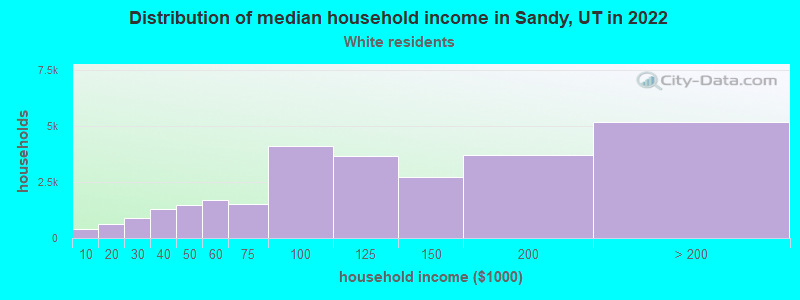
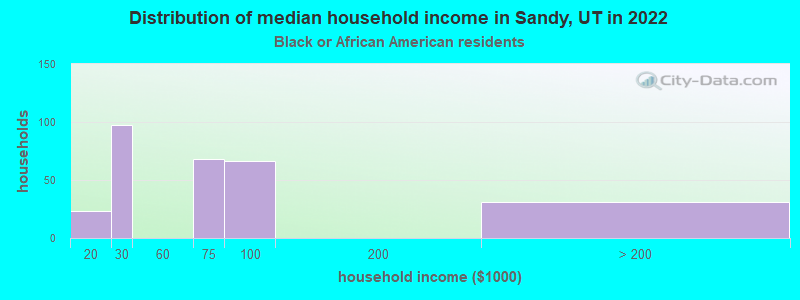
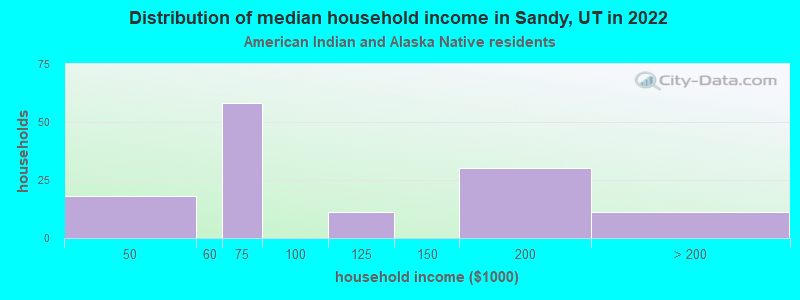
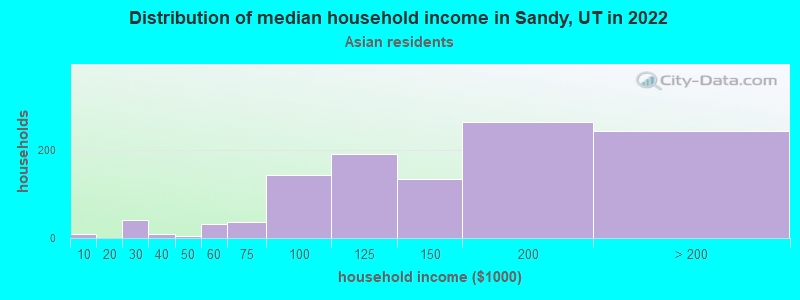
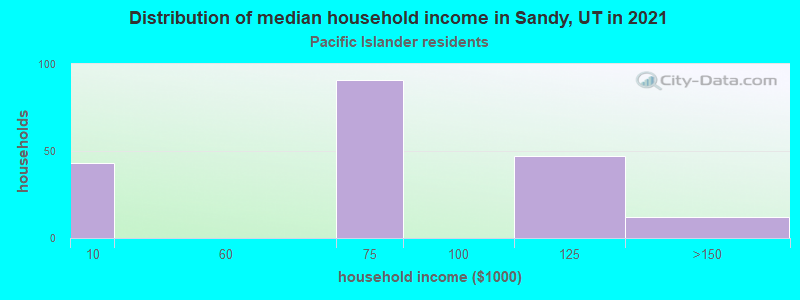
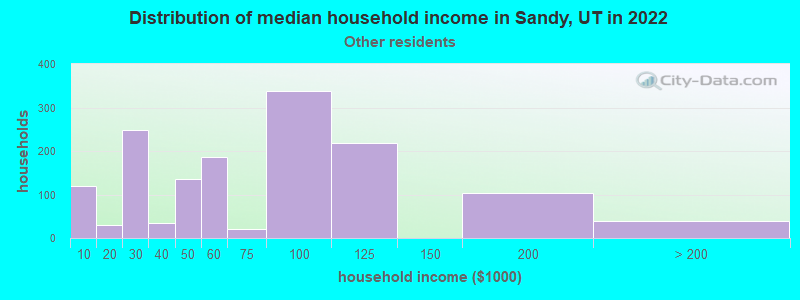
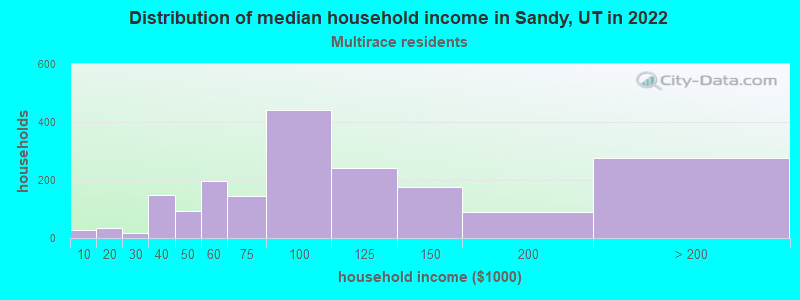
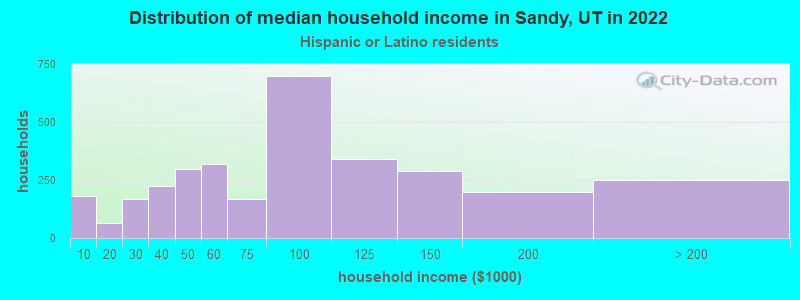
Income and house value in Sandy Median household income in 2022 $111,584 White non-Hispanic householders$118,779 Asian householders$45,946 Some other race householders$63,604 Two or more races householders$62,518 Hispanic or Latino race householdersMedian 2022 house value $628,851 White Non-Hispanic householders$497,160 Black or African American householders$581,892 American Indian or Alaska Native householders $638,039 Asian householders$512,473 Native Hawaiian and other Pacific Islander householders$494,097 Some other race householders$535,612 Two or more races householders$525,064 Hispanic or Latino householders
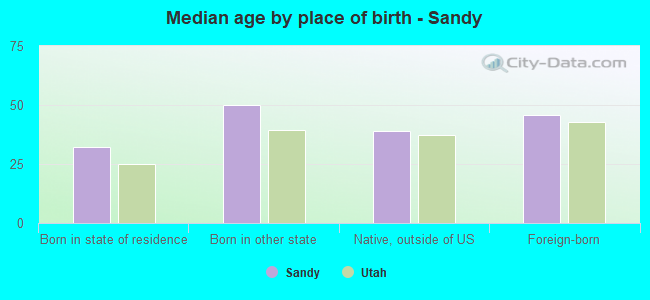
Median age by race in Sandy
42.5 Median age for White residents41.8 43.8 23.6 Median age for Black or African American residents19.8 35.6 -666,666,666.0 Median age for American Indian / Alaska Native residents-666,666,666.0 -666,666,666.0 40.2 Median age for Asian residents48.3 39.5 32.3 Median age for Native Hawaiian / Pacific Islander residents36.4 28.1 33.2 Median age for Other race residents29.5 33.8 20.6 Median age for Two or more races residents18.9 20.6 43.7 Median age for White alone residents42.5 45.5 24.0 Median age for Hispanic or Latino residents18.5 28.3
Owner/renter occupied households by race in Sandy
House owners and renters - White residents 21,084 77.3% Owner occupied6,174 22.7% Renter occupiedHouse owners and renters - Black or African American residents 150 54.7% Owner occupied124 45.3% Renter occupiedHouse owners and renters - American Indian / Alaska Native residents 43 29.8% Owner occupied100 70.2% Renter occupiedHouse owners and renters - Asian residents 731 74.4% Owner occupied251 25.6% Renter occupiedHouse owners and renters - Native Hawaiian / Pacific Islander residents 136 71.4% Owner occupied54 28.6% Renter occupiedHouse owners and renters - Other race residents 907 56.5% Owner occupied699 43.5% Renter occupiedHouse owners and renters - Two or more races residents 1,545 55.0% Owner occupied1,265 45.0% Renter occupiedHouse owners and renters - White alone residents 20,768 78.1% Owner occupied5,826 21.9% Renter occupiedHouse owners and renters - Hispanic or Latino residents 1,862 61.4% Owner occupied1,171 38.6% Renter occupied
Language usage in Sandy
English speakers - Total 86.3% of residents of Sandy speak English at home.
7.5% of residents speak Spanish at home 3,673 56.2% Speak English very well2,860 43.8% Speak English less than very well6.2% of residents speak other language at home 3,830 71.2% Speak English very well1,547 28.8% Speak English less than very well
English speakers - Born in the United States 95.6% of residents of Sandy speak English at home.
2.9% of residents speak Spanish at home 808 100.0% Speak English very well1.5% of residents speak other language at home 260 64.4% Speak English very well144 35.6% Speak English less than very well
All residents speak only English at home
English speakers - Foreign-born 28.7% of residents of Sandy speak English at home.
30.8% of residents speak Spanish at home 631 23.2% Speak English very well2,093 76.8% Speak English less than very well40.5% of residents speak other language at home 2,255 62.9% Speak English very well1,328 37.1% Speak English less than very well
White (Caucasian) - Speak only English Native:
95.1% (64,066)Foreign-born:
45.7% (1,620)
White (Caucasian) - Speak another language Native:
4.9% (3,314)Foreign-born:
54.3% (1,921)
Black or African American - Speak only English Native:
66.9% (388)Foreign-born:
90.1% (119)
Black or African American - Speak another language Native:
34.5% (200)Foreign-born:
28.7% (38)
American Indian / Alaska Native - Speak another language Native:
14.1% (68)Foreign-born:
94.0% (136)
Asian - Speak only English Native:
12.9% (69)Foreign-born:
17.2% (296)
Asian - Speak another language Native:
87.1% (467)Foreign-born:
82.8% (1,429)
Native Hawaiian / Pacific Islander - Speak only English Native:
61.0% (407)Foreign-born:
2.8% (6)
Native Hawaiian / Pacific Islander - Speak another language Native:
38.0% (254)Foreign-born:
100.0% (212)
Other race - Speak only English Native:
46.8% (802)Foreign-born:
6.9% (170)
Other race - Speak another language Native:
48.8% (837)Foreign-born:
92.3% (2,282)
Two or more races - Speak only English Native:
90.8% (4,952)Foreign-born:
13.0% (184)
Two or more races - Speak another language Native:
9.0% (488)Foreign-born:
83.8% (1,189)
White alone - Speak only English Native:
96.2% (62,806)Foreign-born:
47.1% (1,620)
White alone - Speak another language Native:
3.8% (2,450)Foreign-born:
52.9% (1,823)
Hispanic or Latino - Speak only English Native:
71.8% (4,433)Foreign-born:
15.8% (515)
Hispanic or Latino - Speak another language Native:
28.2% (1,741)Foreign-born:
84.2% (2,754)
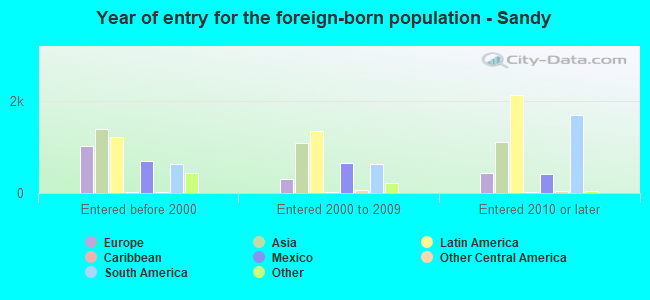
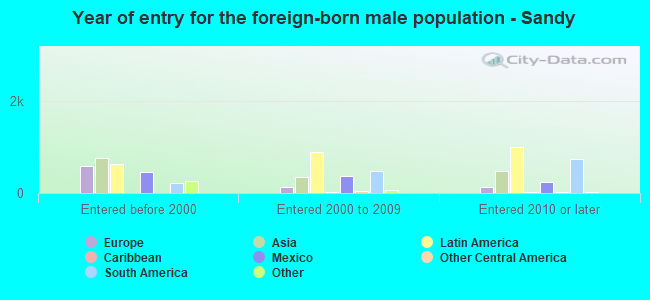
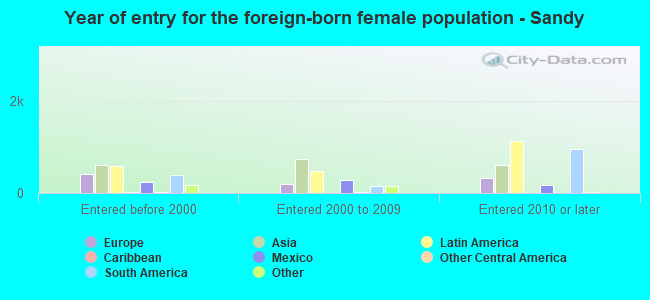
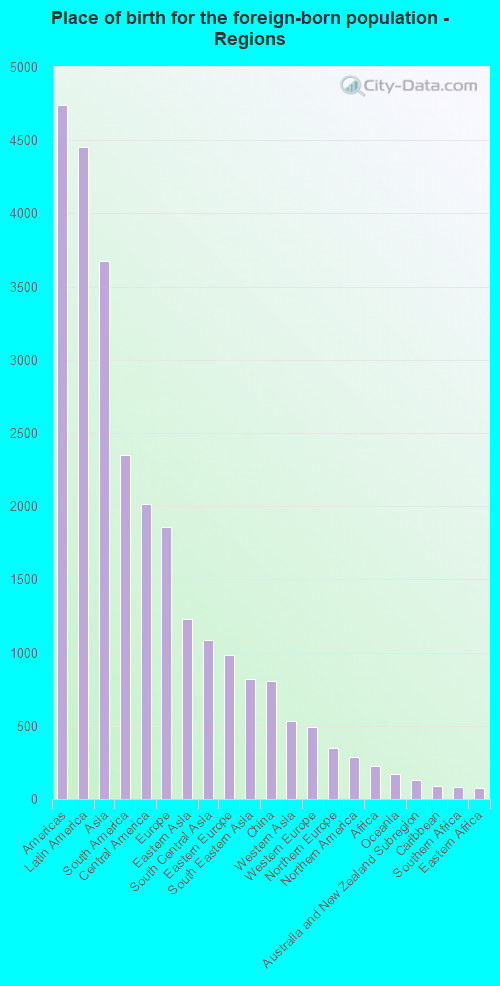
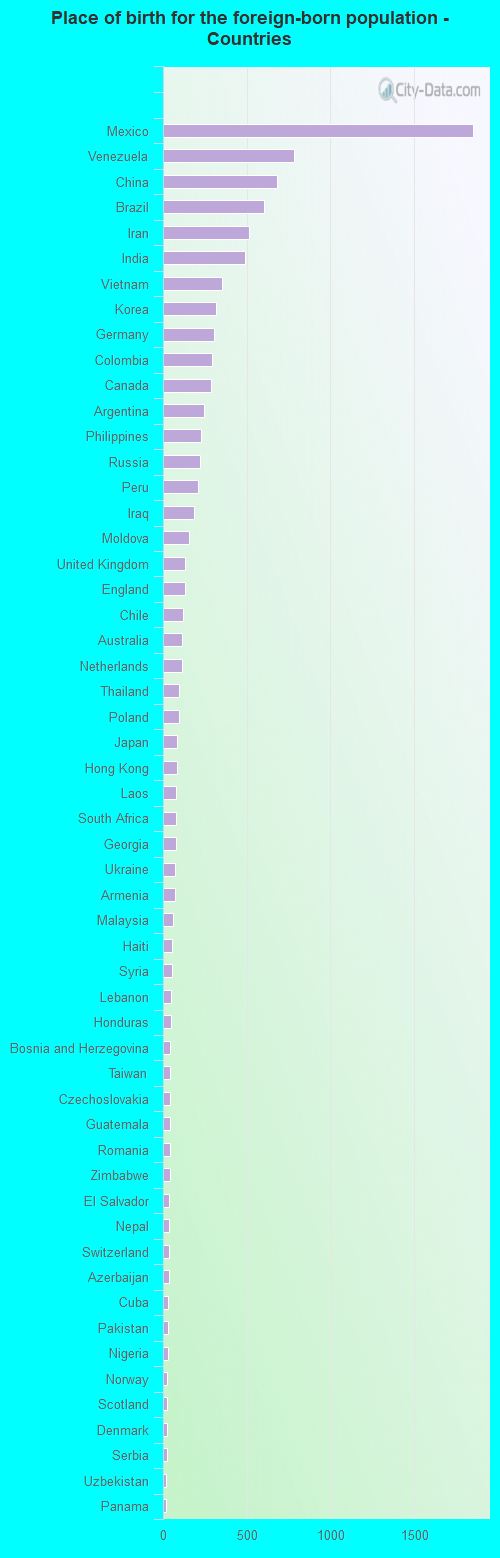
Foreign-born residents in Sandy 10,675 residents are foreign born (4.4% Latin America , 3.6% Asia , 1.8% Europe ).
Marital status for residents in Sandy Marital status - White (Caucasian) population 15 years and over
Males 27.9% Never married62.4% Now married0.7% Separated0.8% Widowed8.2% DivorcedFemales 27.4% Never married54.2% Now married1.1% Separated6.5% Widowed10.7% DivorcedWomen who gave birth in the past 12 months Now married:
83.1% (559)Unmarried:
16.9% (114)
Women who did not give birth in the past 12 months Now married:
43.9% (7,342)Unmarried:
56.1% (9,364)
Marital status - Black or African American population 15 years and over
Males 41.5% Never married51.7% Now married6.7% Separated0.0% Widowed0.0% DivorcedFemales 21.5% Never married45.9% Now married0.0% Separated0.0% Widowed32.5% DivorcedWomen who gave birth in the past 12 months Now married:
100.0% (9)Unmarried:
0.0% (0)
Women who did not give birth in the past 12 months Now married:
27.3% (36)Unmarried:
72.7% (96)
Marital status - American Indian / Alaska Native population 15 years and over
Males 86.4% Never married13.6% Now married0.0% Separated0.0% Widowed0.0% DivorcedFemales 39.8% Never married44.8% Now married0.0% Separated1.0% Widowed14.4% DivorcedWomen who did not give birth in the past 12 months Now married:
44.6% (110)Unmarried:
55.4% (137)
Marital status - Asian population 15 years and over
Males 24.9% Never married70.9% Now married0.0% Separated1.8% Widowed2.4% DivorcedFemales 18.5% Never married65.5% Now married0.2% Separated4.1% Widowed11.8% DivorcedWomen who gave birth in the past 12 months Now married:
100.0% (35)Unmarried:
0.0% (0)
Women who did not give birth in the past 12 months Now married:
62.3% (617)Unmarried:
37.7% (373)
Marital status - Native Hawaiian / Pacific Islander population 15 years and over
Males 50.0% Never married41.6% Now married0.0% Separated0.0% Widowed8.4% DivorcedFemales 21.9% Never married47.7% Now married11.1% Separated7.9% Widowed11.5% DivorcedWomen who gave birth in the past 12 months Now married:
0.0% (0)Unmarried:
100.0% (14)
Women who did not give birth in the past 12 months Now married:
71.0% (189)Unmarried:
29.0% (77)
Marital status - Other race population 15 years and over
Males 33.3% Never married54.7% Now married4.2% Separated1.6% Widowed6.1% DivorcedFemales 16.7% Never married58.4% Now married4.0% Separated8.1% Widowed12.7% DivorcedWomen who gave birth in the past 12 months Now married:
100.0% (9)Unmarried:
0.0% (0)
Women who did not give birth in the past 12 months Now married:
64.6% (779)Unmarried:
35.4% (427)
Marital status - Two or more races population 15 years and over
Males 46.5% Never married46.6% Now married2.9% Separated0.4% Widowed3.7% DivorcedFemales 50.5% Never married39.2% Now married2.7% Separated4.1% Widowed3.5% DivorcedWomen who gave birth in the past 12 months Now married:
100.0% (89)Unmarried:
0.0% (0)
Women who did not give birth in the past 12 months Now married:
41.7% (676)Unmarried:
58.3% (947)
Marital status - White alone, not Hispanic / Latino population 15 years and over
Males 26.7% Never married63.3% Now married0.7% Separated0.8% Widowed8.4% DivorcedFemales 26.4% Never married54.9% Now married1.2% Separated6.7% Widowed10.8% DivorcedWomen who gave birth in the past 12 months Now married:
83.1% (559)Unmarried:
16.9% (114)
Women who did not give birth in the past 12 months Now married:
44.8% (7,150)Unmarried:
55.2% (8,794)
Marital status - Hispanic or Latino population 15 years and over
Males 42.3% Never married48.7% Now married3.3% Separated2.0% Widowed3.8% DivorcedFemales 31.3% Never married48.9% Now married3.0% Separated8.0% Widowed8.8% DivorcedWomen who gave birth in the past 12 months Now married:
100.0% (35)Unmarried:
0.0% (0)
Women who did not give birth in the past 12 months Now married:
55.7% (1,165)Unmarried:
44.3% (927)
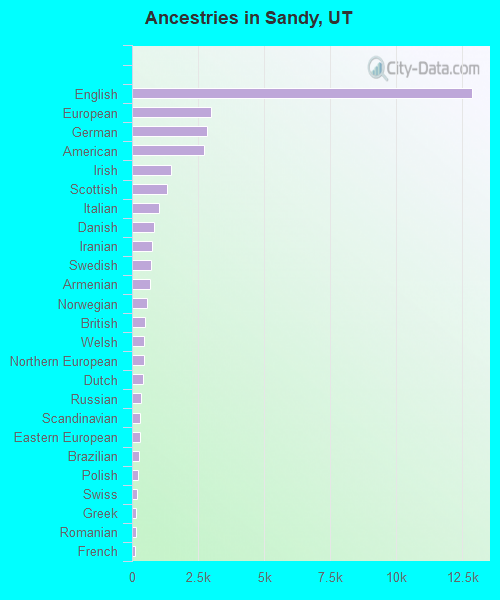
Ancestries in Sandy
12,873 27.5% English3,002 6.4% European2,837 6.1% German2,720 5.8% American1,471 3.1% Irish1,326 2.8% Scottish1,009 2.2% Italian830 1.8% Danish771 1.6% Iranian706 1.5% Swedish689 1.5% Armenian550 1.2% Norwegian495 1.1% British460 1.0% Welsh451 1.0% Northern European421 0.9% Dutch328 0.7% Russian298 0.6% Scandinavian285 0.6% Eastern European266 0.6% Brazilian242 0.5% Polish187 0.4% Swiss167 0.4% Greek162 0.3% Romanian129 0.3% French119 0.3% Scotch-Irish116 0.2% Ukrainian113 0.2% Canadian105 0.2% Nigerian104 0.2% Yugoslavian91 0.2% Portuguese82 0.2% Austrian80 0.2% French Canadian66 0.1% South African61 0.1% Lebanese60 0.1% Iraqi48 0.1% Serbian48 0.1% Basque44 0.09% Zimbabwean40 0.09% Czech36 0.08% Australian29 0.06% Belgian26 0.06% Lithuanian25 0.05% Egyptian23 0.05% Hungarian21 0.04% Arab18 0.04% Slovak18 0.04% Palestinian16 0.03% Syrian16 0.03% Cypriot15 0.03% Finnish14 0.03% Slovene10 0.02% Croatian8 0.02% African8 0.02% Pennsylvania German7 0.01% Czechoslovakian7 0.01% Icelander4 0.01% Bulgarian
Geographical mobility in Sandy Same house 1 year ago 66,399 90.1% White (Caucasian)831 100.0% Black or African American463 85.8% American Indian / Alaska Native2,950 82.2% Asian556 63.2% Native Hawaiian / Pacific Islander3,558 81.5% Other race6,030 78.2% Two or more races64,996 91.2% White alone, not Hispanic / Latino7,715 74.8% Hispanic or LatinoMoved within same county 5,702 7.7% White / Caucasian25 4.7% American Indian / Alaska Native115 3.2% Asian429 48.8% Native Hawaiian / Pacific Islander367 8.4% Other race1,450 18.8% Two or more races4,641 6.5% White alone, not Hispanic / Latino1,861 18.0% Hispanic or LatinoMoved within same state 635 0.9% White / Caucasian54 10.0% American Indian / Alaska Native426 11.9% Asian35 0.8% Other race75 1.0% Two or more races635 0.9% White alone, not Hispanic / Latino262 2.5% Hispanic or LatinoMoved from different state 867 1.2% White / Caucasian21 2.7% Black or African American3 0.5% American Indian / Alaska Native100 2.8% Asian210 4.8% Other race70 0.9% Two or more races867 1.2% White alone, not Hispanic / Latino276 2.7% Hispanic or LatinoMoved from abroad 122 0.2% White82 2.3% Asian216 4.9% Other race60 0.8% Two or more races122 0.2% White alone, not Hispanic / Latino208 2.0% Hispanic or Latino
Children Nativity (place of birth) in Sandy
Children under 6 years - Living with two parents Both parents native 4,487 100.0% NativeBoth parents foreign-born 389 86.7% Native60 13.3% Foreign-bornOne native, one foreign-born parent 425 100.0% NativeChildren under 6 years - Living with one parent Native parent 1,011 100.0% NativeForeign-born parent 62 100.0% NativeChildren 6 to 17 years - Living with two parents Both parents native 9,863 99.7% Native30 0.3% Foreign-bornBoth parents foreign-born 1,320 77.1% Native393 22.9% Foreign-bornOne native, one foreign-born parent 731 100.0% NativeChildren 6 to 17 years - Living with one parent Native parent 3,479 99.8% Native8 0.2% Foreign-bornForeign-born parent 379 64.1% Native212 35.9% Foreign-born
Place of birth for residents in Sandy
Grandparents responsible for own grandchildren in Sandy
Grandparents (30 to 59 years) White / Caucasian 104 31.0% Responsible for grandchildren231 69.0% Not responsible for grandchildrenBlack or African American 13 100.0% Not responsible for grandchildrenAmerican Indian / Alaska Native 15 100.0% Not responsible for grandchildrenAsian 7 100.0% Responsible for grandchildrenNative Hawaiian / Pacific Islander 25 100.0% Not responsible for grandchildrenOther race 23 76.3% Responsible for grandchildren7 23.7% Not responsible for grandchildrenTwo or more races 40 56.4% Responsible for grandchildren31 43.6% Not responsible for grandchildrenWhite alone, not Hispanic / Latino 126 33.4% Responsible for grandchildren252 66.6% Not responsible for grandchildrenHispanic or Latino 25 48.1% Responsible for grandchildren27 51.9% Not responsible for grandchildrenGrandparents (60 years and over) White / Caucasian 105 12.1% Responsible for grandchildren765 87.9% Not responsible for grandchildrenBlack or African American 9 100.0% Not responsible for grandchildrenAsian 11 5.7% Responsible for grandchildren179 94.3% Not responsible for grandchildrenNative Hawaiian / Pacific Islander 21 100.0% Not responsible for grandchildrenOther race 84 100.0% Not responsible for grandchildrenTwo or more races 31 100.0% Not responsible for grandchildrenWhite alone, not Hispanic / Latino 106 11.7% Responsible for grandchildren802 88.3% Not responsible for grandchildrenHispanic or Latino 93 100.0% Not responsible for grandchildren