Races in Sand Springs, Oklahoma (OK) Detailed Stats
Data:
Races - White alone (%)
Races - White alone (% change since 2000)
Races - Black alone (%)
Races - Black alone (% change since 2000)
Races - American Indian alone (%)
Races - American Indian alone (% change since 2000)
Races - Asian alone (%)
Races - Asian alone (% change since 2000)
Races - Hispanic (%)
Races - Hispanic (% change since 2000)
Races - Native Hawaiian and Other Pacific Islander alone (%)
Races - Native Hawaiian and Other Pacific Islander alone (% change since 2000)
Races - Two or more races(%)
Races - Two or more races(% change since 2000)
Races - Other race alone (%)
Races - Other race alone (% change since 2000)
Racial diversity
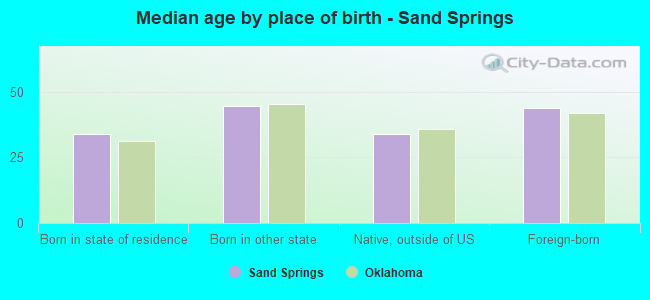
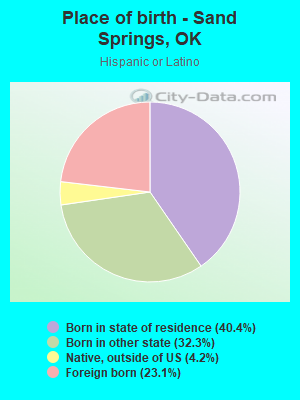
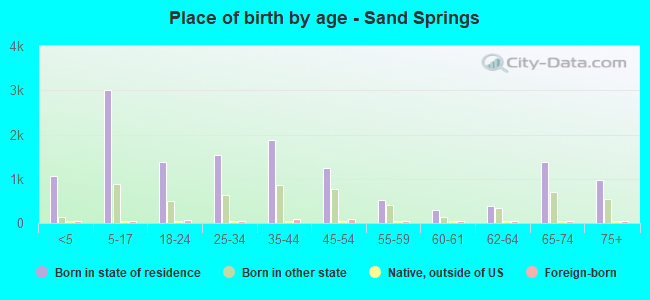
Place of birth - Born in state of residence (%)
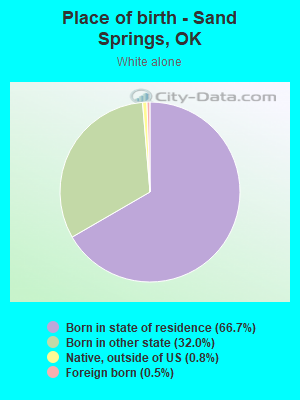
Place of birth - Born in state of residence (%) - White
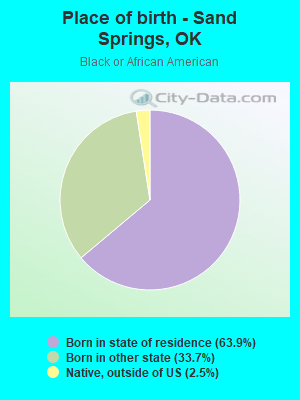
Place of birth - Born in state of residence (%) - Black or African American
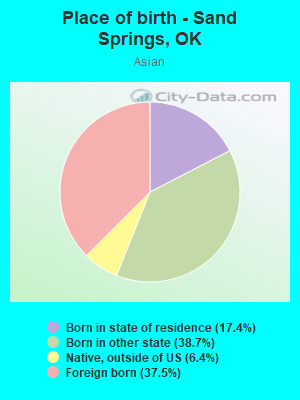
Place of birth - Born in state of residence (%) - Asian
Place of birth - Born in state of residence (%) - Hispanic or Latino
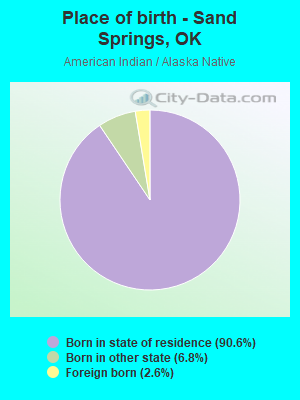
Place of birth - Born in state of residence (%) - American Indian and Alaska Native
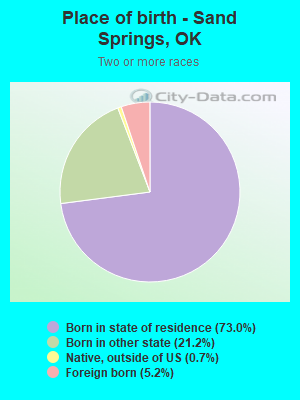
Place of birth - Born in state of residence (%) - Multirace
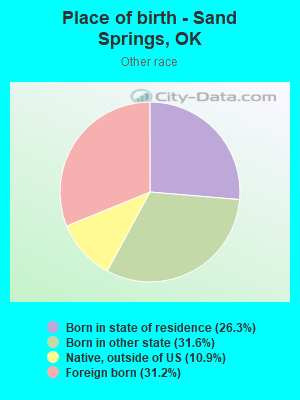
Place of birth - Born in state of residence (%) - Other Race
Place of birth - Born in other state (%)
Place of birth - Born in other state (%) - White
Place of birth - Born in other state (%) - Black or African American
Place of birth - Born in other state (%) - Asian
Place of birth - Born in other state (%) - Hispanic or Latino
Place of birth - Born in other state (%) - American Indian and Alaska Native
Place of birth - Born in other state (%) - Multirace
Place of birth - Born in other state (%) - Other Race
Place of birth - Native, outside of US (%)
Place of birth - Native, outside of US (%) - White
Place of birth - Native, outside of US (%) - Black or African American
Place of birth - Native, outside of US (%) - Asian
Place of birth - Native, outside of US (%) - Hispanic or Latino
Place of birth - Native, outside of US (%) - American Indian and Alaska Native
Place of birth - Native, outside of US (%) - Multirace
Place of birth - Native, outside of US (%) - Other Race
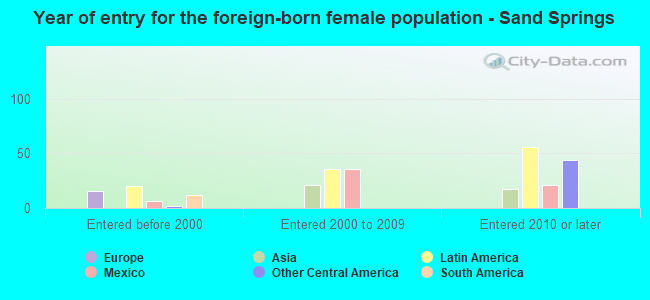
Place of birth - Foreign born (%)
Place of birth - Foreign born (%) - White
Place of birth - Foreign born (%) - Black or African American
Place of birth - Foreign born (%) - Asian
Place of birth - Foreign born (%) - Hispanic or Latino
Place of birth - Foreign born (%) - American Indian and Alaska Native
Place of birth - Foreign born (%) - Multirace
Place of birth - Foreign born (%) - Other Race
Residents speaking English at home (%)
Residents speaking English at home - Born in the United States (%)
Residents speaking English at home - Native, born elsewhere (%)
Residents speaking English at home - Foreign born (%)
Residents speaking Spanish at home (%)
Residents speaking Spanish at home - Born in the United States (%)
Residents speaking Spanish at home - Native, born elsewhere (%)
Residents speaking Spanish at home - Foreign born (%)
Residents speaking other language at home (%)
Residents speaking other language at home - Born in the United States (%)
Residents speaking other language at home - Native, born elsewhere (%)
Residents speaking other language at home - Foreign born (%)
Marital status - Never married (%)
Marital status - Now married (%)
Marital status - Separated (%)
Marital status - Widowed (%)
Marital status - Divorced (%)
Ancestries Reported - Arab (%)
Ancestries Reported - Czech (%)
Ancestries Reported - Danish (%)
Ancestries Reported - Dutch (%)
Ancestries Reported - English (%)
Ancestries Reported - French (%)
Ancestries Reported - French Canadian (%)
Ancestries Reported - German (%)
Ancestries Reported - Greek (%)
Ancestries Reported - Hungarian (%)
Ancestries Reported - Irish (%)
Ancestries Reported - Italian (%)
Ancestries Reported - Lithuanian (%)
Ancestries Reported - Norwegian (%)
Ancestries Reported - Polish (%)
Ancestries Reported - Portuguese (%)
Ancestries Reported - Russian (%)
Ancestries Reported - Scotch-Irish (%)
Ancestries Reported - Scottish (%)
Ancestries Reported - Slovak (%)
Ancestries Reported - Subsaharan African (%)
Ancestries Reported - Swedish (%)
Ancestries Reported - Swiss (%)
Ancestries Reported - Ukrainian (%)
Ancestries Reported - United States (%)
Ancestries Reported - Welsh (%)
Ancestries Reported - West Indian (%)
Ancestries Reported - Other (%)
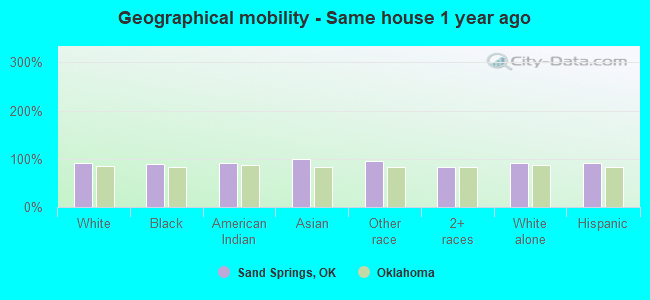
Geographical mobility - Same house 1 year ago (%)
Geographical mobility - Same house 1 year ago (%) - White
Geographical mobility - Same house 1 year ago (%) - Black or African American
Geographical mobility - Same house 1 year ago (%) - Asian
Geographical mobility - Same house 1 year ago (%) - Hispanic or Latino
Geographical mobility - Same house 1 year ago (%) - American Indian and Alaska Native
Geographical mobility - Same house 1 year ago (%) - Multirace
Geographical mobility - Same house 1 year ago (%) - Other Race
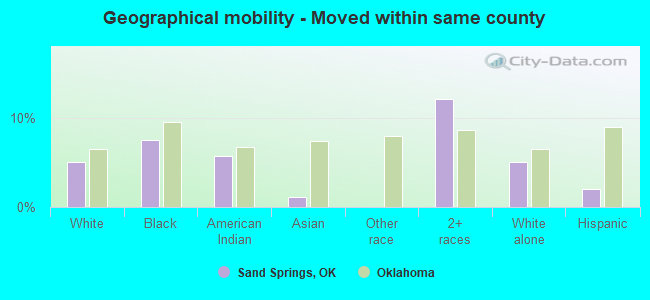
Geographical mobility - Moved within same county (%)
Geographical mobility - Moved within same county (%) - White
Geographical mobility - Moved within same county (%) - Black or African American
Geographical mobility - Moved within same county (%) - Asian
Geographical mobility - Moved within same county (%) - Hispanic or Latino
Geographical mobility - Moved within same county (%) - American Indian and Alaska Native
Geographical mobility - Moved within same county (%) - Multirace
Geographical mobility - Moved within same county (%) - Other Race
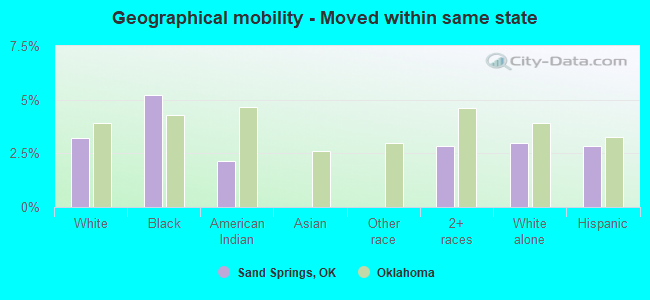
Geographical mobility - Moved from different county within same state (%)
Geographical mobility - Moved from different county within same state (%) - White
Geographical mobility - Moved from different county within same state (%) - Black or African American
Geographical mobility - Moved from different county within same state (%) - Asian
Geographical mobility - Moved from different county within same state (%) - Hispanic or Latino
Geographical mobility - Moved from different county within same state (%) - American Indian and Alaska Native
Geographical mobility - Moved from different county within same state (%) - Multirace
Geographical mobility - Moved from different county within same state (%) - Other Race
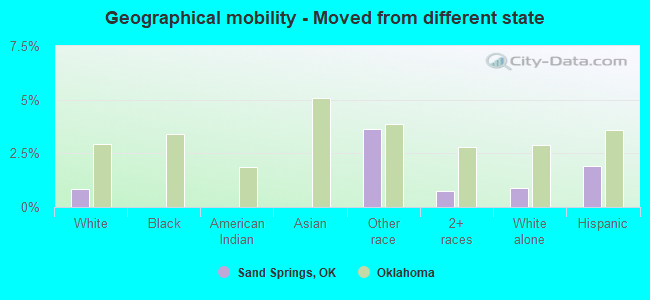
Geographical mobility - Moved from different state (%)
Geographical mobility - Moved from different state (%) - White
Geographical mobility - Moved from different state (%) - Black or African American
Geographical mobility - Moved from different state (%) - Asian
Geographical mobility - Moved from different state (%) - Hispanic or Latino
Geographical mobility - Moved from different state (%) - American Indian and Alaska Native
Geographical mobility - Moved from different state (%) - Multirace
Geographical mobility - Moved from different state (%) - Other Race
Geographical mobility - Moved from abroad (%)
Geographical mobility - Moved from abroad (%) - White
Geographical mobility - Moved from abroad (%) - Black or African American
Geographical mobility - Moved from abroad (%) - Asian
Geographical mobility - Moved from abroad (%) - Hispanic or Latino
Geographical mobility - Moved from abroad (%) - American Indian and Alaska Native
Geographical mobility - Moved from abroad (%) - Multirace
Geographical mobility - Moved from abroad (%) - Other Race
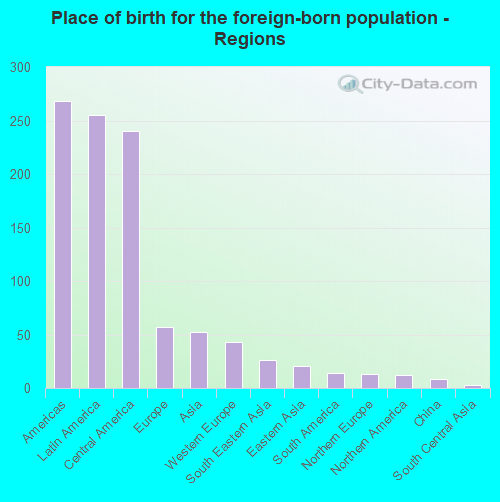
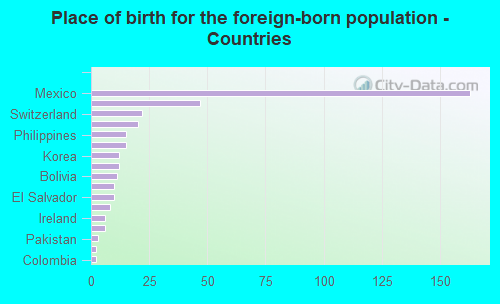
Place of birth for the foreign-born population - Ireland (%)
Place of birth for the foreign-born population - Denmark (%)
Place of birth for the foreign-born population - Norway (%)
Place of birth for the foreign-born population - Sweden (%)
Place of birth for the foreign-born population - United Kingdom (%)
Place of birth for the foreign-born population - England (%)
Place of birth for the foreign-born population - Scotland (%)
Place of birth for the foreign-born population - Other Northern Europe (%)
Place of birth for the foreign-born population - Austria (%)
Place of birth for the foreign-born population - Belgium (%)
Place of birth for the foreign-born population - France (%)
Place of birth for the foreign-born population - Germany (%)
Place of birth for the foreign-born population - Netherlands (%)
Place of birth for the foreign-born population - Switzerland (%)
Place of birth for the foreign-born population - Other Western Europe (%)
Place of birth for the foreign-born population - Greece (%)
Place of birth for the foreign-born population - Italy (%)
Place of birth for the foreign-born population - Portugal (%)
Place of birth for the foreign-born population - Spain (%)
Place of birth for the foreign-born population - Other Southern Europe (%)
Place of birth for the foreign-born population - Albania (%)
Place of birth for the foreign-born population - Belarus (%)
Place of birth for the foreign-born population - Bosnia and Herzegovina (%)
Place of birth for the foreign-born population - Bulgaria (%)
Place of birth for the foreign-born population - Croatia (%)
Place of birth for the foreign-born population - Czechoslovakia (%)
Place of birth for the foreign-born population - Hungary (%)
Place of birth for the foreign-born population - Latvia (%)
Place of birth for the foreign-born population - Lithuania (%)
Place of birth for the foreign-born population - North Macedonia (Macedonia) (%)
Place of birth for the foreign-born population - Moldova (%)
Place of birth for the foreign-born population - Poland (%)
Place of birth for the foreign-born population - Romania (%)
Place of birth for the foreign-born population - Russia (%)
Place of birth for the foreign-born population - Serbia (%)
Place of birth for the foreign-born population - Ukraine (%)
Place of birth for the foreign-born population - Other Eastern Europe (%)
Place of birth for the foreign-born population - China (%)
Place of birth for the foreign-born population - Hong Kong (%)
Place of birth for the foreign-born population - Taiwan (%)
Place of birth for the foreign-born population - Japan (%)
Place of birth for the foreign-born population - Korea (%)
Place of birth for the foreign-born population - Other Eastern Asia (%)
Place of birth for the foreign-born population - Afghanistan (%)
Place of birth for the foreign-born population - Bangladesh (%)
Place of birth for the foreign-born population - India (%)
Place of birth for the foreign-born population - Iran (%)
Place of birth for the foreign-born population - Kazakhstan (%)
Place of birth for the foreign-born population - Nepal (%)
Place of birth for the foreign-born population - Pakistan (%)
Place of birth for the foreign-born population - Sri Lanka (%)
Place of birth for the foreign-born population - Uzbekistan (%)
Place of birth for the foreign-born population - Other South Central Asia (%)
Place of birth for the foreign-born population - Burma (%)
Place of birth for the foreign-born population - Cambodia (%)
Place of birth for the foreign-born population - Indonesia (%)
Place of birth for the foreign-born population - Laos (%)
Place of birth for the foreign-born population - Malaysia (%)
Place of birth for the foreign-born population - Philippines (%)
Place of birth for the foreign-born population - Singapore (%)
Place of birth for the foreign-born population - Thailand (%)
Place of birth for the foreign-born population - Vietnam (%)
Place of birth for the foreign-born population - Other South Eastern Asia (%)
Place of birth for the foreign-born population - Armenia (%)
Place of birth for the foreign-born population - Iraq (%)
Place of birth for the foreign-born population - Israel (%)
Place of birth for the foreign-born population - Jordan (%)
Place of birth for the foreign-born population - Kuwait (%)
Place of birth for the foreign-born population - Lebanon (%)
Place of birth for the foreign-born population - Saudi Arabia (%)
Place of birth for the foreign-born population - Syria (%)
Place of birth for the foreign-born population - Turkey (%)
Place of birth for the foreign-born population - Yemen (%)
Place of birth for the foreign-born population - Other Western Asia (%)
Place of birth for the foreign-born population - Eritrea (%)
Place of birth for the foreign-born population - Ethiopia (%)
Place of birth for the foreign-born population - Kenya (%)
Place of birth for the foreign-born population - Somalia (%)
Place of birth for the foreign-born population - Uganda (%)
Place of birth for the foreign-born population - Zimbabwe (%)
Place of birth for the foreign-born population - Other Eastern Africa (%)
Place of birth for the foreign-born population - Cameroon (%)
Place of birth for the foreign-born population - Congo (%)
Place of birth for the foreign-born population - Democratic Republic of Congo (Zaire) (%)
Place of birth for the foreign-born population - Other Middle Africa (%)
Place of birth for the foreign-born population - Egypt (%)
Place of birth for the foreign-born population - Morocco (%)
Place of birth for the foreign-born population - Sudan (%)
Place of birth for the foreign-born population - Other Northern Africa (%)
Place of birth for the foreign-born population - South Africa (%)
Place of birth for the foreign-born population - Other Southern Africa (%)
Place of birth for the foreign-born population - Cabo Verde (%)
Place of birth for the foreign-born population - Ghana (%)
Place of birth for the foreign-born population - Liberia (%)
Place of birth for the foreign-born population - Nigeria (%)
Place of birth for the foreign-born population - Senegal (%)
Place of birth for the foreign-born population - Sierra Leone (%)
Place of birth for the foreign-born population - Other Western Africa (%)
Place of birth for the foreign-born population - Australia (%)
Place of birth for the foreign-born population - New Zealand (%)
Place of birth for the foreign-born population - Fiji (%)
Place of birth for the foreign-born population - Micronesia (%)
Place of birth for the foreign-born population - Bahamas (%)
Place of birth for the foreign-born population - Barbados (%)
Place of birth for the foreign-born population - Cuba (%)
Place of birth for the foreign-born population - Dominica (%)
Place of birth for the foreign-born population - Dominican Republic (%)
Place of birth for the foreign-born population - Grenada (%)
Place of birth for the foreign-born population - Haiti (%)
Place of birth for the foreign-born population - Jamaica (%)
Place of birth for the foreign-born population - St. Vincent and the Grenadines (%)
Place of birth for the foreign-born population - Trinidad and Tobago (%)
Place of birth for the foreign-born population - West Indies (%)
Place of birth for the foreign-born population - Other Caribbean (%)
Place of birth for the foreign-born population - Belize (%)
Place of birth for the foreign-born population - Costa Rica (%)
Place of birth for the foreign-born population - El Salvador (%)
Place of birth for the foreign-born population - Guatemala (%)
Place of birth for the foreign-born population - Honduras (%)
Place of birth for the foreign-born population - Mexico (%)
Place of birth for the foreign-born population - Nicaragua (%)
Place of birth for the foreign-born population - Panama (%)
Place of birth for the foreign-born population - Other Central America (%)
Place of birth for the foreign-born population - Argentina (%)
Place of birth for the foreign-born population - Bolivia (%)
Place of birth for the foreign-born population - Brazil (%)
Place of birth for the foreign-born population - Chile (%)
Place of birth for the foreign-born population - Colombia (%)
Place of birth for the foreign-born population - Ecuador (%)
Place of birth for the foreign-born population - Guyana (%)
Place of birth for the foreign-born population - Peru (%)
Place of birth for the foreign-born population - Uruguay (%)
Place of birth for the foreign-born population - Venezuela (%)
Place of birth for the foreign-born population - Other South America (%)
Place of birth for the foreign-born population - Canada (%)
Place of birth for the foreign-born population - Other Northern America (%)
Place of birth for the foreign-born population - Other (%)
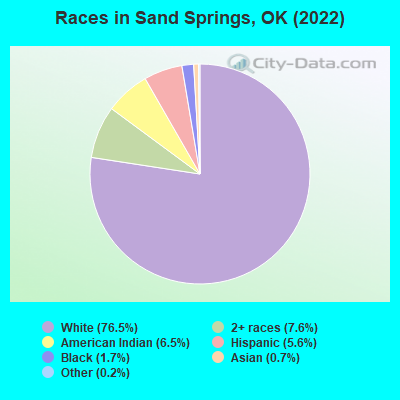
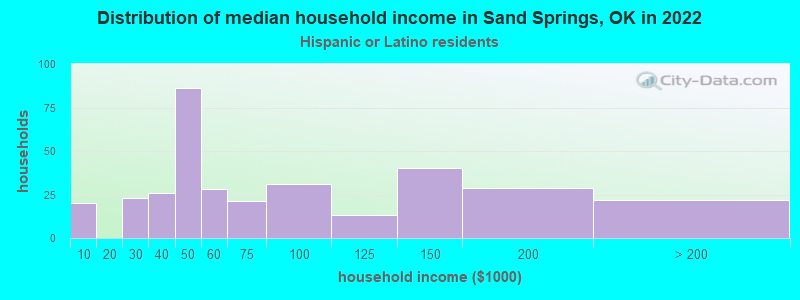
According to 2022 data, the most numerous races in Sand Springs, OK are White alone (15,441 residents), Hispanic (1,129 residents), and Two or more races (1,534 residents). 96.0% of Sand Springs residents speak English at home. 1.9% of Sand Springs, OK residents are foreign-born , which is 219.4% less than the foreign-born rate of 6.0% across the entire state of Oklahoma.
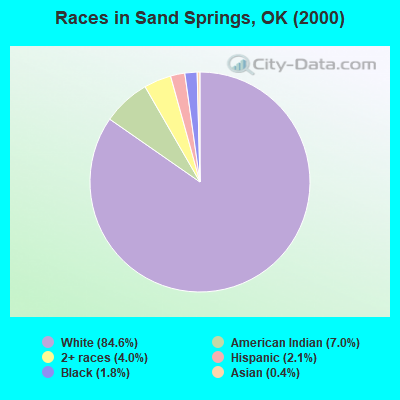
Race distribution in Sand Springs
2000 2022
2,556,368 74.1% White alone 266,158 7.7% American Indian alone 257,981 7.5% Black alone 179,304 5.2% Hispanic 140,249 4.1% Two or more races 46,172 1.3% Asian alone 2,322 0.07% Other race alone 2,100 0.06% Native Hawaiian and Other
2,517,403 62.6% White alone 486,692 12.1% Hispanic 364,453 9.1% Two or more races 273,650 6.8% American Indian alone 268,543 6.7% Black alone 92,672 2.3% Asian alone 10,786 0.3% Other race alone 5,601 0.1% Native Hawaiian and Other
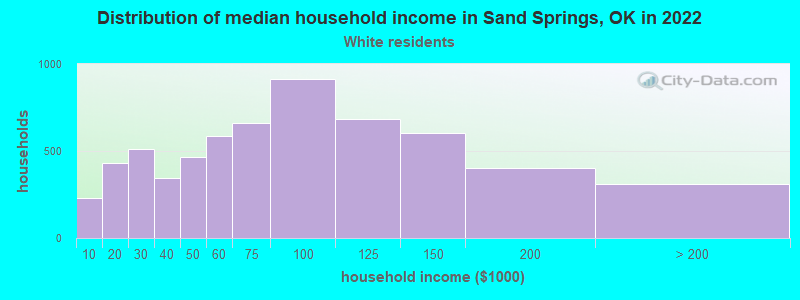
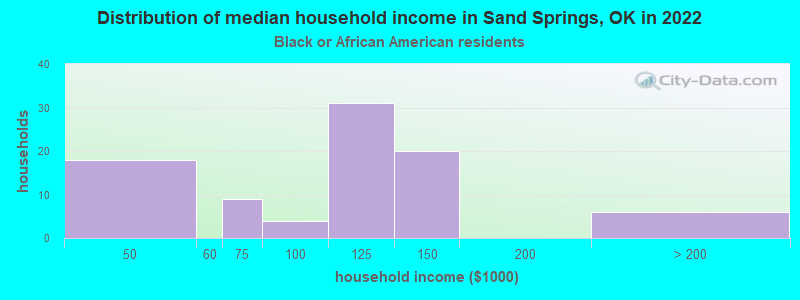
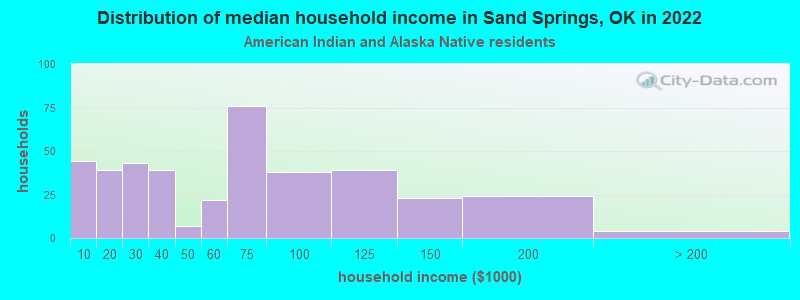
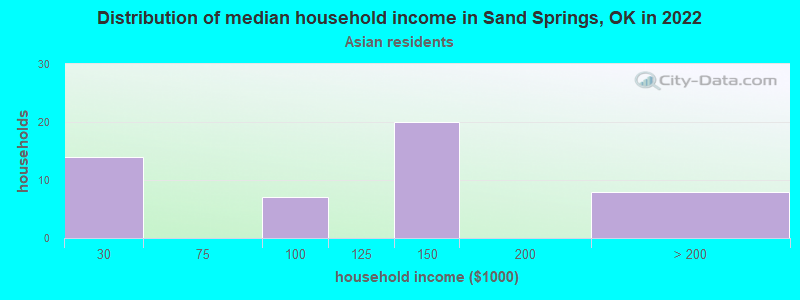
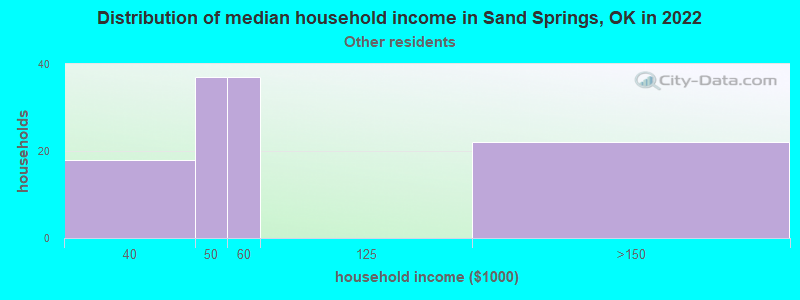
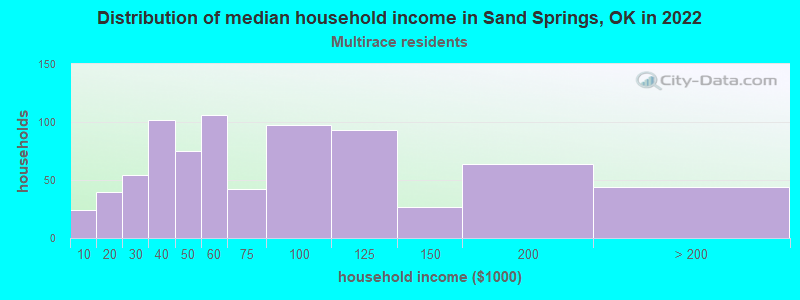
Income and house value in Sand Springs Median household income in 2022 $69,521 White non-Hispanic householders$105,936 Black householders$61,188 American Indian and Alaska Native householders$122,808 Asian householders$54,145 Some other race householders$60,018 Two or more races householders$53,337 Hispanic or Latino race householdersMedian 2022 house value $202,818 White Non-Hispanic householders$83,631 Black or African American householders$183,538 American Indian or Alaska Native householders$198,812 Two or more races householders$168,514 Hispanic or Latino householders
Median age by race in Sand Springs
41.0 Median age for White residents39.8 42.0 29.1 Median age for Black or African American residents29.4 29.0 25.5 Median age for American Indian / Alaska Native residents24.4 28.5 35.7 Median age for Asian residents13.0 36.8 -633,554,083.3 Median age for Native Hawaiian / Pacific Islander residents-662,177,328.2 -442,328,041.9 24.3 Median age for Other race residents23.4 35.6 26.3 Median age for Two or more races residents28.6 24.8 40.3 Median age for White alone residents39.5 41.5 22.9 Median age for Hispanic or Latino residents21.8 24.7
Owner/renter occupied households by race in Sand Springs
House owners and renters - White residents 4,467 72.6% Owner occupied1,685 27.4% Renter occupiedHouse owners and renters - Black or African American residents 55 62.1% Owner occupied34 37.9% Renter occupiedHouse owners and renters - American Indian / Alaska Native residents 303 74.6% Owner occupied103 25.4% Renter occupiedHouse owners and renters - Asian residents 32 69.1% Owner occupied14 30.9% Renter occupiedHouse owners and renters - Other race residents 46 45.7% Owner occupied55 54.3% Renter occupiedHouse owners and renters - Two or more races residents 432 55.7% Owner occupied343 44.3% Renter occupiedHouse owners and renters - White alone residents 4,456 72.1% Owner occupied1,721 27.9% Renter occupiedHouse owners and renters - Hispanic or Latino residents 212 64.7% Owner occupied115 35.3% Renter occupied
Language usage in Sand Springs
English speakers - Total 96.0% of residents of Sand Springs speak English at home.
2.9% of residents speak Spanish at home 335 61.0% Speak English very well214 39.0% Speak English less than very well0.9% of residents speak other language at home 165 93.8% Speak English very well11 6.2% Speak English less than very well
English speakers - Born in the United States 97.2% of residents of Sand Springs speak English at home.
2.3% of residents speak Spanish at home 119 88.8% Speak English very well15 11.2% Speak English less than very well0.5% of residents speak other language at home 31 100.0% Speak English very well
English speakers - Native, born elsewhere 91.5% of residents of Sand Springs speak English at home.
10.6% of residents speak Spanish at home 9 45.0% Speak English very well11 55.0% Speak English less than very well
English speakers - Foreign-born 23.4% of residents of Sand Springs speak English at home.
58.7% of residents speak Spanish at home 75 32.2% Speak English very well158 67.8% Speak English less than very well16.6% of residents speak other language at home 55 83.3% Speak English very well11 16.7% Speak English less than very well
White (Caucasian) - Speak only English Native:
100.0% (14,537)Foreign-born:
53.4% (44)
White (Caucasian) - Speak another language Native:
0.8% (118)Foreign-born:
56.5% (46)
American Indian / Alaska Native - Speak only English Native:
92.6% (1,195)Foreign-born:
83.2% (30)
Asian - Speak only English Native:
99.4% (82)Foreign-born:
26.8% (14)
Asian - Speak another language Native:
8.2% (7)Foreign-born:
74.3% (38)
Other race - Speak another language Native:
59.1% (162)Foreign-born:
100.0% (137)
Two or more races - Speak only English Native:
95.5% (1,615)Foreign-born:
7.7% (8)
Two or more races - Speak another language Native:
2.4% (41)Foreign-born:
89.1% (97)
White alone - Speak only English Native:
99.7% (14,532)Foreign-born:
61.1% (50)
White alone - Speak another language Native:
0.5% (79)Foreign-born:
42.1% (35)
Hispanic or Latino - Speak only English Native:
66.6% (523)Foreign-born:
12.6% (33)
Hispanic or Latino - Speak another language Native:
34.4% (270)Foreign-born:
86.3% (225)
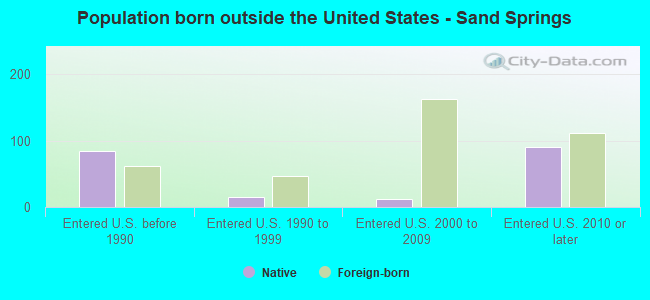
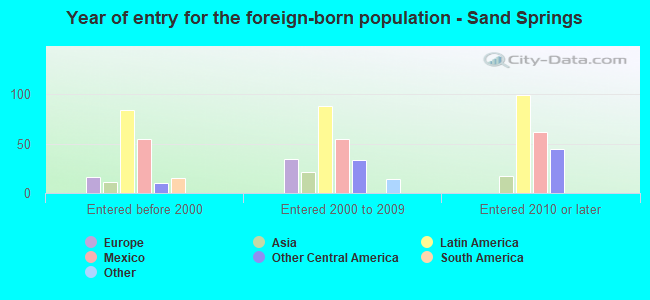
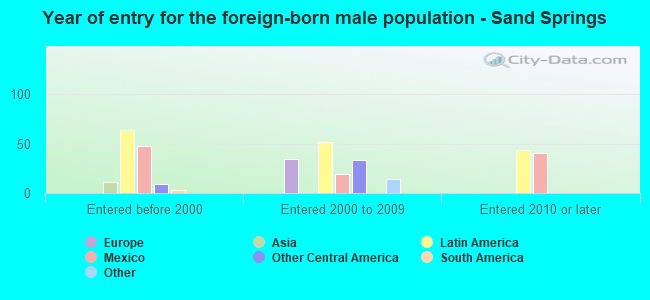
Foreign-born residents in Sand Springs 379 residents are foreign born
This city:
1.9%Oklahoma:
6.1%
Marital status for residents in Sand Springs Marital status - White (Caucasian) population 15 years and over
Males 29.4% Never married56.9% Now married1.3% Separated3.5% Widowed8.9% DivorcedFemales 18.4% Never married51.3% Now married1.7% Separated12.6% Widowed16.0% DivorcedWomen who gave birth in the past 12 months Now married:
85.7% (196)Unmarried:
14.3% (33)
Women who did not give birth in the past 12 months Now married:
53.4% (1,635)Unmarried:
46.6% (1,429)
Marital status - Black or African American population 15 years and over
Males 48.7% Never married44.0% Now married0.0% Separated7.3% Widowed0.0% DivorcedFemales 63.7% Never married27.4% Now married0.0% Separated3.2% Widowed5.6% DivorcedWomen who gave birth in the past 12 months Now married:
100.0% (2)Unmarried:
0.0% (0)
Women who did not give birth in the past 12 months Now married:
12.6% (12)Unmarried:
87.4% (80)
Marital status - American Indian / Alaska Native population 15 years and over
Males 47.1% Never married43.1% Now married1.4% Separated0.5% Widowed7.8% DivorcedFemales 32.3% Never married45.0% Now married0.0% Separated12.2% Widowed10.6% DivorcedWomen who gave birth in the past 12 months Now married:
0.0% (0)Unmarried:
100.0% (8)
Women who did not give birth in the past 12 months Now married:
50.2% (143)Unmarried:
49.8% (142)
Marital status - Asian population 15 years and over
Males 9.7% Never married48.4% Now married0.0% Separated0.0% Widowed41.9% DivorcedFemales 6.4% Never married93.6% Now married0.0% Separated0.0% Widowed0.0% DivorcedWomen who did not give birth in the past 12 months Now married:
92.3% (38)Unmarried:
7.7% (3)
Marital status - Other race population 15 years and over
Males 57.7% Never married22.9% Now married10.0% Separated1.5% Widowed8.0% DivorcedFemales 22.9% Never married51.8% Now married0.0% Separated16.9% Widowed8.4% DivorcedWomen who did not give birth in the past 12 months Now married:
56.7% (44)Unmarried:
43.3% (34)
Marital status - Two or more races population 15 years and over
Males 35.2% Never married50.9% Now married0.0% Separated5.0% Widowed8.9% DivorcedFemales 33.1% Never married39.1% Now married2.7% Separated6.5% Widowed18.5% DivorcedWomen who gave birth in the past 12 months Now married:
70.2% (43)Unmarried:
29.8% (18)
Women who did not give birth in the past 12 months Now married:
35.2% (191)Unmarried:
64.8% (352)
Marital status - White alone, not Hispanic / Latino population 15 years and over
Males 28.8% Never married57.3% Now married1.3% Separated3.6% Widowed8.9% DivorcedFemales 18.1% Never married51.1% Now married1.8% Separated12.9% Widowed16.1% DivorcedWomen who gave birth in the past 12 months Now married:
85.7% (207)Unmarried:
14.3% (34)
Women who did not give birth in the past 12 months Now married:
53.0% (1,643)Unmarried:
47.0% (1,459)
Marital status - Hispanic or Latino population 15 years and over
Males 56.0% Never married36.4% Now married2.5% Separated0.7% Widowed4.5% DivorcedFemales 34.0% Never married56.4% Now married0.0% Separated0.0% Widowed9.7% DivorcedWomen who gave birth in the past 12 months Now married:
100.0% (2)Unmarried:
0.0% (0)
Women who did not give birth in the past 12 months Now married:
55.9% (168)Unmarried:
44.1% (133)
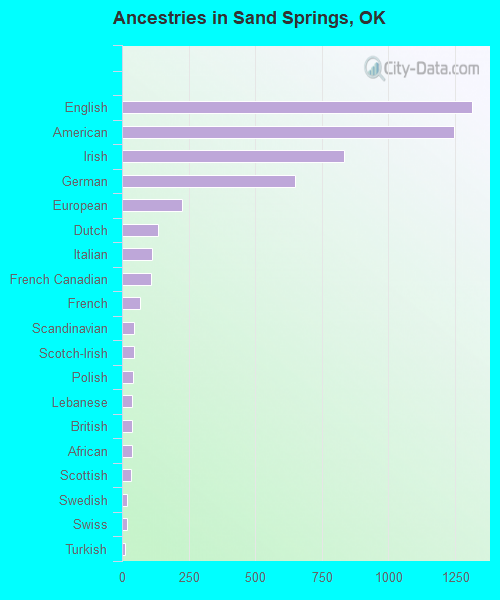
Ancestries in Sand Springs
1,312 14.0% English1,246 13.3% American834 8.9% Irish650 6.9% German225 2.4% European135 1.4% Dutch112 1.2% Italian107 1.1% French Canadian67 0.7% French46 0.5% Scandinavian44 0.5% Scotch-Irish41 0.4% Polish39 0.4% Lebanese37 0.4% British36 0.4% African33 0.4% Scottish20 0.2% Swedish18 0.2% Swiss13 0.1% Turkish11 0.1% Canadian10 0.1% Cajun10 0.1% Norwegian10 0.1% Slavic9 0.10% Brazilian9 0.10% German Russian9 0.10% Dutch West Indian6 0.06% Eastern European5 0.05% Welsh3 0.03% Czech
Children Nativity (place of birth) in Sand Springs
Children under 6 years - Living with two parents Both parents native 807 100.0% NativeOne native, one foreign-born parent 49 100.0% NativeChildren under 6 years - Living with one parent Native parent 429 100.0% NativeChildren 6 to 17 years - Living with two parents Both parents native 2,397 99.4% Native15 0.6% Foreign-bornBoth parents foreign-born 67 84.8% Native12 15.2% Foreign-bornOne native, one foreign-born parent 209 100.0% NativeChildren 6 to 17 years - Living with one parent Native parent 1,003 100.0% Native
Grandparents responsible for own grandchildren in Sand Springs
Grandparents (30 to 59 years) White / Caucasian 41 48.2% Responsible for grandchildren44 51.8% Not responsible for grandchildrenAmerican Indian / Alaska Native 8 100.0% Not responsible for grandchildrenTwo or more races 12 100.0% Not responsible for grandchildrenWhite alone, not Hispanic / Latino 43 46.9% Responsible for grandchildren49 53.1% Not responsible for grandchildrenGrandparents (60 years and over) White / Caucasian 47 26.6% Responsible for grandchildren131 73.4% Not responsible for grandchildrenAmerican Indian / Alaska Native 7 100.0% Responsible for grandchildrenTwo or more races 32 75.8% Responsible for grandchildren10 24.2% Not responsible for grandchildrenWhite alone, not Hispanic / Latino 49 27.0% Responsible for grandchildren133 73.0% Not responsible for grandchildren