Races in San Marcos, Texas (TX) Detailed Stats
Data:
Races - White alone (%)
Races - White alone (% change since 2000)
Races - Black alone (%)
Races - Black alone (% change since 2000)
Races - American Indian alone (%)
Races - American Indian alone (% change since 2000)
Races - Asian alone (%)
Races - Asian alone (% change since 2000)
Races - Hispanic (%)
Races - Hispanic (% change since 2000)
Races - Native Hawaiian and Other Pacific Islander alone (%)
Races - Native Hawaiian and Other Pacific Islander alone (% change since 2000)
Races - Two or more races(%)
Races - Two or more races(% change since 2000)
Races - Other race alone (%)
Races - Other race alone (% change since 2000)
Racial diversity
Place of birth - Born in state of residence (%)
Place of birth - Born in state of residence (%) - White
Place of birth - Born in state of residence (%) - Black or African American
Place of birth - Born in state of residence (%) - Asian
Place of birth - Born in state of residence (%) - Hispanic or Latino
Place of birth - Born in state of residence (%) - American Indian and Alaska Native
Place of birth - Born in state of residence (%) - Multirace
Place of birth - Born in state of residence (%) - Other Race
Place of birth - Born in other state (%)
Place of birth - Born in other state (%) - White
Place of birth - Born in other state (%) - Black or African American
Place of birth - Born in other state (%) - Asian
Place of birth - Born in other state (%) - Hispanic or Latino
Place of birth - Born in other state (%) - American Indian and Alaska Native
Place of birth - Born in other state (%) - Multirace
Place of birth - Born in other state (%) - Other Race
Place of birth - Native, outside of US (%)
Place of birth - Native, outside of US (%) - White
Place of birth - Native, outside of US (%) - Black or African American
Place of birth - Native, outside of US (%) - Asian
Place of birth - Native, outside of US (%) - Hispanic or Latino
Place of birth - Native, outside of US (%) - American Indian and Alaska Native
Place of birth - Native, outside of US (%) - Multirace
Place of birth - Native, outside of US (%) - Other Race
Place of birth - Foreign born (%)
Place of birth - Foreign born (%) - White
Place of birth - Foreign born (%) - Black or African American
Place of birth - Foreign born (%) - Asian
Place of birth - Foreign born (%) - Hispanic or Latino
Place of birth - Foreign born (%) - American Indian and Alaska Native
Place of birth - Foreign born (%) - Multirace
Place of birth - Foreign born (%) - Other Race
Residents speaking English at home (%)
Residents speaking English at home - Born in the United States (%)
Residents speaking English at home - Native, born elsewhere (%)
Residents speaking English at home - Foreign born (%)
Residents speaking Spanish at home (%)
Residents speaking Spanish at home - Born in the United States (%)
Residents speaking Spanish at home - Native, born elsewhere (%)
Residents speaking Spanish at home - Foreign born (%)
Residents speaking other language at home (%)
Residents speaking other language at home - Born in the United States (%)
Residents speaking other language at home - Native, born elsewhere (%)
Residents speaking other language at home - Foreign born (%)
Marital status - Never married (%)
Marital status - Now married (%)
Marital status - Separated (%)
Marital status - Widowed (%)
Marital status - Divorced (%)
Ancestries Reported - Arab (%)
Ancestries Reported - Czech (%)
Ancestries Reported - Danish (%)
Ancestries Reported - Dutch (%)
Ancestries Reported - English (%)
Ancestries Reported - French (%)
Ancestries Reported - French Canadian (%)
Ancestries Reported - German (%)
Ancestries Reported - Greek (%)
Ancestries Reported - Hungarian (%)
Ancestries Reported - Irish (%)
Ancestries Reported - Italian (%)
Ancestries Reported - Lithuanian (%)
Ancestries Reported - Norwegian (%)
Ancestries Reported - Polish (%)
Ancestries Reported - Portuguese (%)
Ancestries Reported - Russian (%)
Ancestries Reported - Scotch-Irish (%)
Ancestries Reported - Scottish (%)
Ancestries Reported - Slovak (%)
Ancestries Reported - Subsaharan African (%)
Ancestries Reported - Swedish (%)
Ancestries Reported - Swiss (%)
Ancestries Reported - Ukrainian (%)
Ancestries Reported - United States (%)
Ancestries Reported - Welsh (%)
Ancestries Reported - West Indian (%)
Ancestries Reported - Other (%)
Geographical mobility - Same house 1 year ago (%)
Geographical mobility - Same house 1 year ago (%) - White
Geographical mobility - Same house 1 year ago (%) - Black or African American
Geographical mobility - Same house 1 year ago (%) - Asian
Geographical mobility - Same house 1 year ago (%) - Hispanic or Latino
Geographical mobility - Same house 1 year ago (%) - American Indian and Alaska Native
Geographical mobility - Same house 1 year ago (%) - Multirace
Geographical mobility - Same house 1 year ago (%) - Other Race
Geographical mobility - Moved within same county (%)
Geographical mobility - Moved within same county (%) - White
Geographical mobility - Moved within same county (%) - Black or African American
Geographical mobility - Moved within same county (%) - Asian
Geographical mobility - Moved within same county (%) - Hispanic or Latino
Geographical mobility - Moved within same county (%) - American Indian and Alaska Native
Geographical mobility - Moved within same county (%) - Multirace
Geographical mobility - Moved within same county (%) - Other Race
Geographical mobility - Moved from different county within same state (%)
Geographical mobility - Moved from different county within same state (%) - White
Geographical mobility - Moved from different county within same state (%) - Black or African American
Geographical mobility - Moved from different county within same state (%) - Asian
Geographical mobility - Moved from different county within same state (%) - Hispanic or Latino
Geographical mobility - Moved from different county within same state (%) - American Indian and Alaska Native
Geographical mobility - Moved from different county within same state (%) - Multirace
Geographical mobility - Moved from different county within same state (%) - Other Race
Geographical mobility - Moved from different state (%)
Geographical mobility - Moved from different state (%) - White
Geographical mobility - Moved from different state (%) - Black or African American
Geographical mobility - Moved from different state (%) - Asian
Geographical mobility - Moved from different state (%) - Hispanic or Latino
Geographical mobility - Moved from different state (%) - American Indian and Alaska Native
Geographical mobility - Moved from different state (%) - Multirace
Geographical mobility - Moved from different state (%) - Other Race
Geographical mobility - Moved from abroad (%)
Geographical mobility - Moved from abroad (%) - White
Geographical mobility - Moved from abroad (%) - Black or African American
Geographical mobility - Moved from abroad (%) - Asian
Geographical mobility - Moved from abroad (%) - Hispanic or Latino
Geographical mobility - Moved from abroad (%) - American Indian and Alaska Native
Geographical mobility - Moved from abroad (%) - Multirace
Geographical mobility - Moved from abroad (%) - Other Race
Place of birth for the foreign-born population - Ireland (%)
Place of birth for the foreign-born population - Denmark (%)
Place of birth for the foreign-born population - Norway (%)
Place of birth for the foreign-born population - Sweden (%)
Place of birth for the foreign-born population - United Kingdom (%)
Place of birth for the foreign-born population - England (%)
Place of birth for the foreign-born population - Scotland (%)
Place of birth for the foreign-born population - Other Northern Europe (%)
Place of birth for the foreign-born population - Austria (%)
Place of birth for the foreign-born population - Belgium (%)
Place of birth for the foreign-born population - France (%)
Place of birth for the foreign-born population - Germany (%)
Place of birth for the foreign-born population - Netherlands (%)
Place of birth for the foreign-born population - Switzerland (%)
Place of birth for the foreign-born population - Other Western Europe (%)
Place of birth for the foreign-born population - Greece (%)
Place of birth for the foreign-born population - Italy (%)
Place of birth for the foreign-born population - Portugal (%)
Place of birth for the foreign-born population - Spain (%)
Place of birth for the foreign-born population - Other Southern Europe (%)
Place of birth for the foreign-born population - Albania (%)
Place of birth for the foreign-born population - Belarus (%)
Place of birth for the foreign-born population - Bosnia and Herzegovina (%)
Place of birth for the foreign-born population - Bulgaria (%)
Place of birth for the foreign-born population - Croatia (%)
Place of birth for the foreign-born population - Czechoslovakia (%)
Place of birth for the foreign-born population - Hungary (%)
Place of birth for the foreign-born population - Latvia (%)
Place of birth for the foreign-born population - Lithuania (%)
Place of birth for the foreign-born population - North Macedonia (Macedonia) (%)
Place of birth for the foreign-born population - Moldova (%)
Place of birth for the foreign-born population - Poland (%)
Place of birth for the foreign-born population - Romania (%)
Place of birth for the foreign-born population - Russia (%)
Place of birth for the foreign-born population - Serbia (%)
Place of birth for the foreign-born population - Ukraine (%)
Place of birth for the foreign-born population - Other Eastern Europe (%)
Place of birth for the foreign-born population - China (%)
Place of birth for the foreign-born population - Hong Kong (%)
Place of birth for the foreign-born population - Taiwan (%)
Place of birth for the foreign-born population - Japan (%)
Place of birth for the foreign-born population - Korea (%)
Place of birth for the foreign-born population - Other Eastern Asia (%)
Place of birth for the foreign-born population - Afghanistan (%)
Place of birth for the foreign-born population - Bangladesh (%)
Place of birth for the foreign-born population - India (%)
Place of birth for the foreign-born population - Iran (%)
Place of birth for the foreign-born population - Kazakhstan (%)
Place of birth for the foreign-born population - Nepal (%)
Place of birth for the foreign-born population - Pakistan (%)
Place of birth for the foreign-born population - Sri Lanka (%)
Place of birth for the foreign-born population - Uzbekistan (%)
Place of birth for the foreign-born population - Other South Central Asia (%)
Place of birth for the foreign-born population - Burma (%)
Place of birth for the foreign-born population - Cambodia (%)
Place of birth for the foreign-born population - Indonesia (%)
Place of birth for the foreign-born population - Laos (%)
Place of birth for the foreign-born population - Malaysia (%)
Place of birth for the foreign-born population - Philippines (%)
Place of birth for the foreign-born population - Singapore (%)
Place of birth for the foreign-born population - Thailand (%)
Place of birth for the foreign-born population - Vietnam (%)
Place of birth for the foreign-born population - Other South Eastern Asia (%)
Place of birth for the foreign-born population - Armenia (%)
Place of birth for the foreign-born population - Iraq (%)
Place of birth for the foreign-born population - Israel (%)
Place of birth for the foreign-born population - Jordan (%)
Place of birth for the foreign-born population - Kuwait (%)
Place of birth for the foreign-born population - Lebanon (%)
Place of birth for the foreign-born population - Saudi Arabia (%)
Place of birth for the foreign-born population - Syria (%)
Place of birth for the foreign-born population - Turkey (%)
Place of birth for the foreign-born population - Yemen (%)
Place of birth for the foreign-born population - Other Western Asia (%)
Place of birth for the foreign-born population - Eritrea (%)
Place of birth for the foreign-born population - Ethiopia (%)
Place of birth for the foreign-born population - Kenya (%)
Place of birth for the foreign-born population - Somalia (%)
Place of birth for the foreign-born population - Uganda (%)
Place of birth for the foreign-born population - Zimbabwe (%)
Place of birth for the foreign-born population - Other Eastern Africa (%)
Place of birth for the foreign-born population - Cameroon (%)
Place of birth for the foreign-born population - Congo (%)
Place of birth for the foreign-born population - Democratic Republic of Congo (Zaire) (%)
Place of birth for the foreign-born population - Other Middle Africa (%)
Place of birth for the foreign-born population - Egypt (%)
Place of birth for the foreign-born population - Morocco (%)
Place of birth for the foreign-born population - Sudan (%)
Place of birth for the foreign-born population - Other Northern Africa (%)
Place of birth for the foreign-born population - South Africa (%)
Place of birth for the foreign-born population - Other Southern Africa (%)
Place of birth for the foreign-born population - Cabo Verde (%)
Place of birth for the foreign-born population - Ghana (%)
Place of birth for the foreign-born population - Liberia (%)
Place of birth for the foreign-born population - Nigeria (%)
Place of birth for the foreign-born population - Senegal (%)
Place of birth for the foreign-born population - Sierra Leone (%)
Place of birth for the foreign-born population - Other Western Africa (%)
Place of birth for the foreign-born population - Australia (%)
Place of birth for the foreign-born population - New Zealand (%)
Place of birth for the foreign-born population - Fiji (%)
Place of birth for the foreign-born population - Micronesia (%)
Place of birth for the foreign-born population - Bahamas (%)
Place of birth for the foreign-born population - Barbados (%)
Place of birth for the foreign-born population - Cuba (%)
Place of birth for the foreign-born population - Dominica (%)
Place of birth for the foreign-born population - Dominican Republic (%)
Place of birth for the foreign-born population - Grenada (%)
Place of birth for the foreign-born population - Haiti (%)
Place of birth for the foreign-born population - Jamaica (%)
Place of birth for the foreign-born population - St. Vincent and the Grenadines (%)
Place of birth for the foreign-born population - Trinidad and Tobago (%)
Place of birth for the foreign-born population - West Indies (%)
Place of birth for the foreign-born population - Other Caribbean (%)
Place of birth for the foreign-born population - Belize (%)
Place of birth for the foreign-born population - Costa Rica (%)
Place of birth for the foreign-born population - El Salvador (%)
Place of birth for the foreign-born population - Guatemala (%)
Place of birth for the foreign-born population - Honduras (%)
Place of birth for the foreign-born population - Mexico (%)
Place of birth for the foreign-born population - Nicaragua (%)
Place of birth for the foreign-born population - Panama (%)
Place of birth for the foreign-born population - Other Central America (%)
Place of birth for the foreign-born population - Argentina (%)
Place of birth for the foreign-born population - Bolivia (%)
Place of birth for the foreign-born population - Brazil (%)
Place of birth for the foreign-born population - Chile (%)
Place of birth for the foreign-born population - Colombia (%)
Place of birth for the foreign-born population - Ecuador (%)
Place of birth for the foreign-born population - Guyana (%)
Place of birth for the foreign-born population - Peru (%)
Place of birth for the foreign-born population - Uruguay (%)
Place of birth for the foreign-born population - Venezuela (%)
Place of birth for the foreign-born population - Other South America (%)
Place of birth for the foreign-born population - Canada (%)
Place of birth for the foreign-born population - Other Northern America (%)
Place of birth for the foreign-born population - Other (%)
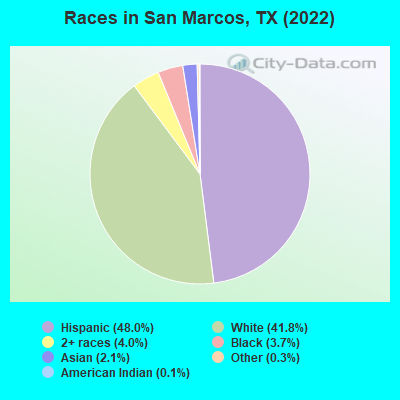
According to 2022 data, the most numerous races in San Marcos, TX are Hispanic (33,744 residents), White alone (29,360 residents), and Black alone (2,567 residents). 73.3% of San Marcos residents speak English at home. 8.2% of San Marcos, TX residents are foreign-born (4.9% born in Latin America, 2.8% born in Asia), which is 106.1% less than the foreign-born rate of 17.0% across the entire state of Texas.
Race distribution in San Marcos
2000 2022
10,933,313 52.4% White alone 6,669,666 32.0% Hispanic 2,364,255 11.3% Black alone 554,445 2.7% Asian alone 230,567 1.1% Two or more races 68,859 0.3% American Indian alone 19,958 0.10% Other race alone 10,757 0.05% Native Hawaiian and Other
12,070,642 40.2% Hispanic 11,683,430 38.9% White alone 3,508,706 11.7% Black alone 1,608,173 5.4% Asian alone 956,560 3.2% Two or more races 125,763 0.4% Other race alone 47,023 0.2% American Indian alone 29,275 0.10% Native Hawaiian and Other
Income and house value in San Marcos Median household income in 2022 $50,040 White non-Hispanic householders$32,117 Black householders$69,023 Asian householders$49,716 Some other race householders$73,139 Two or more races householders$54,320 Hispanic or Latino race householdersMedian 2022 house value $371,395 White Non-Hispanic householders$182,130 Black or African American householders$230,573 American Indian or Alaska Native householders $516,348 Asian householders$221,185 Some other race householders$238,834 Two or more races householders$232,826 Hispanic or Latino householders
Median age by race in San Marcos
25.8 Median age for White residents25.2 26.3 20.9 Median age for Black or African American residents21.5 20.9 41.3 Median age for American Indian / Alaska Native residents-666,666,666.0 42.0 21.3 Median age for Asian residents22.0 21.1 -666,666,666.0 Median age for Native Hawaiian / Pacific Islander residents-666,666,666.0 -666,666,666.0 25.0 Median age for Other race residents25.6 23.3 25.9 Median age for Two or more races residents32.1 23.6 26.6 Median age for White alone residents27.2 26.4 25.3 Median age for Hispanic or Latino residents26.1 24.0
Owner/renter occupied households by race in San Marcos
House owners and renters - White residents 5,800 31.5% Owner occupied12,621 68.5% Renter occupiedHouse owners and renters - Black or African American residents 155 14.3% Owner occupied931 85.7% Renter occupiedHouse owners and renters - American Indian / Alaska Native residents 80 40.2% Owner occupied119 59.8% Renter occupiedHouse owners and renters - Asian residents 109 27.5% Owner occupied288 72.5% Renter occupiedHouse owners and renters - Other race residents 1,364 34.7% Owner occupied2,566 65.3% Renter occupiedHouse owners and renters - Two or more races residents 3,018 47.4% Owner occupied3,346 52.6% Renter occupiedHouse owners and renters - White alone residents 4,443 32.1% Owner occupied9,412 67.9% Renter occupiedHouse owners and renters - Hispanic or Latino residents 5,356 39.2% Owner occupied8,304 60.8% Renter occupied
Language usage in San Marcos
English speakers - Total 73.3% of residents of San Marcos speak English at home.
24.5% of residents speak Spanish at home 13,401 81.4% Speak English very well3,057 18.6% Speak English less than very well2.2% of residents speak other language at home 1,043 71.9% Speak English very well408 28.1% Speak English less than very well
English speakers - Born in the United States 88.5% of residents of San Marcos speak English at home.
10.1% of residents speak Spanish at home 863 79.4% Speak English very well224 20.6% Speak English less than very well1.4% of residents speak other language at home 81 54.7% Speak English very well67 45.3% Speak English less than very well
English speakers - Native, born elsewhere 42.7% of residents of San Marcos speak English at home.
51.9% of residents speak Spanish at home 403 53.4% Speak English very well352 46.6% Speak English less than very well5.4% of residents speak other language at home 79 100.0% Speak English very well
English speakers - Foreign-born 19.1% of residents of San Marcos speak English at home.
65.3% of residents speak Spanish at home 2,515 58.7% Speak English very well1,769 41.3% Speak English less than very well15.6% of residents speak other language at home 679 66.6% Speak English very well341 33.4% Speak English less than very well
White (Caucasian) - Speak only English Native:
90.1% (32,632)Foreign-born:
46.8% (459)
White (Caucasian) - Speak another language Native:
9.9% (3,578)Foreign-born:
53.2% (521)
Black or African American - Speak only English Native:
93.0% (3,588)Foreign-born:
41.9% (79)
Black or African American - Speak another language Native:
7.0% (269)Foreign-born:
56.5% (106)
Asian - Speak only English Native:
55.6% (269)Foreign-born:
14.1% (209)
Asian - Speak another language Native:
42.8% (207)Foreign-born:
81.2% (1,201)
Other race - Speak another language Native:
37.6% (3,129)Foreign-born:
100.0% (1,607)
Two or more races - Speak only English Native:
54.3% (6,587)Foreign-born:
18.7% (546)
Two or more races - Speak another language Native:
45.7% (5,541)Foreign-born:
81.3% (2,381)
White alone - Speak only English Native:
95.6% (28,363)Foreign-born:
27.4% (285)
White alone - Speak another language Native:
4.5% (1,325)Foreign-born:
57.3% (595)
Hispanic or Latino - Speak only English Native:
56.7% (15,092)Foreign-born:
15.2% (770)
Hispanic or Latino - Speak another language Native:
43.3% (11,539)Foreign-born:
84.8% (4,284)
Foreign-born residents in San Marcos 6,078 residents are foreign born (4.9% Latin America , 2.8% Asia ).
This city:
8.2%Texas:
17.1%
Marital status for residents in San Marcos Marital status - White (Caucasian) population 15 years and over
Males 56.4% Never married33.1% Now married0.5% Separated1.6% Widowed8.4% DivorcedFemales 57.0% Never married28.7% Now married0.5% Separated4.5% Widowed9.3% DivorcedWomen who gave birth in the past 12 months Now married:
23.9% (74)Unmarried:
76.1% (235)
Women who did not give birth in the past 12 months Now married:
23.6% (3,584)Unmarried:
76.4% (11,614)
Marital status - Black or African American population 15 years and over
Males 56.8% Never married17.3% Now married1.7% Separated6.9% Widowed17.3% DivorcedFemales 77.0% Never married8.2% Now married0.7% Separated3.1% Widowed11.0% DivorcedWomen who gave birth in the past 12 months Now married:
15.3% (15)Unmarried:
84.7% (84)
Women who did not give birth in the past 12 months Now married:
7.7% (134)Unmarried:
92.3% (1,606)
Marital status - American Indian / Alaska Native population 15 years and over
Males 58.7% Never married41.3% Now married0.0% Separated0.0% Widowed0.0% DivorcedFemales 47.2% Never married24.6% Now married11.8% Separated16.4% Widowed0.0% DivorcedWomen who gave birth in the past 12 months Now married:
0.0% (0)Unmarried:
100.0% (13)
Women who did not give birth in the past 12 months Now married:
46.1% (102)Unmarried:
53.9% (119)
Marital status - Asian population 15 years and over
Males 77.5% Never married22.5% Now married0.0% Separated0.0% Widowed0.0% DivorcedFemales 58.9% Never married26.7% Now married2.9% Separated0.0% Widowed11.6% DivorcedWomen who did not give birth in the past 12 months Now married:
21.8% (157)Unmarried:
78.2% (563)
Marital status - Native Hawaiian / Pacific Islander population 15 years and over
Males 100.0% Never married0.0% Now married0.0% Separated0.0% Widowed0.0% DivorcedFemales 100.0% Never married0.0% Now married0.0% Separated0.0% Widowed0.0% DivorcedWomen who did not give birth in the past 12 months Now married:
0.0% (0)Unmarried:
100.0% (13)
Marital status - Other race population 15 years and over
Males 45.6% Never married30.7% Now married0.7% Separated0.0% Widowed23.1% DivorcedFemales 45.7% Never married30.4% Now married2.1% Separated1.1% Widowed20.6% DivorcedWomen who did not give birth in the past 12 months Now married:
25.5% (555)Unmarried:
74.5% (1,622)
Marital status - Two or more races population 15 years and over
Males 48.4% Never married39.0% Now married0.0% Separated0.0% Widowed12.6% DivorcedFemales 44.6% Never married41.4% Now married2.5% Separated3.7% Widowed7.8% DivorcedWomen who gave birth in the past 12 months Now married:
100.0% (334)Unmarried:
0.0% (0)
Women who did not give birth in the past 12 months Now married:
30.9% (1,316)Unmarried:
69.1% (2,941)
Marital status - White alone, not Hispanic / Latino population 15 years and over
Males 57.3% Never married33.7% Now married0.6% Separated1.7% Widowed6.7% DivorcedFemales 55.2% Never married28.7% Now married0.6% Separated3.9% Widowed11.5% DivorcedWomen who gave birth in the past 12 months Now married:
23.9% (74)Unmarried:
76.1% (235)
Women who did not give birth in the past 12 months Now married:
23.6% (2,566)Unmarried:
76.4% (8,314)
Marital status - Hispanic or Latino population 15 years and over
Males 47.1% Never married42.4% Now married0.0% Separated0.2% Widowed10.3% DivorcedFemales 55.4% Never married32.4% Now married1.9% Separated3.7% Widowed6.6% DivorcedWomen who gave birth in the past 12 months Now married:
100.0% (334)Unmarried:
0.0% (0)
Women who did not give birth in the past 12 months Now married:
26.0% (3,137)Unmarried:
74.0% (8,921)
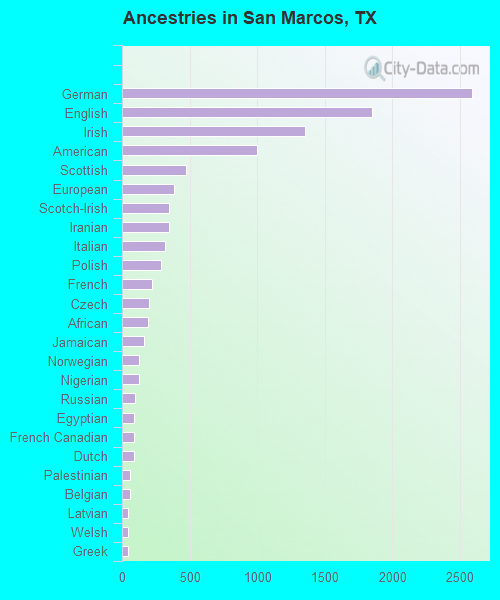
Ancestries in San Marcos
2,587 7.4% German1,854 5.3% English1,352 3.9% Irish1,002 2.9% American471 1.4% Scottish382 1.1% European348 1.0% Scotch-Irish347 1.0% Iranian319 0.9% Italian287 0.8% Polish219 0.6% French203 0.6% Czech190 0.5% African166 0.5% Jamaican126 0.4% Norwegian124 0.4% Nigerian95 0.3% Russian89 0.3% Egyptian89 0.3% French Canadian87 0.3% Dutch62 0.2% Palestinian57 0.2% Belgian47 0.1% Latvian47 0.1% Welsh45 0.1% Greek42 0.1% Eastern European40 0.1% Swedish39 0.1% Slovene37 0.1% Brazilian24 0.07% Northern European24 0.07% Arab20 0.06% Czechoslovakian19 0.05% Portuguese18 0.05% Hungarian17 0.05% Pennsylvania German16 0.05% Lebanese16 0.05% Danish14 0.04% Swiss12 0.03% Ghanaian10 0.03% Iraqi10 0.03% Austrian6 0.02% Scandinavian6 0.02% Sierra Leonean6 0.02% Ukrainian5 0.01% British4 0.01% West Indian
Geographical mobility in San Marcos Same house 1 year ago 27,115 69.6% White (Caucasian)2,045 67.4% Black or African American420 89.2% American Indian / Alaska Native1,124 66.8% Asian68 81.6% Native Hawaiian / Pacific Islander7,338 71.3% Other race10,927 69.1% Two or more races19,519 66.6% White alone, not Hispanic / Latino24,557 73.4% Hispanic or LatinoMoved within same county 3,286 8.4% White / Caucasian133 4.4% Black or African American11 2.3% American Indian / Alaska Native140 8.3% Asian1,320 12.8% Other race1,982 12.5% Two or more races2,531 8.6% White alone, not Hispanic / Latino3,737 11.2% Hispanic or LatinoMoved within same state 7,482 19.2% White / Caucasian792 26.1% Black or African American29 6.2% American Indian / Alaska Native310 18.4% Asian21 25.5% Native Hawaiian / Pacific Islander1,586 15.4% Other race2,491 15.8% Two or more races6,266 21.4% White alone, not Hispanic / Latino4,697 14.0% Hispanic or LatinoMoved from different state 689 1.8% White / Caucasian64 2.1% Black or African American16 3.4% American Indian / Alaska Native78 4.6% Asian6 0.1% Other race268 1.7% Two or more races646 2.2% White alone, not Hispanic / Latino226 0.7% Hispanic or LatinoMoved from abroad 379 1.0% White49 2.9% Asian41 0.4% Other race135 0.9% Two or more races332 1.1% White alone, not Hispanic / Latino223 0.7% Hispanic or Latino
Children Nativity (place of birth) in San Marcos
Children under 6 years - Living with two parents Both parents native 1,502 100.0% NativeBoth parents foreign-born 177 100.0% NativeOne native, one foreign-born parent 232 100.0% NativeChildren under 6 years - Living with one parent Native parent 1,169 100.0% NativeForeign-born parent 30 100.0% Foreign-bornChildren 6 to 17 years - Living with two parents Both parents native 2,318 100.0% NativeBoth parents foreign-born 261 78.0% Native74 22.0% Foreign-bornOne native, one foreign-born parent 575 100.0% NativeChildren 6 to 17 years - Living with one parent Native parent 1,346 92.4% Native111 7.6% Foreign-bornForeign-born parent 120 70.3% Native51 29.7% Foreign-born
Grandparents responsible for own grandchildren in San Marcos
Grandparents (30 to 59 years) White / Caucasian 10 100.0% Not responsible for grandchildrenBlack or African American 11 100.0% Not responsible for grandchildrenOther race 33 22.1% Responsible for grandchildren117 77.9% Not responsible for grandchildrenTwo or more races 75 100.0% Not responsible for grandchildrenHispanic or Latino 49 15.5% Responsible for grandchildren267 84.5% Not responsible for grandchildrenGrandparents (60 years and over) White / Caucasian 25 41.8% Responsible for grandchildren34 58.2% Not responsible for grandchildrenBlack or African American 59 100.0% Not responsible for grandchildrenTwo or more races 111 100.0% Not responsible for grandchildrenHispanic or Latino 90 100.0% Not responsible for grandchildren