Races in San Castle, Florida (FL) Detailed Stats
Data:
Races - White alone (%)
Races - White alone (% change since 2000)
Races - Black alone (%)
Races - Black alone (% change since 2000)
Races - American Indian alone (%)
Races - American Indian alone (% change since 2000)
Races - Asian alone (%)
Races - Asian alone (% change since 2000)
Races - Hispanic (%)
Races - Hispanic (% change since 2000)
Races - Native Hawaiian and Other Pacific Islander alone (%)
Races - Native Hawaiian and Other Pacific Islander alone (% change since 2000)
Races - Two or more races(%)
Races - Two or more races(% change since 2000)
Races - Other race alone (%)
Races - Other race alone (% change since 2000)
Racial diversity
Place of birth - Born in state of residence (%)
Place of birth - Born in state of residence (%) - White
Place of birth - Born in state of residence (%) - Black or African American
Place of birth - Born in state of residence (%) - Asian
Place of birth - Born in state of residence (%) - Hispanic or Latino
Place of birth - Born in state of residence (%) - American Indian and Alaska Native
Place of birth - Born in state of residence (%) - Multirace
Place of birth - Born in state of residence (%) - Other Race
Place of birth - Born in other state (%)
Place of birth - Born in other state (%) - White
Place of birth - Born in other state (%) - Black or African American
Place of birth - Born in other state (%) - Asian
Place of birth - Born in other state (%) - Hispanic or Latino
Place of birth - Born in other state (%) - American Indian and Alaska Native
Place of birth - Born in other state (%) - Multirace
Place of birth - Born in other state (%) - Other Race
Place of birth - Native, outside of US (%)
Place of birth - Native, outside of US (%) - White
Place of birth - Native, outside of US (%) - Black or African American
Place of birth - Native, outside of US (%) - Asian
Place of birth - Native, outside of US (%) - Hispanic or Latino
Place of birth - Native, outside of US (%) - American Indian and Alaska Native
Place of birth - Native, outside of US (%) - Multirace
Place of birth - Native, outside of US (%) - Other Race
Place of birth - Foreign born (%)
Place of birth - Foreign born (%) - White
Place of birth - Foreign born (%) - Black or African American
Place of birth - Foreign born (%) - Asian
Place of birth - Foreign born (%) - Hispanic or Latino
Place of birth - Foreign born (%) - American Indian and Alaska Native
Place of birth - Foreign born (%) - Multirace
Place of birth - Foreign born (%) - Other Race
Residents speaking English at home (%)
Residents speaking English at home - Born in the United States (%)
Residents speaking English at home - Native, born elsewhere (%)
Residents speaking English at home - Foreign born (%)
Residents speaking Spanish at home (%)
Residents speaking Spanish at home - Born in the United States (%)
Residents speaking Spanish at home - Native, born elsewhere (%)
Residents speaking Spanish at home - Foreign born (%)
Residents speaking other language at home (%)
Residents speaking other language at home - Born in the United States (%)
Residents speaking other language at home - Native, born elsewhere (%)
Residents speaking other language at home - Foreign born (%)
Marital status - Never married (%)
Marital status - Now married (%)
Marital status - Separated (%)
Marital status - Widowed (%)
Marital status - Divorced (%)
Ancestries Reported - Arab (%)
Ancestries Reported - Czech (%)
Ancestries Reported - Danish (%)
Ancestries Reported - Dutch (%)
Ancestries Reported - English (%)
Ancestries Reported - French (%)
Ancestries Reported - French Canadian (%)
Ancestries Reported - German (%)
Ancestries Reported - Greek (%)
Ancestries Reported - Hungarian (%)
Ancestries Reported - Irish (%)
Ancestries Reported - Italian (%)
Ancestries Reported - Lithuanian (%)
Ancestries Reported - Norwegian (%)
Ancestries Reported - Polish (%)
Ancestries Reported - Portuguese (%)
Ancestries Reported - Russian (%)
Ancestries Reported - Scotch-Irish (%)
Ancestries Reported - Scottish (%)
Ancestries Reported - Slovak (%)
Ancestries Reported - Subsaharan African (%)
Ancestries Reported - Swedish (%)
Ancestries Reported - Swiss (%)
Ancestries Reported - Ukrainian (%)
Ancestries Reported - United States (%)
Ancestries Reported - Welsh (%)
Ancestries Reported - West Indian (%)
Ancestries Reported - Other (%)
Geographical mobility - Same house 1 year ago (%)
Geographical mobility - Same house 1 year ago (%) - White
Geographical mobility - Same house 1 year ago (%) - Black or African American
Geographical mobility - Same house 1 year ago (%) - Asian
Geographical mobility - Same house 1 year ago (%) - Hispanic or Latino
Geographical mobility - Same house 1 year ago (%) - American Indian and Alaska Native
Geographical mobility - Same house 1 year ago (%) - Multirace
Geographical mobility - Same house 1 year ago (%) - Other Race
Geographical mobility - Moved within same county (%)
Geographical mobility - Moved within same county (%) - White
Geographical mobility - Moved within same county (%) - Black or African American
Geographical mobility - Moved within same county (%) - Asian
Geographical mobility - Moved within same county (%) - Hispanic or Latino
Geographical mobility - Moved within same county (%) - American Indian and Alaska Native
Geographical mobility - Moved within same county (%) - Multirace
Geographical mobility - Moved within same county (%) - Other Race
Geographical mobility - Moved from different county within same state (%)
Geographical mobility - Moved from different county within same state (%) - White
Geographical mobility - Moved from different county within same state (%) - Black or African American
Geographical mobility - Moved from different county within same state (%) - Asian
Geographical mobility - Moved from different county within same state (%) - Hispanic or Latino
Geographical mobility - Moved from different county within same state (%) - American Indian and Alaska Native
Geographical mobility - Moved from different county within same state (%) - Multirace
Geographical mobility - Moved from different county within same state (%) - Other Race
Geographical mobility - Moved from different state (%)
Geographical mobility - Moved from different state (%) - White
Geographical mobility - Moved from different state (%) - Black or African American
Geographical mobility - Moved from different state (%) - Asian
Geographical mobility - Moved from different state (%) - Hispanic or Latino
Geographical mobility - Moved from different state (%) - American Indian and Alaska Native
Geographical mobility - Moved from different state (%) - Multirace
Geographical mobility - Moved from different state (%) - Other Race
Geographical mobility - Moved from abroad (%)
Geographical mobility - Moved from abroad (%) - White
Geographical mobility - Moved from abroad (%) - Black or African American
Geographical mobility - Moved from abroad (%) - Asian
Geographical mobility - Moved from abroad (%) - Hispanic or Latino
Geographical mobility - Moved from abroad (%) - American Indian and Alaska Native
Geographical mobility - Moved from abroad (%) - Multirace
Geographical mobility - Moved from abroad (%) - Other Race
Place of birth for the foreign-born population - Ireland (%)
Place of birth for the foreign-born population - Denmark (%)
Place of birth for the foreign-born population - Norway (%)
Place of birth for the foreign-born population - Sweden (%)
Place of birth for the foreign-born population - United Kingdom (%)
Place of birth for the foreign-born population - England (%)
Place of birth for the foreign-born population - Scotland (%)
Place of birth for the foreign-born population - Other Northern Europe (%)
Place of birth for the foreign-born population - Austria (%)
Place of birth for the foreign-born population - Belgium (%)
Place of birth for the foreign-born population - France (%)
Place of birth for the foreign-born population - Germany (%)
Place of birth for the foreign-born population - Netherlands (%)
Place of birth for the foreign-born population - Switzerland (%)
Place of birth for the foreign-born population - Other Western Europe (%)
Place of birth for the foreign-born population - Greece (%)
Place of birth for the foreign-born population - Italy (%)
Place of birth for the foreign-born population - Portugal (%)
Place of birth for the foreign-born population - Spain (%)
Place of birth for the foreign-born population - Other Southern Europe (%)
Place of birth for the foreign-born population - Albania (%)
Place of birth for the foreign-born population - Belarus (%)
Place of birth for the foreign-born population - Bosnia and Herzegovina (%)
Place of birth for the foreign-born population - Bulgaria (%)
Place of birth for the foreign-born population - Croatia (%)
Place of birth for the foreign-born population - Czechoslovakia (%)
Place of birth for the foreign-born population - Hungary (%)
Place of birth for the foreign-born population - Latvia (%)
Place of birth for the foreign-born population - Lithuania (%)
Place of birth for the foreign-born population - North Macedonia (Macedonia) (%)
Place of birth for the foreign-born population - Moldova (%)
Place of birth for the foreign-born population - Poland (%)
Place of birth for the foreign-born population - Romania (%)
Place of birth for the foreign-born population - Russia (%)
Place of birth for the foreign-born population - Serbia (%)
Place of birth for the foreign-born population - Ukraine (%)
Place of birth for the foreign-born population - Other Eastern Europe (%)
Place of birth for the foreign-born population - China (%)
Place of birth for the foreign-born population - Hong Kong (%)
Place of birth for the foreign-born population - Taiwan (%)
Place of birth for the foreign-born population - Japan (%)
Place of birth for the foreign-born population - Korea (%)
Place of birth for the foreign-born population - Other Eastern Asia (%)
Place of birth for the foreign-born population - Afghanistan (%)
Place of birth for the foreign-born population - Bangladesh (%)
Place of birth for the foreign-born population - India (%)
Place of birth for the foreign-born population - Iran (%)
Place of birth for the foreign-born population - Kazakhstan (%)
Place of birth for the foreign-born population - Nepal (%)
Place of birth for the foreign-born population - Pakistan (%)
Place of birth for the foreign-born population - Sri Lanka (%)
Place of birth for the foreign-born population - Uzbekistan (%)
Place of birth for the foreign-born population - Other South Central Asia (%)
Place of birth for the foreign-born population - Burma (%)
Place of birth for the foreign-born population - Cambodia (%)
Place of birth for the foreign-born population - Indonesia (%)
Place of birth for the foreign-born population - Laos (%)
Place of birth for the foreign-born population - Malaysia (%)
Place of birth for the foreign-born population - Philippines (%)
Place of birth for the foreign-born population - Singapore (%)
Place of birth for the foreign-born population - Thailand (%)
Place of birth for the foreign-born population - Vietnam (%)
Place of birth for the foreign-born population - Other South Eastern Asia (%)
Place of birth for the foreign-born population - Armenia (%)
Place of birth for the foreign-born population - Iraq (%)
Place of birth for the foreign-born population - Israel (%)
Place of birth for the foreign-born population - Jordan (%)
Place of birth for the foreign-born population - Kuwait (%)
Place of birth for the foreign-born population - Lebanon (%)
Place of birth for the foreign-born population - Saudi Arabia (%)
Place of birth for the foreign-born population - Syria (%)
Place of birth for the foreign-born population - Turkey (%)
Place of birth for the foreign-born population - Yemen (%)
Place of birth for the foreign-born population - Other Western Asia (%)
Place of birth for the foreign-born population - Eritrea (%)
Place of birth for the foreign-born population - Ethiopia (%)
Place of birth for the foreign-born population - Kenya (%)
Place of birth for the foreign-born population - Somalia (%)
Place of birth for the foreign-born population - Uganda (%)
Place of birth for the foreign-born population - Zimbabwe (%)
Place of birth for the foreign-born population - Other Eastern Africa (%)
Place of birth for the foreign-born population - Cameroon (%)
Place of birth for the foreign-born population - Congo (%)
Place of birth for the foreign-born population - Democratic Republic of Congo (Zaire) (%)
Place of birth for the foreign-born population - Other Middle Africa (%)
Place of birth for the foreign-born population - Egypt (%)
Place of birth for the foreign-born population - Morocco (%)
Place of birth for the foreign-born population - Sudan (%)
Place of birth for the foreign-born population - Other Northern Africa (%)
Place of birth for the foreign-born population - South Africa (%)
Place of birth for the foreign-born population - Other Southern Africa (%)
Place of birth for the foreign-born population - Cabo Verde (%)
Place of birth for the foreign-born population - Ghana (%)
Place of birth for the foreign-born population - Liberia (%)
Place of birth for the foreign-born population - Nigeria (%)
Place of birth for the foreign-born population - Senegal (%)
Place of birth for the foreign-born population - Sierra Leone (%)
Place of birth for the foreign-born population - Other Western Africa (%)
Place of birth for the foreign-born population - Australia (%)
Place of birth for the foreign-born population - New Zealand (%)
Place of birth for the foreign-born population - Fiji (%)
Place of birth for the foreign-born population - Micronesia (%)
Place of birth for the foreign-born population - Bahamas (%)
Place of birth for the foreign-born population - Barbados (%)
Place of birth for the foreign-born population - Cuba (%)
Place of birth for the foreign-born population - Dominica (%)
Place of birth for the foreign-born population - Dominican Republic (%)
Place of birth for the foreign-born population - Grenada (%)
Place of birth for the foreign-born population - Haiti (%)
Place of birth for the foreign-born population - Jamaica (%)
Place of birth for the foreign-born population - St. Vincent and the Grenadines (%)
Place of birth for the foreign-born population - Trinidad and Tobago (%)
Place of birth for the foreign-born population - West Indies (%)
Place of birth for the foreign-born population - Other Caribbean (%)
Place of birth for the foreign-born population - Belize (%)
Place of birth for the foreign-born population - Costa Rica (%)
Place of birth for the foreign-born population - El Salvador (%)
Place of birth for the foreign-born population - Guatemala (%)
Place of birth for the foreign-born population - Honduras (%)
Place of birth for the foreign-born population - Mexico (%)
Place of birth for the foreign-born population - Nicaragua (%)
Place of birth for the foreign-born population - Panama (%)
Place of birth for the foreign-born population - Other Central America (%)
Place of birth for the foreign-born population - Argentina (%)
Place of birth for the foreign-born population - Bolivia (%)
Place of birth for the foreign-born population - Brazil (%)
Place of birth for the foreign-born population - Chile (%)
Place of birth for the foreign-born population - Colombia (%)
Place of birth for the foreign-born population - Ecuador (%)
Place of birth for the foreign-born population - Guyana (%)
Place of birth for the foreign-born population - Peru (%)
Place of birth for the foreign-born population - Uruguay (%)
Place of birth for the foreign-born population - Venezuela (%)
Place of birth for the foreign-born population - Other South America (%)
Place of birth for the foreign-born population - Canada (%)
Place of birth for the foreign-born population - Other Northern America (%)
Place of birth for the foreign-born population - Other (%)
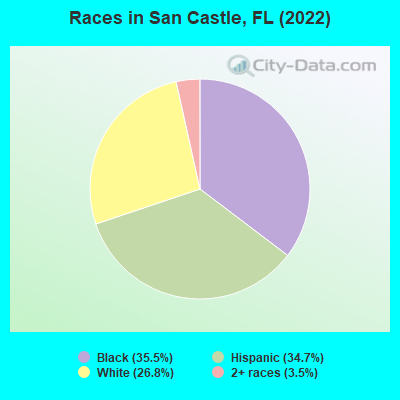
According to 2022 data, the most numerous races in San Castle, FL are White alone (870 residents), Hispanic (1,125 residents), and Black alone (1,152 residents). 56.6% of San Castle residents speak English at home.
Race distribution in San Castle 1,152 35.5% Black alone 1,125 34.7% Hispanic 870 26.8% White alone 114 3.5% Two or more races
2000 2022
10,458,509 65.4% White alone 2,682,715 16.8% Hispanic 2,264,268 14.2% Black alone 261,693 1.6% Asian alone 236,954 1.5% Two or more races 42,358 0.3% American Indian alone 28,994 0.2% Other race alone 6,887 0.04% Native Hawaiian and Other
11,309,403 50.8% White alone 6,025,039 27.1% Hispanic 3,241,015 14.6% Black alone 861,630 3.9% Two or more races 623,692 2.8% Asian alone 152,054 0.7% Other race alone 22,504 0.1% American Indian alone 9,486 0.04% Native Hawaiian and Other
Income and house value in San Castle Median household income in 2022 $54,843 White non-Hispanic householders$85,207 Some other race householders$46,301 Two or more races householders$50,129 Hispanic or Latino race householders
Median age by race in San Castle
39.1 Median age for White residents33.9 61.8 41.1 Median age for Black or African American residents41.2 40.8 17.9 Median age for American Indian / Alaska Native residents21.2 15.3 -679,040,989.3 Median age for Asian residents-707,317,072.5 -674,277,016.1 -674,285,713.6 Median age for Native Hawaiian / Pacific Islander residents-674,264,006.9 -672,397,325.0 31.0 Median age for Other race residents31.0 22.4 33.0 Median age for Two or more races residents32.8 26.1 44.3 Median age for White alone residents32.6 65.9 32.0 Median age for Hispanic or Latino residents31.1 37.8
Owner/renter occupied households by race in San Castle
House owners and renters - White residents 191 52.3% Owner occupied174 47.7% Renter occupiedHouse owners and renters - Black or African American residents 155 50.5% Owner occupied152 49.5% Renter occupiedHouse owners and renters - American Indian / Alaska Native residents 8 100.0% Owner occupiedHouse owners and renters - Other race residents 158 57.7% Owner occupied116 42.3% Renter occupiedHouse owners and renters - Two or more races residents 14 9.7% Owner occupied125 90.3% Renter occupiedHouse owners and renters - White alone residents 188 61.6% Owner occupied117 38.4% Renter occupiedHouse owners and renters - Hispanic or Latino residents 144 36.2% Owner occupied255 63.8% Renter occupied
Language usage in San Castle
English speakers - Total 56.6% of residents of San Castle speak English at home.
26.8% of residents speak Spanish at home 360 43.0% Speak English very well478 57.0% Speak English less than very well17.4% of residents speak other language at home 112 20.6% Speak English very well432 79.4% Speak English less than very well
English speakers - Born in the United States 85.6% of residents of San Castle speak English at home.
14.4% of residents speak Spanish at home 69 74.2% Speak English very well24 25.8% Speak English less than very well
English speakers - Native, born elsewhere 21.7% of residents of San Castle speak English at home.
75.8% of residents speak Spanish at home 89 73.0% Speak English very well33 27.0% Speak English less than very well
English speakers - Foreign-born 19.7% of residents of San Castle speak English at home.
31.3% of residents speak Spanish at home 327 100.0% Speak English less than very well50.3% of residents speak other language at home 95 18.1% Speak English very well431 81.9% Speak English less than very well
White (Caucasian) - Speak only English Native:
86.3% (849)Foreign-born:
20.0% (14)
White (Caucasian) - Speak another language Native:
10.8% (106)Foreign-born:
73.8% (50)
Black or African American - Speak only English Native:
95.3% (459)Foreign-born:
24.7% (164)
Black or African American - Speak another language Native:
4.0% (20)Foreign-born:
75.9% (503)
American Indian / Alaska Native - Speak another language Native:
100.0% (46)Foreign-born:
100.0% (34)
Other race - Speak only English Native:
43.4% (162)Foreign-born:
9.8% (27)
Other race - Speak another language Native:
57.1% (212)Foreign-born:
90.1% (248)
Two or more races - Speak only English Native:
41.2% (156)Foreign-born:
11.1% (11)
Two or more races - Speak another language Native:
60.0% (227)Foreign-born:
88.0% (90)
White alone - Speak only English Native:
100.0% (829)Foreign-born:
38.5% (15)
Hispanic or Latino - Speak only English Native:
28.0% (204)Foreign-born:
4.9% (17)
Hispanic or Latino - Speak another language Native:
71.7% (521)Foreign-born:
95.1% (327)
Foreign-born residents in San Castle
Marital status for residents in San Castle Marital status - White (Caucasian) population 15 years and over
Males 57.7% Never married30.1% Now married0.0% Separated3.3% Widowed8.9% DivorcedFemales 21.3% Never married48.5% Now married0.0% Separated13.2% Widowed17.1% DivorcedWomen who gave birth in the past 12 months Now married:
0.0% (0)Unmarried:
100.0% (16)
Women who did not give birth in the past 12 months Now married:
74.1% (50)Unmarried:
25.9% (17)
Marital status - Black or African American population 15 years and over
Males 34.0% Never married18.2% Now married0.0% Separated15.1% Widowed32.8% DivorcedFemales 68.8% Never married12.4% Now married0.0% Separated8.1% Widowed10.8% DivorcedWomen who did not give birth in the past 12 months Now married:
11.0% (32)Unmarried:
89.0% (259)
Marital status - American Indian / Alaska Native population 15 years and over
Males 47.8% Never married52.2% Now married0.0% Separated0.0% Widowed0.0% DivorcedFemales 52.4% Never married47.6% Now married0.0% Separated0.0% Widowed0.0% DivorcedWomen who did not give birth in the past 12 months Now married:
47.6% (16)Unmarried:
52.4% (18)
Marital status - Other race population 15 years and over
Males 67.8% Never married12.0% Now married3.5% Separated0.0% Widowed16.7% DivorcedFemales 54.5% Never married39.0% Now married0.0% Separated0.0% Widowed6.5% DivorcedWomen who did not give birth in the past 12 months Now married:
28.8% (27)Unmarried:
71.2% (68)
Marital status - Two or more races population 15 years and over
Males 55.0% Never married45.0% Now married0.0% Separated0.0% Widowed0.0% DivorcedFemales 24.2% Never married56.4% Now married0.0% Separated5.5% Widowed13.9% DivorcedWomen who gave birth in the past 12 months Now married:
100.0% (24)Unmarried:
0.0% (0)
Women who did not give birth in the past 12 months Now married:
18.4% (13)Unmarried:
81.6% (56)
Marital status - White alone, not Hispanic / Latino population 15 years and over
Males 57.7% Never married29.3% Now married0.0% Separated2.6% Widowed10.4% DivorcedFemales 10.5% Never married50.7% Now married0.0% Separated12.2% Widowed26.6% DivorcedWomen who did not give birth in the past 12 months Now married:
100.0% (41)Unmarried:
0.0% (0)
Marital status - Hispanic or Latino population 15 years and over
Males 60.0% Never married27.4% Now married1.9% Separated1.5% Widowed9.2% DivorcedFemales 37.0% Never married47.0% Now married0.0% Separated8.0% Widowed8.0% DivorcedWomen who gave birth in the past 12 months Now married:
0.0% (0)Unmarried:
100.0% (20)
Women who did not give birth in the past 12 months Now married:
35.1% (55)Unmarried:
64.9% (101)
Ancestries in San Castle
546 25.2% Haitian255 11.8% African147 6.8% Jamaican76 3.5% Portuguese55 2.5% Italian52 2.4% Polish38 1.8% Irish32 1.5% Finnish28 1.3% English22 1.0% West Indian21 1.0% Bahamian16 0.7% Lithuanian12 0.6% American9 0.4% Ukrainian8 0.4% French8 0.4% German7 0.3% European
Children Nativity (place of birth) in San Castle
Children under 6 years - Living with two parents Both parents native 30 100.0% NativeBoth parents foreign-born 29 100.0% NativeOne native, one foreign-born parent 15 100.0% NativeChildren under 6 years - Living with one parent Native parent 35 100.0% NativeForeign-born parent 37 100.0% NativeChildren 6 to 17 years - Living with two parents Both parents native 25 90.3% Native3 9.7% Foreign-bornBoth parents foreign-born 77 87.8% Native11 12.2% Foreign-bornOne native, one foreign-born parent 89 95.7% Native4 4.3% Foreign-bornChildren 6 to 17 years - Living with one parent Native parent 31 18.2% Native140 81.8% Foreign-bornForeign-born parent 189 85.5% Native32 14.5% Foreign-born
Grandparents responsible for own grandchildren in San Castle
Grandparents (30 to 59 years) White / Caucasian 12 100.0% Not responsible for grandchildrenBlack or African American 30 100.0% Not responsible for grandchildrenOther race 47 100.0% Responsible for grandchildrenTwo or more races 29 100.0% Responsible for grandchildrenWhite alone, not Hispanic / Latino 10 100.0% Not responsible for grandchildrenHispanic or Latino 74 86.0% Responsible for grandchildren12 14.0% Not responsible for grandchildrenGrandparents (60 years and over) White / Caucasian 22 100.0% Not responsible for grandchildrenBlack or African American 9 100.0% Not responsible for grandchildrenTwo or more races 61 83.1% Responsible for grandchildren12 16.9% Not responsible for grandchildrenWhite alone, not Hispanic / Latino 8 100.0% Not responsible for grandchildrenHispanic or Latino 56 57.9% Responsible for grandchildren40 42.1% Not responsible for grandchildren