Races in Salunga-Landisville, Pennsylvania (PA) Detailed Stats
Ancestries, Foreign-born residents, place of birth

Recent posts about races in Salunga-Landisville, Pennsylvania on our local forum with over 2,400,000 registered users:
 | Earthquake in the Lancaster, PA area (7 replies) |
3.7% of Salunga-Landisville, PA residents are foreign-born (2.1% born in Asia, 0.9% born in Europe, 0.6% born in Latin America), which is 90.8% less than the foreign-born rate of 7.0% across the entire state of Pennsylvania.
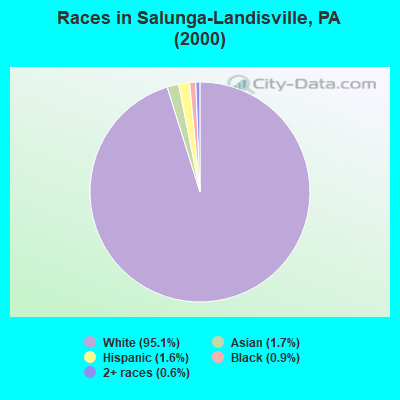
Race distribution in Salunga-Landisville

- 4,53695.1%White alone
- 821.7%Asian alone
- 781.6%Hispanic
- 440.9%Black alone
- 300.6%Two or more races
- 10.02%Other race alone
2000
2022
-
- 10,322,45584.1%White alone
- 1,202,4379.8%Black alone
- 394,0883.2%Hispanic
- 218,2961.8%Asian alone
- 113,0970.9%Two or more races
- 13,0860.1%Other race alone
- 14,9040.1%American Indian alone
- 2,6910.02%Native Hawaiian and Other
Pacific Islander alone

-
- 9,487,22873.1%White alone
- 1,311,58110.1%Black alone
- 1,115,9978.6%Hispanic
- 493,9423.8%Two or more races
- 487,1243.8%Asian alone
- 63,5820.5%Other race alone
- 10,1300.08%American Indian alone
- 2,4240.02%Native Hawaiian and Other
Pacific Islander alone

Income and house value in Salunga-Landisville
- Median household income in 2022
- $103,180White non-Hispanic householders
- $23,466Black householders
- $148,624Asian householders
- $165,802Some other race householders
- $102,479Two or more races householders
- $137,306Hispanic or Latino race householders
- Median 2022 house value
- $328,956White Non-Hispanic householders
- $225,778Asian householders
- $303,465Some other race householders
- $515,891Two or more races householders
- $303,465Hispanic or Latino householders
Household income for White non-Hispanic householders

Household income for Black householders

Household income for Asian householders

Household income for Two or more races householders

Household income for Hispanic or Latino race householders

Foreign-born residents in Salunga-Landisville
175 residents are foreign born (2.1% Asia, 0.9% Europe, 0.6% Latin America).
| This city: | 3.7% |
| Pennsylvania: | 4.1% |
Ancestries in Salunga-Landisville

- 2,05837.0%German
- 62111.2%Irish
- 5449.8%English
- 4277.7%Other
- 3696.6%Italian
- 3446.2%United States
- 1582.8%Scotch-Irish
- 1442.6%French
- 1402.5%Polish
- 1392.5%Dutch
- 1051.9%Swiss
- 821.5%Scottish
- 821.5%Welsh
- 801.4%Swedish
- 541.0%Norwegian
- 490.9%Hungarian
- 450.8%Russian
- 310.6%Czech
- 240.4%Greek
- 220.4%Lithuanian
- 160.3%Ukrainian
- 120.2%Slovak
- 100.2%Portuguese
- 60.1%French Canadian
- 50.09%Danish

Zip codes: 17538.