Races in Sale Creek, Tennessee (TN) Detailed Stats
Ancestries, Foreign-born residents, place of birth

Data:
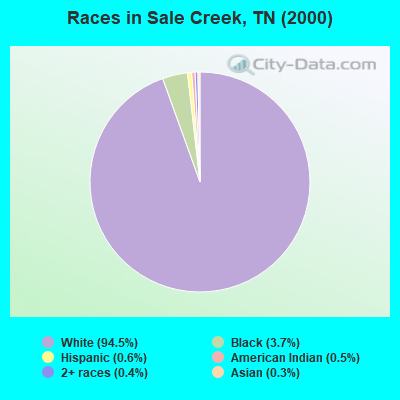
Race distribution in Sale Creek

- 5,84494.5%White alone
- 2303.7%Black alone
- 380.6%Hispanic
- 290.5%American Indian alone
- 250.4%Two or more races
- 190.3%Asian alone
- 10.02%Other race alone
2000
2022
-
- 4,505,93079.2%White alone
- 928,20416.3%Black alone
- 123,8382.2%Hispanic
- 54,8241.0%Two or more races
- 56,0771.0%Asian alone
- 13,8200.2%American Indian alone
- 4,7800.08%Other race alone
- 1,8100.03%Native Hawaiian and Other
Pacific Islander alone
-
- 5,070,02671.9%White alone
- 1,089,73815.5%Black alone
- 442,6296.3%Hispanic
- 279,3814.0%Two or more races
- 131,8171.9%Asian alone
- 26,9720.4%Other race alone
- 6,3870.09%American Indian alone
- 4,3890.06%Native Hawaiian and Other
Pacific Islander alone
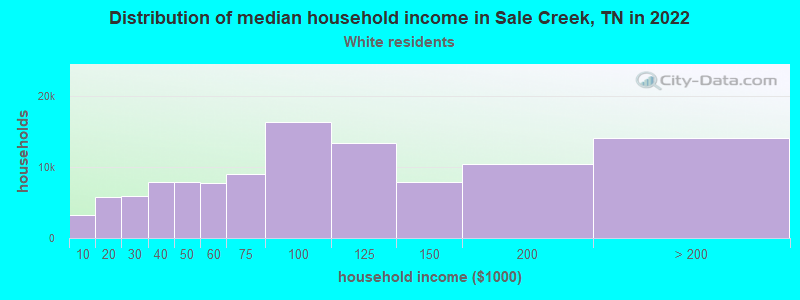
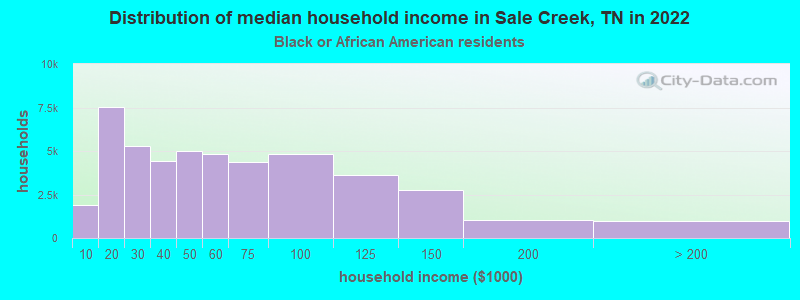
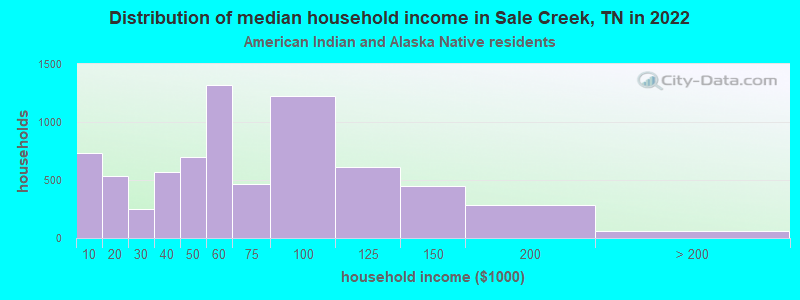
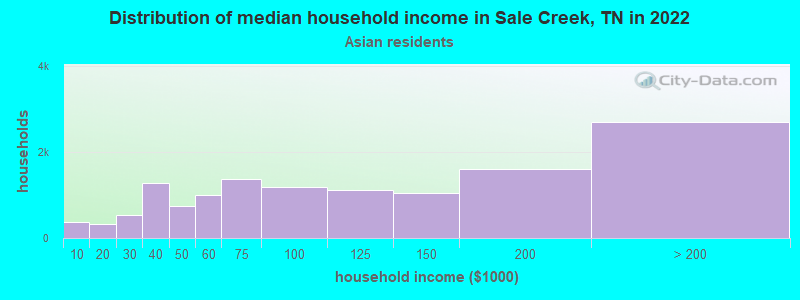
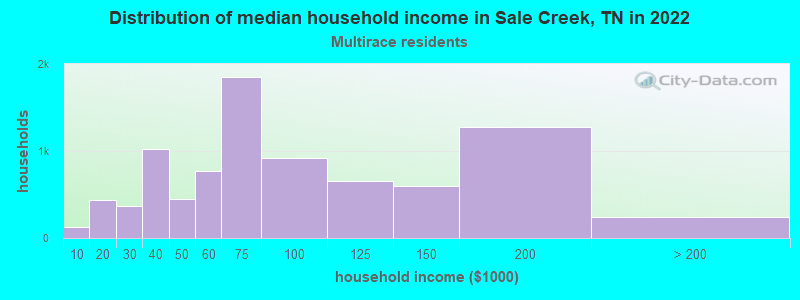
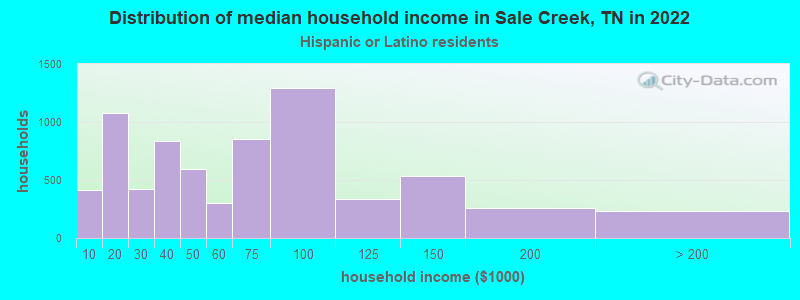
Income and house value in Sale Creek
- Median household income in 2022
- $83,113White non-Hispanic householders
- $85,139Black householders
- $81,847American Indian and Alaska Native householders
- $35,180Asian householders
- $81,794Some other race householders
- $84,094Two or more races householders
- $59,850Hispanic or Latino race householders
- Median 2022 house value
- $320,707White Non-Hispanic householders
- $211,634Black or African American householders
- $232,146Asian householders
- $447,688Some other race householders
- $211,634Two or more races householders
- $224,006Hispanic or Latino householders