Races in Rushford, Minnesota (MN) Detailed Stats
Data:
Races - White alone (%)
Races - White alone (% change since 2000)
Races - Black alone (%)
Races - Black alone (% change since 2000)
Races - American Indian alone (%)
Races - American Indian alone (% change since 2000)
Races - Asian alone (%)
Races - Asian alone (% change since 2000)
Races - Hispanic (%)
Races - Hispanic (% change since 2000)
Races - Native Hawaiian and Other Pacific Islander alone (%)
Races - Native Hawaiian and Other Pacific Islander alone (% change since 2000)
Races - Two or more races(%)
Races - Two or more races(% change since 2000)
Races - Other race alone (%)
Races - Other race alone (% change since 2000)
Racial diversity
Place of birth - Born in state of residence (%)
Place of birth - Born in state of residence (%) - White
Place of birth - Born in state of residence (%) - Black or African American
Place of birth - Born in state of residence (%) - Asian
Place of birth - Born in state of residence (%) - Hispanic or Latino
Place of birth - Born in state of residence (%) - American Indian and Alaska Native
Place of birth - Born in state of residence (%) - Multirace
Place of birth - Born in state of residence (%) - Other Race
Place of birth - Born in other state (%)
Place of birth - Born in other state (%) - White
Place of birth - Born in other state (%) - Black or African American
Place of birth - Born in other state (%) - Asian
Place of birth - Born in other state (%) - Hispanic or Latino
Place of birth - Born in other state (%) - American Indian and Alaska Native
Place of birth - Born in other state (%) - Multirace
Place of birth - Born in other state (%) - Other Race
Place of birth - Native, outside of US (%)
Place of birth - Native, outside of US (%) - White
Place of birth - Native, outside of US (%) - Black or African American
Place of birth - Native, outside of US (%) - Asian
Place of birth - Native, outside of US (%) - Hispanic or Latino
Place of birth - Native, outside of US (%) - American Indian and Alaska Native
Place of birth - Native, outside of US (%) - Multirace
Place of birth - Native, outside of US (%) - Other Race
Place of birth - Foreign born (%)
Place of birth - Foreign born (%) - White
Place of birth - Foreign born (%) - Black or African American
Place of birth - Foreign born (%) - Asian
Place of birth - Foreign born (%) - Hispanic or Latino
Place of birth - Foreign born (%) - American Indian and Alaska Native
Place of birth - Foreign born (%) - Multirace
Place of birth - Foreign born (%) - Other Race
Residents speaking English at home (%)
Residents speaking English at home - Born in the United States (%)
Residents speaking English at home - Native, born elsewhere (%)
Residents speaking English at home - Foreign born (%)
Residents speaking Spanish at home (%)
Residents speaking Spanish at home - Born in the United States (%)
Residents speaking Spanish at home - Native, born elsewhere (%)
Residents speaking Spanish at home - Foreign born (%)
Residents speaking other language at home (%)
Residents speaking other language at home - Born in the United States (%)
Residents speaking other language at home - Native, born elsewhere (%)
Residents speaking other language at home - Foreign born (%)
Marital status - Never married (%)
Marital status - Now married (%)
Marital status - Separated (%)
Marital status - Widowed (%)
Marital status - Divorced (%)
Ancestries Reported - Arab (%)
Ancestries Reported - Czech (%)
Ancestries Reported - Danish (%)
Ancestries Reported - Dutch (%)
Ancestries Reported - English (%)
Ancestries Reported - French (%)
Ancestries Reported - French Canadian (%)
Ancestries Reported - German (%)
Ancestries Reported - Greek (%)
Ancestries Reported - Hungarian (%)
Ancestries Reported - Irish (%)
Ancestries Reported - Italian (%)
Ancestries Reported - Lithuanian (%)
Ancestries Reported - Norwegian (%)
Ancestries Reported - Polish (%)
Ancestries Reported - Portuguese (%)
Ancestries Reported - Russian (%)
Ancestries Reported - Scotch-Irish (%)
Ancestries Reported - Scottish (%)
Ancestries Reported - Slovak (%)
Ancestries Reported - Subsaharan African (%)
Ancestries Reported - Swedish (%)
Ancestries Reported - Swiss (%)
Ancestries Reported - Ukrainian (%)
Ancestries Reported - United States (%)
Ancestries Reported - Welsh (%)
Ancestries Reported - West Indian (%)
Ancestries Reported - Other (%)
Geographical mobility - Same house 1 year ago (%)
Geographical mobility - Same house 1 year ago (%) - White
Geographical mobility - Same house 1 year ago (%) - Black or African American
Geographical mobility - Same house 1 year ago (%) - Asian
Geographical mobility - Same house 1 year ago (%) - Hispanic or Latino
Geographical mobility - Same house 1 year ago (%) - American Indian and Alaska Native
Geographical mobility - Same house 1 year ago (%) - Multirace
Geographical mobility - Same house 1 year ago (%) - Other Race
Geographical mobility - Moved within same county (%)
Geographical mobility - Moved within same county (%) - White
Geographical mobility - Moved within same county (%) - Black or African American
Geographical mobility - Moved within same county (%) - Asian
Geographical mobility - Moved within same county (%) - Hispanic or Latino
Geographical mobility - Moved within same county (%) - American Indian and Alaska Native
Geographical mobility - Moved within same county (%) - Multirace
Geographical mobility - Moved within same county (%) - Other Race
Geographical mobility - Moved from different county within same state (%)
Geographical mobility - Moved from different county within same state (%) - White
Geographical mobility - Moved from different county within same state (%) - Black or African American
Geographical mobility - Moved from different county within same state (%) - Asian
Geographical mobility - Moved from different county within same state (%) - Hispanic or Latino
Geographical mobility - Moved from different county within same state (%) - American Indian and Alaska Native
Geographical mobility - Moved from different county within same state (%) - Multirace
Geographical mobility - Moved from different county within same state (%) - Other Race
Geographical mobility - Moved from different state (%)
Geographical mobility - Moved from different state (%) - White
Geographical mobility - Moved from different state (%) - Black or African American
Geographical mobility - Moved from different state (%) - Asian
Geographical mobility - Moved from different state (%) - Hispanic or Latino
Geographical mobility - Moved from different state (%) - American Indian and Alaska Native
Geographical mobility - Moved from different state (%) - Multirace
Geographical mobility - Moved from different state (%) - Other Race
Geographical mobility - Moved from abroad (%)
Geographical mobility - Moved from abroad (%) - White
Geographical mobility - Moved from abroad (%) - Black or African American
Geographical mobility - Moved from abroad (%) - Asian
Geographical mobility - Moved from abroad (%) - Hispanic or Latino
Geographical mobility - Moved from abroad (%) - American Indian and Alaska Native
Geographical mobility - Moved from abroad (%) - Multirace
Geographical mobility - Moved from abroad (%) - Other Race
Place of birth for the foreign-born population - Ireland (%)
Place of birth for the foreign-born population - Denmark (%)
Place of birth for the foreign-born population - Norway (%)
Place of birth for the foreign-born population - Sweden (%)
Place of birth for the foreign-born population - United Kingdom (%)
Place of birth for the foreign-born population - England (%)
Place of birth for the foreign-born population - Scotland (%)
Place of birth for the foreign-born population - Other Northern Europe (%)
Place of birth for the foreign-born population - Austria (%)
Place of birth for the foreign-born population - Belgium (%)
Place of birth for the foreign-born population - France (%)
Place of birth for the foreign-born population - Germany (%)
Place of birth for the foreign-born population - Netherlands (%)
Place of birth for the foreign-born population - Switzerland (%)
Place of birth for the foreign-born population - Other Western Europe (%)
Place of birth for the foreign-born population - Greece (%)
Place of birth for the foreign-born population - Italy (%)
Place of birth for the foreign-born population - Portugal (%)
Place of birth for the foreign-born population - Spain (%)
Place of birth for the foreign-born population - Other Southern Europe (%)
Place of birth for the foreign-born population - Albania (%)
Place of birth for the foreign-born population - Belarus (%)
Place of birth for the foreign-born population - Bosnia and Herzegovina (%)
Place of birth for the foreign-born population - Bulgaria (%)
Place of birth for the foreign-born population - Croatia (%)
Place of birth for the foreign-born population - Czechoslovakia (%)
Place of birth for the foreign-born population - Hungary (%)
Place of birth for the foreign-born population - Latvia (%)
Place of birth for the foreign-born population - Lithuania (%)
Place of birth for the foreign-born population - North Macedonia (Macedonia) (%)
Place of birth for the foreign-born population - Moldova (%)
Place of birth for the foreign-born population - Poland (%)
Place of birth for the foreign-born population - Romania (%)
Place of birth for the foreign-born population - Russia (%)
Place of birth for the foreign-born population - Serbia (%)
Place of birth for the foreign-born population - Ukraine (%)
Place of birth for the foreign-born population - Other Eastern Europe (%)
Place of birth for the foreign-born population - China (%)
Place of birth for the foreign-born population - Hong Kong (%)
Place of birth for the foreign-born population - Taiwan (%)
Place of birth for the foreign-born population - Japan (%)
Place of birth for the foreign-born population - Korea (%)
Place of birth for the foreign-born population - Other Eastern Asia (%)
Place of birth for the foreign-born population - Afghanistan (%)
Place of birth for the foreign-born population - Bangladesh (%)
Place of birth for the foreign-born population - India (%)
Place of birth for the foreign-born population - Iran (%)
Place of birth for the foreign-born population - Kazakhstan (%)
Place of birth for the foreign-born population - Nepal (%)
Place of birth for the foreign-born population - Pakistan (%)
Place of birth for the foreign-born population - Sri Lanka (%)
Place of birth for the foreign-born population - Uzbekistan (%)
Place of birth for the foreign-born population - Other South Central Asia (%)
Place of birth for the foreign-born population - Burma (%)
Place of birth for the foreign-born population - Cambodia (%)
Place of birth for the foreign-born population - Indonesia (%)
Place of birth for the foreign-born population - Laos (%)
Place of birth for the foreign-born population - Malaysia (%)
Place of birth for the foreign-born population - Philippines (%)
Place of birth for the foreign-born population - Singapore (%)
Place of birth for the foreign-born population - Thailand (%)
Place of birth for the foreign-born population - Vietnam (%)
Place of birth for the foreign-born population - Other South Eastern Asia (%)
Place of birth for the foreign-born population - Armenia (%)
Place of birth for the foreign-born population - Iraq (%)
Place of birth for the foreign-born population - Israel (%)
Place of birth for the foreign-born population - Jordan (%)
Place of birth for the foreign-born population - Kuwait (%)
Place of birth for the foreign-born population - Lebanon (%)
Place of birth for the foreign-born population - Saudi Arabia (%)
Place of birth for the foreign-born population - Syria (%)
Place of birth for the foreign-born population - Turkey (%)
Place of birth for the foreign-born population - Yemen (%)
Place of birth for the foreign-born population - Other Western Asia (%)
Place of birth for the foreign-born population - Eritrea (%)
Place of birth for the foreign-born population - Ethiopia (%)
Place of birth for the foreign-born population - Kenya (%)
Place of birth for the foreign-born population - Somalia (%)
Place of birth for the foreign-born population - Uganda (%)
Place of birth for the foreign-born population - Zimbabwe (%)
Place of birth for the foreign-born population - Other Eastern Africa (%)
Place of birth for the foreign-born population - Cameroon (%)
Place of birth for the foreign-born population - Congo (%)
Place of birth for the foreign-born population - Democratic Republic of Congo (Zaire) (%)
Place of birth for the foreign-born population - Other Middle Africa (%)
Place of birth for the foreign-born population - Egypt (%)
Place of birth for the foreign-born population - Morocco (%)
Place of birth for the foreign-born population - Sudan (%)
Place of birth for the foreign-born population - Other Northern Africa (%)
Place of birth for the foreign-born population - South Africa (%)
Place of birth for the foreign-born population - Other Southern Africa (%)
Place of birth for the foreign-born population - Cabo Verde (%)
Place of birth for the foreign-born population - Ghana (%)
Place of birth for the foreign-born population - Liberia (%)
Place of birth for the foreign-born population - Nigeria (%)
Place of birth for the foreign-born population - Senegal (%)
Place of birth for the foreign-born population - Sierra Leone (%)
Place of birth for the foreign-born population - Other Western Africa (%)
Place of birth for the foreign-born population - Australia (%)
Place of birth for the foreign-born population - New Zealand (%)
Place of birth for the foreign-born population - Fiji (%)
Place of birth for the foreign-born population - Micronesia (%)
Place of birth for the foreign-born population - Bahamas (%)
Place of birth for the foreign-born population - Barbados (%)
Place of birth for the foreign-born population - Cuba (%)
Place of birth for the foreign-born population - Dominica (%)
Place of birth for the foreign-born population - Dominican Republic (%)
Place of birth for the foreign-born population - Grenada (%)
Place of birth for the foreign-born population - Haiti (%)
Place of birth for the foreign-born population - Jamaica (%)
Place of birth for the foreign-born population - St. Vincent and the Grenadines (%)
Place of birth for the foreign-born population - Trinidad and Tobago (%)
Place of birth for the foreign-born population - West Indies (%)
Place of birth for the foreign-born population - Other Caribbean (%)
Place of birth for the foreign-born population - Belize (%)
Place of birth for the foreign-born population - Costa Rica (%)
Place of birth for the foreign-born population - El Salvador (%)
Place of birth for the foreign-born population - Guatemala (%)
Place of birth for the foreign-born population - Honduras (%)
Place of birth for the foreign-born population - Mexico (%)
Place of birth for the foreign-born population - Nicaragua (%)
Place of birth for the foreign-born population - Panama (%)
Place of birth for the foreign-born population - Other Central America (%)
Place of birth for the foreign-born population - Argentina (%)
Place of birth for the foreign-born population - Bolivia (%)
Place of birth for the foreign-born population - Brazil (%)
Place of birth for the foreign-born population - Chile (%)
Place of birth for the foreign-born population - Colombia (%)
Place of birth for the foreign-born population - Ecuador (%)
Place of birth for the foreign-born population - Guyana (%)
Place of birth for the foreign-born population - Peru (%)
Place of birth for the foreign-born population - Uruguay (%)
Place of birth for the foreign-born population - Venezuela (%)
Place of birth for the foreign-born population - Other South America (%)
Place of birth for the foreign-born population - Canada (%)
Place of birth for the foreign-born population - Other Northern America (%)
Place of birth for the foreign-born population - Other (%)
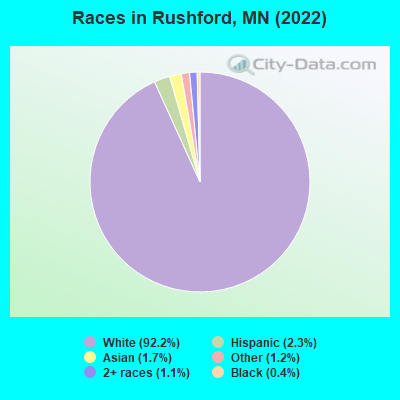
According to 2022 data, the most numerous races in Rushford, MN are White alone (1,680 residents), Black alone (7 residents), and Hispanic (41 residents). 95.0% of Rushford residents speak English at home. 3.8% of Rushford, MN residents are foreign-born (1.8% born in Asia, 1.7% born in Latin America), which is 111.4% less than the foreign-born rate of 8.0% across the entire state of Minnesota.
Race distribution in Rushford
2000 2022
4,337,143 88.2% White alone 168,813 3.4% Black alone 143,382 2.9% Hispanic 141,083 2.9% Asian alone 70,304 1.4% Two or more races 52,009 1.1% American Indian alone 5,031 0.1% Other race alone 1,714 0.03% Native Hawaiian and Other
4,356,347 76.2% White alone 395,179 6.9% Black alone 333,830 5.8% Hispanic 294,800 5.2% Asian alone 259,649 4.5% Two or more races 42,125 0.7% American Indian alone 32,976 0.6% Other race alone 2,278 0.04% Native Hawaiian and Other
Income and house value in Rushford Median household income in 2022 $73,316 White non-Hispanic householders$65,202 Asian householdersMedian 2022 house value $219,719 White Non-Hispanic householders$457,162 Two or more races householders
Median age by race in Rushford
43.0 Median age for White residents37.2 49.9 16.7 Median age for Black or African American residents-678,403,755.2 16.7 -673,400,672.7 Median age for American Indian / Alaska Native residents-666,666,666.0 -677,852,348.3 36.1 Median age for Asian residents42.8 -687,499,999.3 -744,336,568.8 Median age for Native Hawaiian / Pacific Islander residents-856,799,036.4 -534,959,349.1 47.8 Median age for Other race residents25.4 -669,099,756.0 19.4 Median age for Two or more races residents-713,101,160.1 20.2 43.3 Median age for White alone residents37.8 49.5 29.0 Median age for Hispanic or Latino residents7.6 -696,117,803.9
Owner/renter occupied households by race in Rushford
House owners and renters - White residents 531 76.5% Owner occupied163 23.5% Renter occupiedHouse owners and renters - Black or African American residents 2 100.0% Renter occupiedHouse owners and renters - Asian residents 4 17.4% Owner occupied21 82.6% Renter occupiedHouse owners and renters - Other race residents 4 50.1% Owner occupied4 49.9% Renter occupiedHouse owners and renters - Two or more races residents 3 100.0% Renter occupiedHouse owners and renters - White alone residents 534 77.8% Owner occupied152 22.2% Renter occupiedHouse owners and renters - Hispanic or Latino residents 15 100.0% Renter occupied
Language usage in Rushford
English speakers - Total 95.0% of residents of Rushford speak English at home.
2.0% of residents speak Spanish at home 2 6.1% Speak English very well31 93.9% Speak English less than very well2.9% of residents speak other language at home 37 75.5% Speak English very well12 24.5% Speak English less than very well
English speakers - Born in the United States 96.6% of residents of Rushford speak English at home.
0.7% of residents speak Spanish at home 4 100.0% Speak English less than very well2.5% of residents speak other language at home 14 100.0% Speak English very well
All residents speak only English at home
English speakers - Foreign-born 9.5% of residents of Rushford speak English at home.
41.3% of residents speak Spanish at home 26 100.0% Speak English less than very well47.6% of residents speak other language at home 18 60.0% Speak English very well12 40.0% Speak English less than very well
White (Caucasian) - Speak only English Native:
98.9% (1,520)Foreign-born:
9.5% (2)
White (Caucasian) - Speak another language Native:
1.2% (19)Foreign-born:
80.7% (16)
Black or African American - Speak another language Native:
78.3% (2)Foreign-born:
100.0% (4)
White alone - Speak only English Native:
98.9% (1,525)Foreign-born:
100.0% (2)
Hispanic or Latino - Speak another language Native:
95.1% (4)Foreign-born:
96.9% (25)
Foreign-born residents in Rushford 69 residents are foreign born (1.8% Asia , 1.7% Latin America ).
This city:
3.8%Minnesota:
8.5%
Marital status for residents in Rushford Marital status - White (Caucasian) population 15 years and over
Males 26.6% Never married65.0% Now married0.5% Separated2.0% Widowed6.0% DivorcedFemales 20.3% Never married51.5% Now married0.0% Separated15.5% Widowed12.6% DivorcedWomen who gave birth in the past 12 months Now married:
100.0% (22)Unmarried:
0.0% (0)
Women who did not give birth in the past 12 months Now married:
53.0% (168)Unmarried:
47.0% (149)
Marital status - Black or African American population 15 years and over
Males 100.0% Never married0.0% Now married0.0% Separated0.0% Widowed0.0% DivorcedFemales 50.0% Never married0.0% Now married0.0% Separated0.0% Widowed50.0% DivorcedWomen who did not give birth in the past 12 months Now married:
0.0% (0)Unmarried:
100.0% (4)
Marital status - Asian population 15 years and over
Males 60.0% Never married40.0% Now married0.0% Separated0.0% Widowed0.0% DivorcedFemales 80.0% Never married20.0% Now married0.0% Separated0.0% Widowed0.0% DivorcedWomen who did not give birth in the past 12 months Now married:
20.0% (4)Unmarried:
80.0% (16)
Marital status - Other race population 15 years and over
Males 50.0% Never married50.0% Now married0.0% Separated0.0% Widowed0.0% DivorcedFemales 50.0% Never married50.0% Now married0.0% Separated0.0% Widowed0.0% DivorcedWomen who did not give birth in the past 12 months Now married:
0.0% (0)Unmarried:
100.0% (4)
Marital status - Two or more races population 15 years and over
Males 0.0% Never married100.0% Now married0.0% Separated0.0% Widowed0.0% DivorcedFemales 77.8% Never married0.0% Now married0.0% Separated0.0% Widowed22.2% DivorcedWomen who did not give birth in the past 12 months Now married:
0.0% (0)Unmarried:
100.0% (12)
Marital status - White alone, not Hispanic / Latino population 15 years and over
Males 27.2% Never married64.2% Now married0.5% Separated2.0% Widowed6.1% DivorcedFemales 20.6% Never married50.9% Now married0.0% Separated15.8% Widowed12.8% DivorcedWomen who gave birth in the past 12 months Now married:
100.0% (23)Unmarried:
0.0% (0)
Women who did not give birth in the past 12 months Now married:
52.2% (165)Unmarried:
47.8% (151)
Marital status - Hispanic or Latino population 15 years and over
Males 0.0% Never married100.0% Now married0.0% Separated0.0% Widowed0.0% DivorcedFemales 0.0% Never married100.0% Now married0.0% Separated0.0% Widowed0.0% DivorcedWomen who did not give birth in the past 12 months Now married:
100.0% (6)Unmarried:
0.0% (0)
Ancestries in Rushford
346 35.9% Norwegian216 22.4% American203 21.0% German29 3.0% Scandinavian25 2.6% Polish23 2.4% Irish14 1.5% English8 0.8% Dutch7 0.7% European6 0.6% Sudanese6 0.6% Swedish4 0.4% Czech
Children Nativity (place of birth) in Rushford
Children under 6 years - Living with two parents Both parents native 146 99.8% Native0 0.2% Foreign-bornBoth parents foreign-born 6 49.6% Native6 50.4% Foreign-bornOne native, one foreign-born parent 4 100.0% NativeChildren under 6 years - Living with one parent Native parent 10 100.0% NativeChildren 6 to 17 years - Living with two parents Both parents native 205 100.0% NativeBoth parents foreign-born 8 100.0% Foreign-bornOne native, one foreign-born parent 4 100.0% NativeChildren 6 to 17 years - Living with one parent Native parent 44 99.6% Native0 0.4% Foreign-bornForeign-born parent 4 67.1% Native2 32.9% Foreign-born
Place of birth for residents in Rushford 33 Asia32 Americas32 Latin America32 Central America26 South Eastern Asia6 Eastern Asia4 Africa4 Northern Africa
Grandparents responsible for own grandchildren in Rushford
Grandparents (30 to 59 years) White / Caucasian 2 100.0% Not responsible for grandchildrenOther race 4 100.0% Responsible for grandchildrenWhite alone, not Hispanic / Latino 2 100.0% Not responsible for grandchildrenGrandparents (60 years and over) White / Caucasian 2 31.7% Responsible for grandchildren4 68.3% Not responsible for grandchildrenWhite alone, not Hispanic / Latino 2 31.9% Responsible for grandchildren4 68.1% Not responsible for grandchildren