Races in Roseville, Michigan (MI) Detailed Stats
Data:
Races - White alone (%)
Races - White alone (% change since 2000)
Races - Black alone (%)
Races - Black alone (% change since 2000)
Races - American Indian alone (%)
Races - American Indian alone (% change since 2000)
Races - Asian alone (%)
Races - Asian alone (% change since 2000)
Races - Hispanic (%)
Races - Hispanic (% change since 2000)
Races - Native Hawaiian and Other Pacific Islander alone (%)
Races - Native Hawaiian and Other Pacific Islander alone (% change since 2000)
Races - Two or more races(%)
Races - Two or more races(% change since 2000)
Races - Other race alone (%)
Races - Other race alone (% change since 2000)
Racial diversity
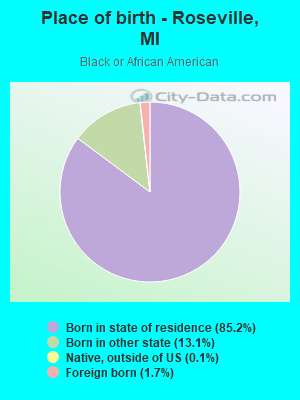
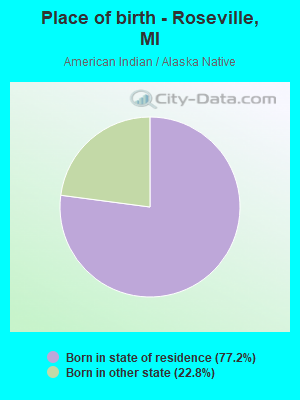
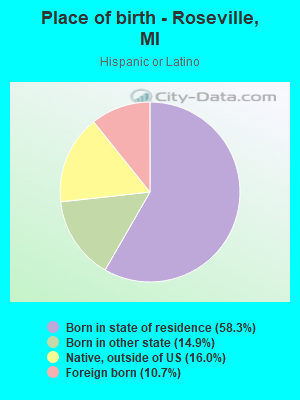
Place of birth - Born in state of residence (%)
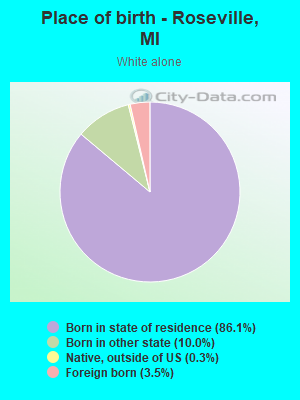
Place of birth - Born in state of residence (%) - White
Place of birth - Born in state of residence (%) - Black or African American
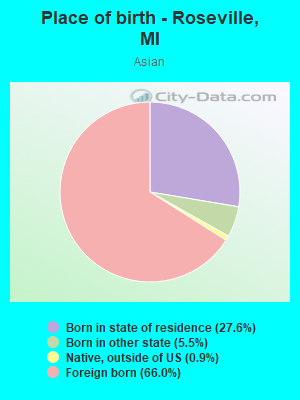
Place of birth - Born in state of residence (%) - Asian
Place of birth - Born in state of residence (%) - Hispanic or Latino
Place of birth - Born in state of residence (%) - American Indian and Alaska Native
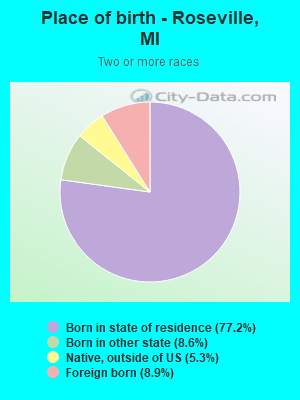
Place of birth - Born in state of residence (%) - Multirace
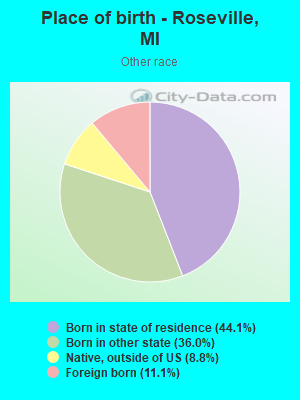
Place of birth - Born in state of residence (%) - Other Race
Place of birth - Born in other state (%)
Place of birth - Born in other state (%) - White
Place of birth - Born in other state (%) - Black or African American
Place of birth - Born in other state (%) - Asian
Place of birth - Born in other state (%) - Hispanic or Latino
Place of birth - Born in other state (%) - American Indian and Alaska Native
Place of birth - Born in other state (%) - Multirace
Place of birth - Born in other state (%) - Other Race
Place of birth - Native, outside of US (%)
Place of birth - Native, outside of US (%) - White
Place of birth - Native, outside of US (%) - Black or African American
Place of birth - Native, outside of US (%) - Asian
Place of birth - Native, outside of US (%) - Hispanic or Latino
Place of birth - Native, outside of US (%) - American Indian and Alaska Native
Place of birth - Native, outside of US (%) - Multirace
Place of birth - Native, outside of US (%) - Other Race
Place of birth - Foreign born (%)
Place of birth - Foreign born (%) - White
Place of birth - Foreign born (%) - Black or African American
Place of birth - Foreign born (%) - Asian
Place of birth - Foreign born (%) - Hispanic or Latino
Place of birth - Foreign born (%) - American Indian and Alaska Native
Place of birth - Foreign born (%) - Multirace
Place of birth - Foreign born (%) - Other Race
Residents speaking English at home (%)
Residents speaking English at home - Born in the United States (%)
Residents speaking English at home - Native, born elsewhere (%)
Residents speaking English at home - Foreign born (%)
Residents speaking Spanish at home (%)
Residents speaking Spanish at home - Born in the United States (%)
Residents speaking Spanish at home - Native, born elsewhere (%)
Residents speaking Spanish at home - Foreign born (%)
Residents speaking other language at home (%)
Residents speaking other language at home - Born in the United States (%)
Residents speaking other language at home - Native, born elsewhere (%)
Residents speaking other language at home - Foreign born (%)
Marital status - Never married (%)
Marital status - Now married (%)
Marital status - Separated (%)
Marital status - Widowed (%)
Marital status - Divorced (%)
Ancestries Reported - Arab (%)
Ancestries Reported - Czech (%)
Ancestries Reported - Danish (%)
Ancestries Reported - Dutch (%)
Ancestries Reported - English (%)
Ancestries Reported - French (%)
Ancestries Reported - French Canadian (%)
Ancestries Reported - German (%)
Ancestries Reported - Greek (%)
Ancestries Reported - Hungarian (%)
Ancestries Reported - Irish (%)
Ancestries Reported - Italian (%)
Ancestries Reported - Lithuanian (%)
Ancestries Reported - Norwegian (%)
Ancestries Reported - Polish (%)
Ancestries Reported - Portuguese (%)
Ancestries Reported - Russian (%)
Ancestries Reported - Scotch-Irish (%)
Ancestries Reported - Scottish (%)
Ancestries Reported - Slovak (%)
Ancestries Reported - Subsaharan African (%)
Ancestries Reported - Swedish (%)
Ancestries Reported - Swiss (%)
Ancestries Reported - Ukrainian (%)
Ancestries Reported - United States (%)
Ancestries Reported - Welsh (%)
Ancestries Reported - West Indian (%)
Ancestries Reported - Other (%)
Geographical mobility - Same house 1 year ago (%)
Geographical mobility - Same house 1 year ago (%) - White
Geographical mobility - Same house 1 year ago (%) - Black or African American
Geographical mobility - Same house 1 year ago (%) - Asian
Geographical mobility - Same house 1 year ago (%) - Hispanic or Latino
Geographical mobility - Same house 1 year ago (%) - American Indian and Alaska Native
Geographical mobility - Same house 1 year ago (%) - Multirace
Geographical mobility - Same house 1 year ago (%) - Other Race
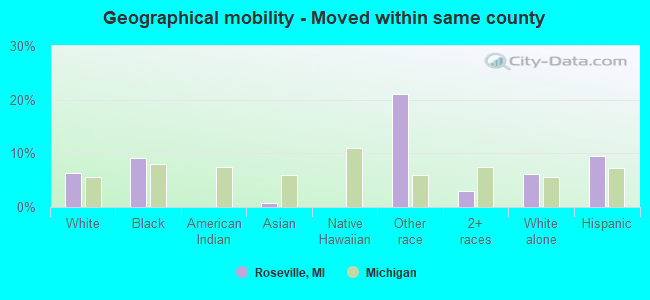
Geographical mobility - Moved within same county (%)
Geographical mobility - Moved within same county (%) - White
Geographical mobility - Moved within same county (%) - Black or African American
Geographical mobility - Moved within same county (%) - Asian
Geographical mobility - Moved within same county (%) - Hispanic or Latino
Geographical mobility - Moved within same county (%) - American Indian and Alaska Native
Geographical mobility - Moved within same county (%) - Multirace
Geographical mobility - Moved within same county (%) - Other Race
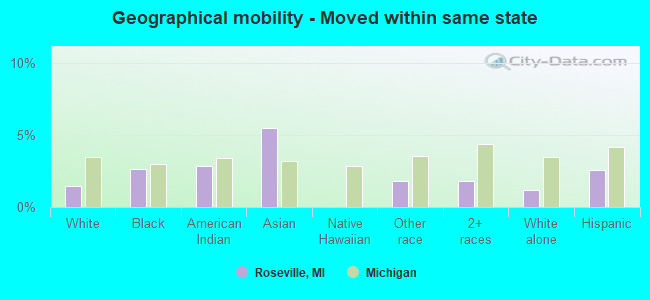
Geographical mobility - Moved from different county within same state (%)
Geographical mobility - Moved from different county within same state (%) - White
Geographical mobility - Moved from different county within same state (%) - Black or African American
Geographical mobility - Moved from different county within same state (%) - Asian
Geographical mobility - Moved from different county within same state (%) - Hispanic or Latino
Geographical mobility - Moved from different county within same state (%) - American Indian and Alaska Native
Geographical mobility - Moved from different county within same state (%) - Multirace
Geographical mobility - Moved from different county within same state (%) - Other Race
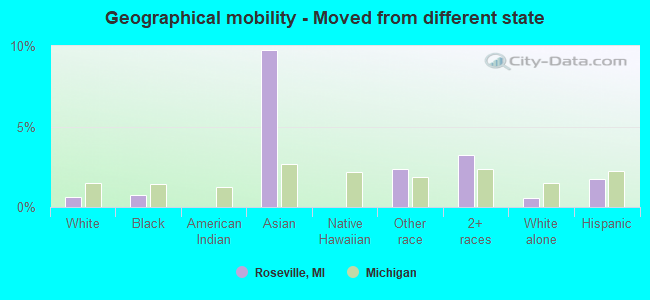
Geographical mobility - Moved from different state (%)
Geographical mobility - Moved from different state (%) - White
Geographical mobility - Moved from different state (%) - Black or African American
Geographical mobility - Moved from different state (%) - Asian
Geographical mobility - Moved from different state (%) - Hispanic or Latino
Geographical mobility - Moved from different state (%) - American Indian and Alaska Native
Geographical mobility - Moved from different state (%) - Multirace
Geographical mobility - Moved from different state (%) - Other Race
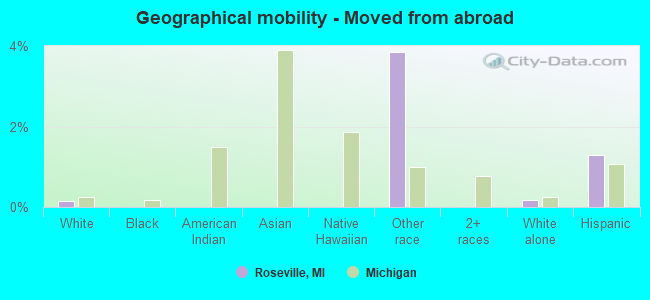
Geographical mobility - Moved from abroad (%)
Geographical mobility - Moved from abroad (%) - White
Geographical mobility - Moved from abroad (%) - Black or African American
Geographical mobility - Moved from abroad (%) - Asian
Geographical mobility - Moved from abroad (%) - Hispanic or Latino
Geographical mobility - Moved from abroad (%) - American Indian and Alaska Native
Geographical mobility - Moved from abroad (%) - Multirace
Geographical mobility - Moved from abroad (%) - Other Race
Place of birth for the foreign-born population - Ireland (%)
Place of birth for the foreign-born population - Denmark (%)
Place of birth for the foreign-born population - Norway (%)
Place of birth for the foreign-born population - Sweden (%)
Place of birth for the foreign-born population - United Kingdom (%)
Place of birth for the foreign-born population - England (%)
Place of birth for the foreign-born population - Scotland (%)
Place of birth for the foreign-born population - Other Northern Europe (%)
Place of birth for the foreign-born population - Austria (%)
Place of birth for the foreign-born population - Belgium (%)
Place of birth for the foreign-born population - France (%)
Place of birth for the foreign-born population - Germany (%)
Place of birth for the foreign-born population - Netherlands (%)
Place of birth for the foreign-born population - Switzerland (%)
Place of birth for the foreign-born population - Other Western Europe (%)
Place of birth for the foreign-born population - Greece (%)
Place of birth for the foreign-born population - Italy (%)
Place of birth for the foreign-born population - Portugal (%)
Place of birth for the foreign-born population - Spain (%)
Place of birth for the foreign-born population - Other Southern Europe (%)
Place of birth for the foreign-born population - Albania (%)
Place of birth for the foreign-born population - Belarus (%)
Place of birth for the foreign-born population - Bosnia and Herzegovina (%)
Place of birth for the foreign-born population - Bulgaria (%)
Place of birth for the foreign-born population - Croatia (%)
Place of birth for the foreign-born population - Czechoslovakia (%)
Place of birth for the foreign-born population - Hungary (%)
Place of birth for the foreign-born population - Latvia (%)
Place of birth for the foreign-born population - Lithuania (%)
Place of birth for the foreign-born population - North Macedonia (Macedonia) (%)
Place of birth for the foreign-born population - Moldova (%)
Place of birth for the foreign-born population - Poland (%)
Place of birth for the foreign-born population - Romania (%)
Place of birth for the foreign-born population - Russia (%)
Place of birth for the foreign-born population - Serbia (%)
Place of birth for the foreign-born population - Ukraine (%)
Place of birth for the foreign-born population - Other Eastern Europe (%)
Place of birth for the foreign-born population - China (%)
Place of birth for the foreign-born population - Hong Kong (%)
Place of birth for the foreign-born population - Taiwan (%)
Place of birth for the foreign-born population - Japan (%)
Place of birth for the foreign-born population - Korea (%)
Place of birth for the foreign-born population - Other Eastern Asia (%)
Place of birth for the foreign-born population - Afghanistan (%)
Place of birth for the foreign-born population - Bangladesh (%)
Place of birth for the foreign-born population - India (%)
Place of birth for the foreign-born population - Iran (%)
Place of birth for the foreign-born population - Kazakhstan (%)
Place of birth for the foreign-born population - Nepal (%)
Place of birth for the foreign-born population - Pakistan (%)
Place of birth for the foreign-born population - Sri Lanka (%)
Place of birth for the foreign-born population - Uzbekistan (%)
Place of birth for the foreign-born population - Other South Central Asia (%)
Place of birth for the foreign-born population - Burma (%)
Place of birth for the foreign-born population - Cambodia (%)
Place of birth for the foreign-born population - Indonesia (%)
Place of birth for the foreign-born population - Laos (%)
Place of birth for the foreign-born population - Malaysia (%)
Place of birth for the foreign-born population - Philippines (%)
Place of birth for the foreign-born population - Singapore (%)
Place of birth for the foreign-born population - Thailand (%)
Place of birth for the foreign-born population - Vietnam (%)
Place of birth for the foreign-born population - Other South Eastern Asia (%)
Place of birth for the foreign-born population - Armenia (%)
Place of birth for the foreign-born population - Iraq (%)
Place of birth for the foreign-born population - Israel (%)
Place of birth for the foreign-born population - Jordan (%)
Place of birth for the foreign-born population - Kuwait (%)
Place of birth for the foreign-born population - Lebanon (%)
Place of birth for the foreign-born population - Saudi Arabia (%)
Place of birth for the foreign-born population - Syria (%)
Place of birth for the foreign-born population - Turkey (%)
Place of birth for the foreign-born population - Yemen (%)
Place of birth for the foreign-born population - Other Western Asia (%)
Place of birth for the foreign-born population - Eritrea (%)
Place of birth for the foreign-born population - Ethiopia (%)
Place of birth for the foreign-born population - Kenya (%)
Place of birth for the foreign-born population - Somalia (%)
Place of birth for the foreign-born population - Uganda (%)
Place of birth for the foreign-born population - Zimbabwe (%)
Place of birth for the foreign-born population - Other Eastern Africa (%)
Place of birth for the foreign-born population - Cameroon (%)
Place of birth for the foreign-born population - Congo (%)
Place of birth for the foreign-born population - Democratic Republic of Congo (Zaire) (%)
Place of birth for the foreign-born population - Other Middle Africa (%)
Place of birth for the foreign-born population - Egypt (%)
Place of birth for the foreign-born population - Morocco (%)
Place of birth for the foreign-born population - Sudan (%)
Place of birth for the foreign-born population - Other Northern Africa (%)
Place of birth for the foreign-born population - South Africa (%)
Place of birth for the foreign-born population - Other Southern Africa (%)
Place of birth for the foreign-born population - Cabo Verde (%)
Place of birth for the foreign-born population - Ghana (%)
Place of birth for the foreign-born population - Liberia (%)
Place of birth for the foreign-born population - Nigeria (%)
Place of birth for the foreign-born population - Senegal (%)
Place of birth for the foreign-born population - Sierra Leone (%)
Place of birth for the foreign-born population - Other Western Africa (%)
Place of birth for the foreign-born population - Australia (%)
Place of birth for the foreign-born population - New Zealand (%)
Place of birth for the foreign-born population - Fiji (%)
Place of birth for the foreign-born population - Micronesia (%)
Place of birth for the foreign-born population - Bahamas (%)
Place of birth for the foreign-born population - Barbados (%)
Place of birth for the foreign-born population - Cuba (%)
Place of birth for the foreign-born population - Dominica (%)
Place of birth for the foreign-born population - Dominican Republic (%)
Place of birth for the foreign-born population - Grenada (%)
Place of birth for the foreign-born population - Haiti (%)
Place of birth for the foreign-born population - Jamaica (%)
Place of birth for the foreign-born population - St. Vincent and the Grenadines (%)
Place of birth for the foreign-born population - Trinidad and Tobago (%)
Place of birth for the foreign-born population - West Indies (%)
Place of birth for the foreign-born population - Other Caribbean (%)
Place of birth for the foreign-born population - Belize (%)
Place of birth for the foreign-born population - Costa Rica (%)
Place of birth for the foreign-born population - El Salvador (%)
Place of birth for the foreign-born population - Guatemala (%)
Place of birth for the foreign-born population - Honduras (%)
Place of birth for the foreign-born population - Mexico (%)
Place of birth for the foreign-born population - Nicaragua (%)
Place of birth for the foreign-born population - Panama (%)
Place of birth for the foreign-born population - Other Central America (%)
Place of birth for the foreign-born population - Argentina (%)
Place of birth for the foreign-born population - Bolivia (%)
Place of birth for the foreign-born population - Brazil (%)
Place of birth for the foreign-born population - Chile (%)
Place of birth for the foreign-born population - Colombia (%)
Place of birth for the foreign-born population - Ecuador (%)
Place of birth for the foreign-born population - Guyana (%)
Place of birth for the foreign-born population - Peru (%)
Place of birth for the foreign-born population - Uruguay (%)
Place of birth for the foreign-born population - Venezuela (%)
Place of birth for the foreign-born population - Other South America (%)
Place of birth for the foreign-born population - Canada (%)
Place of birth for the foreign-born population - Other Northern America (%)
Place of birth for the foreign-born population - Other (%)
Latest news about races in Roseville, MI collected exclusively by city-data.com from local newspapers, TV, and radio stations
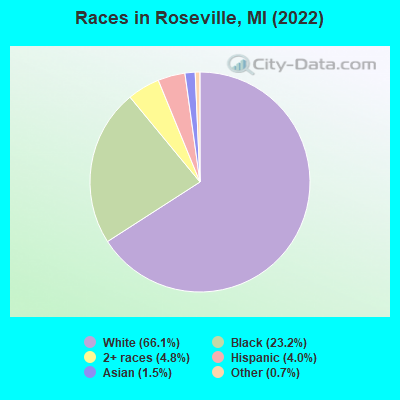
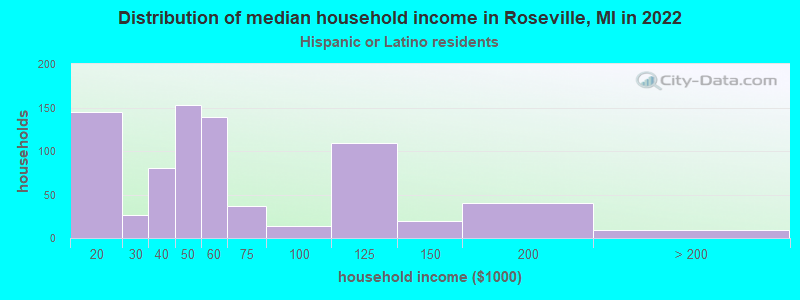
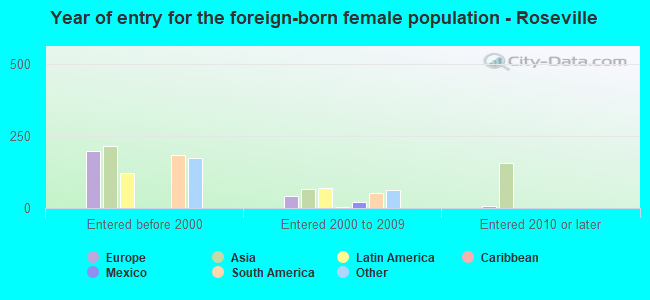
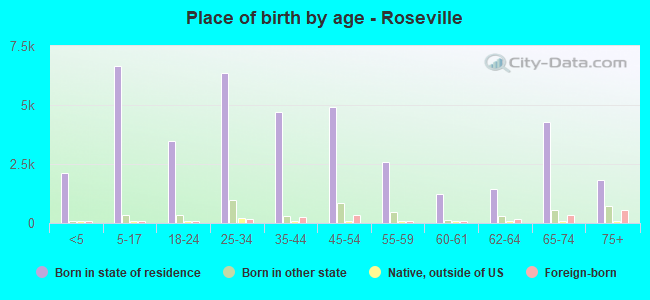
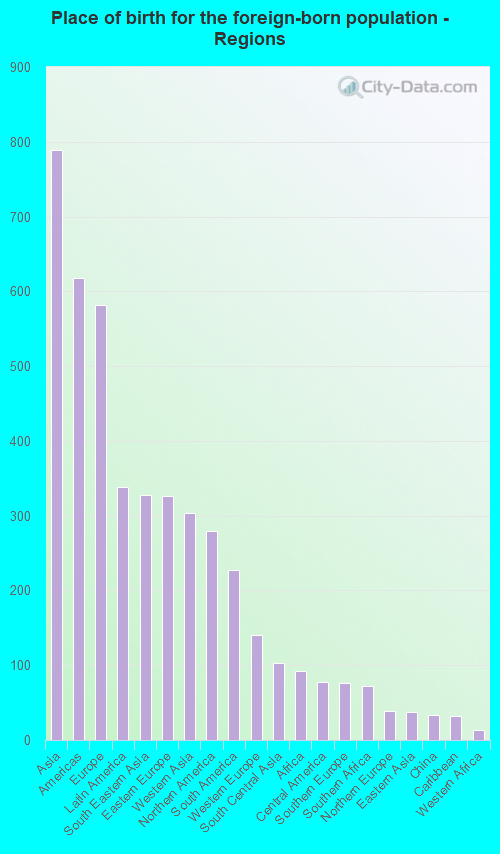
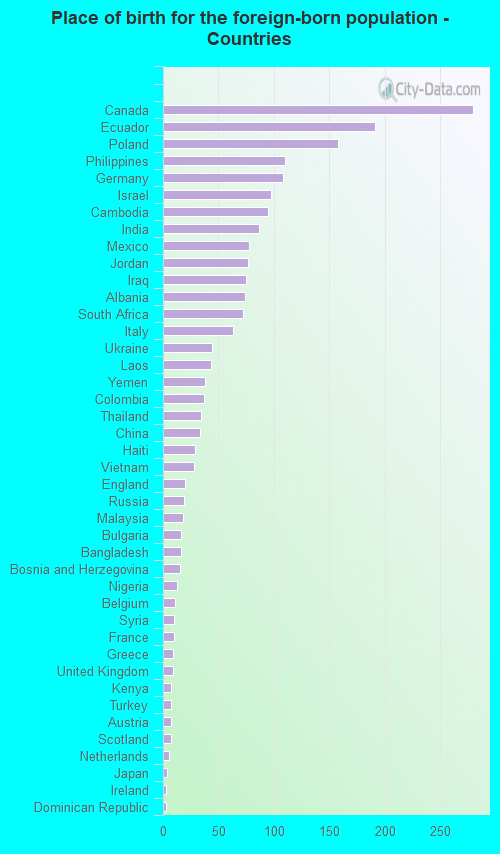
According to 2022 data, the most numerous races in Roseville, MI are White alone (31,223 residents), Black alone (10,966 residents), and Hispanic (1,895 residents). 92.9% of Roseville residents speak English at home. 4.4% of Roseville, MI residents are foreign-born (1.7% born in Asia, 1.2% born in Europe, 0.7% born in Latin America, 0.6% born in North America), which is 36.2% less than the foreign-born rate of 6.0% across the entire state of Michigan.
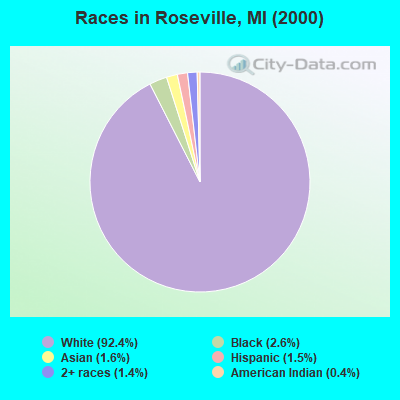
Race distribution in Roseville
2000 2022
7,806,691 78.6% White alone 1,402,047 14.1% Black alone 323,877 3.3% Hispanic 175,311 1.8% Asian alone 163,487 1.6% Two or more races 53,421 0.5% American Indian alone 11,465 0.1% Other race alone 2,145 0.02% Native Hawaiian and Other
7,289,051 72.6% White alone 1,310,464 13.1% Black alone 572,405 5.7% Hispanic 450,031 4.5% Two or more races 335,732 3.3% Asian alone 45,217 0.5% Other race alone 29,011 0.3% American Indian alone 2,207 0.02% Native Hawaiian and Other
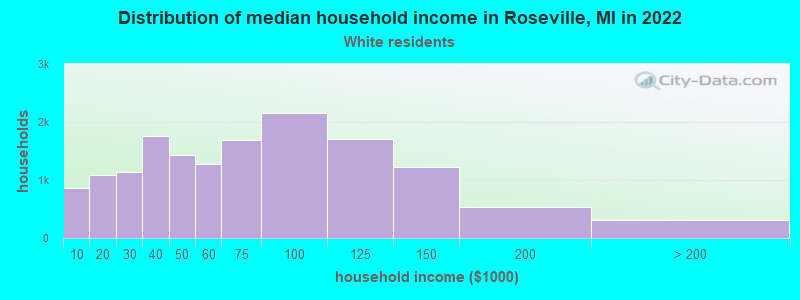
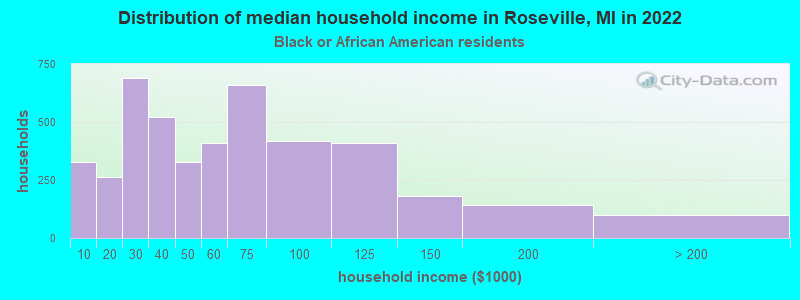
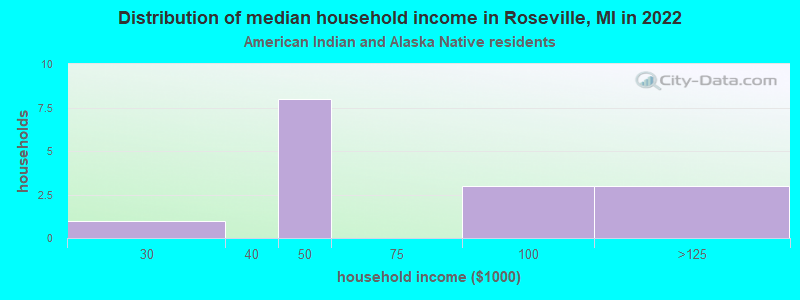
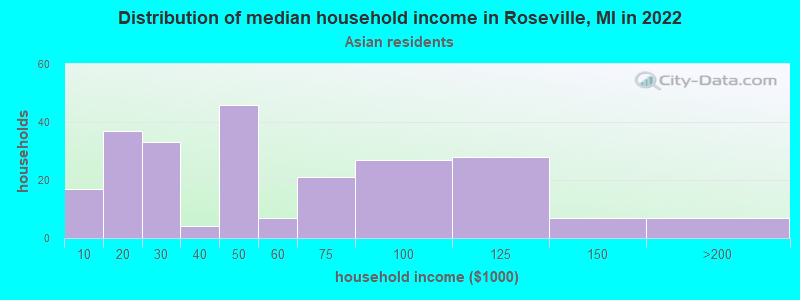
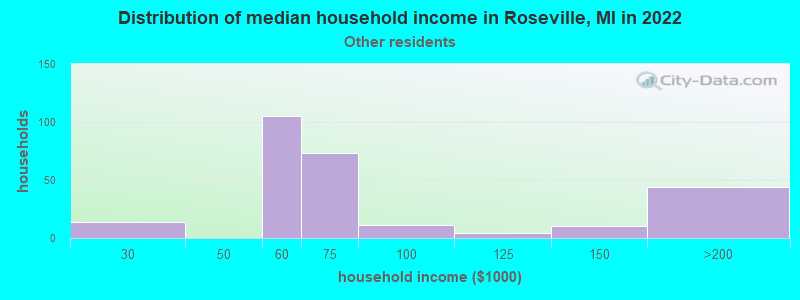
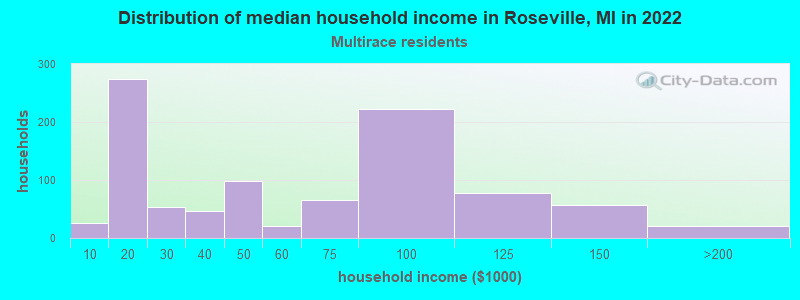
Income and house value in Roseville Median household income in 2022 $60,254 White non-Hispanic householders$52,442 Black householders$40,904 Asian householders$59,441 Some other race householders$44,493 Two or more races householders$56,872 Hispanic or Latino race householdersMedian 2022 house value $144,773 White Non-Hispanic householders$126,250 Black or African American householders$132,770 American Indian or Alaska Native householders $158,109 Asian householders$120,767 Some other race householders$157,516 Two or more races householders$168,482 Hispanic or Latino householders
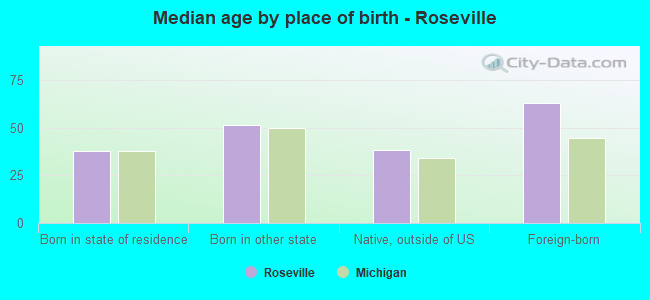
Median age by race in Roseville
44.7 Median age for White residents44.1 45.8 32.6 Median age for Black or African American residents28.5 36.1 59.6 Median age for American Indian / Alaska Native residents39.2 79.5 41.8 Median age for Asian residents41.2 46.0 -670,531,400.3 Median age for Native Hawaiian / Pacific Islander residents-674,772,035.8 -699,588,476.7 39.4 Median age for Other race residents40.8 38.3 27.8 Median age for Two or more races residents23.5 28.0 45.1 Median age for White alone residents43.9 46.6 34.9 Median age for Hispanic or Latino residents40.8 28.3
Owner/renter occupied households by race in Roseville
House owners and renters - White residents 11,480 75.7% Owner occupied3,676 24.3% Renter occupiedHouse owners and renters - Black or African American residents 1,082 24.2% Owner occupied3,379 75.8% Renter occupiedHouse owners and renters - American Indian / Alaska Native residents 13 65.0% Owner occupied7 35.0% Renter occupiedHouse owners and renters - Asian residents 218 82.0% Owner occupied48 18.0% Renter occupiedHouse owners and renters - Native Hawaiian / Pacific Islander residents 7 100.0% Owner occupiedHouse owners and renters - Other race residents 293 86.3% Owner occupied47 13.7% Renter occupiedHouse owners and renters - Two or more races residents 536 49.7% Owner occupied542 50.3% Renter occupiedHouse owners and renters - White alone residents 11,262 76.1% Owner occupied3,531 23.9% Renter occupiedHouse owners and renters - Hispanic or Latino residents 483 54.4% Owner occupied405 45.6% Renter occupied
Language usage in Roseville
English speakers - Total 92.9% of residents of Roseville speak English at home.
1.6% of residents speak Spanish at home 494 67.6% Speak English very well237 32.4% Speak English less than very well5.1% of residents speak other language at home 1,389 60.7% Speak English very well899 39.3% Speak English less than very well
English speakers - Born in the United States 94.4% of residents of Roseville speak English at home.
2.6% of residents speak Spanish at home 81 61.8% Speak English very well50 38.2% Speak English less than very well2.3% of residents speak other language at home 74 63.2% Speak English very well43 36.8% Speak English less than very well
English speakers - Native, born elsewhere 47.0% of residents of Roseville speak English at home.
44.7% of residents speak Spanish at home 94 48.0% Speak English very well102 52.0% Speak English less than very well7.3% of residents speak other language at home 32 100.0% Speak English very well
English speakers - Foreign-born 30.2% of residents of Roseville speak English at home.
3.3% of residents speak Spanish at home 8 11.8% Speak English very well60 88.2% Speak English less than very well65.6% of residents speak other language at home 554 41.4% Speak English very well783 58.6% Speak English less than very well
White (Caucasian) - Speak only English Native:
96.5% (28,794)Foreign-born:
44.7% (495)
White (Caucasian) - Speak another language Native:
3.5% (1,036)Foreign-born:
54.1% (599)
Black or African American - Speak only English Native:
97.7% (9,687)Foreign-born:
36.8% (68)
Black or African American - Speak another language Native:
1.9% (192)Foreign-born:
63.5% (118)
Asian - Speak only English Native:
56.2% (143)Foreign-born:
5.2% (25)
Asian - Speak another language Native:
39.5% (100)Foreign-born:
94.9% (454)
Other race - Speak only English Native:
68.7% (491)Foreign-born:
20.0% (17)
Other race - Speak another language Native:
31.0% (222)Foreign-born:
80.8% (69)
Two or more races - Speak only English Native:
93.7% (2,299)Foreign-born:
2.7% (7)
Two or more races - Speak another language Native:
6.1% (148)Foreign-born:
99.5% (270)
White alone - Speak only English Native:
96.8% (28,263)Foreign-born:
44.6% (492)
White alone - Speak another language Native:
3.1% (903)Foreign-born:
53.9% (593)
Hispanic or Latino - Speak only English Native:
74.7% (1,211)Foreign-born:
3.8% (8)
Hispanic or Latino - Speak another language Native:
24.7% (401)Foreign-born:
97.1% (202)
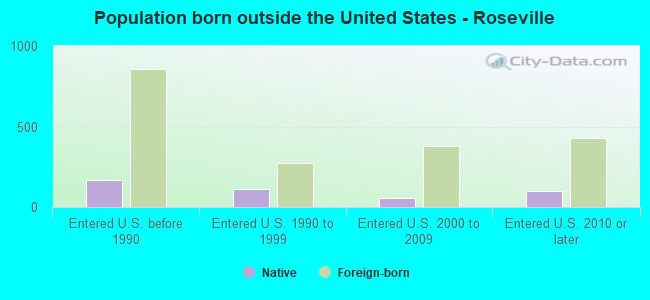
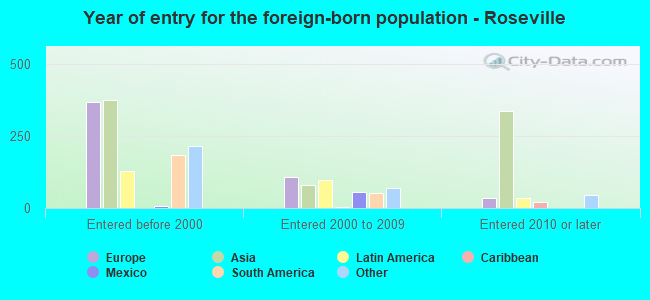
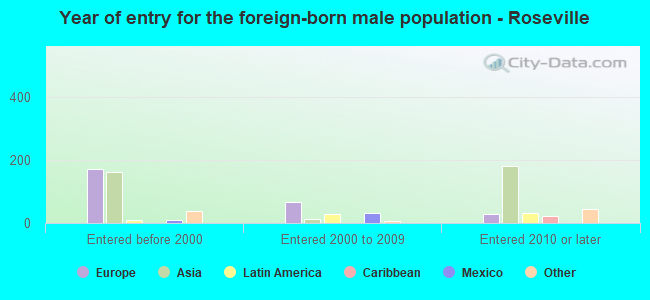
Foreign-born residents in Roseville 2,082 residents are foreign born (1.7% Asia , 1.2% Europe , 0.7% Latin America , 0.6% North America ).
This city:
4.4%Michigan:
6.9%
Marital status for residents in Roseville Marital status - White (Caucasian) population 15 years and over
Males 38.8% Never married41.1% Now married1.3% Separated3.7% Widowed15.1% DivorcedFemales 29.6% Never married40.4% Now married2.3% Separated11.1% Widowed16.7% DivorcedWomen who gave birth in the past 12 months Now married:
59.5% (241)Unmarried:
40.5% (164)
Women who did not give birth in the past 12 months Now married:
41.5% (2,695)Unmarried:
58.5% (3,803)
Marital status - Black or African American population 15 years and over
Males 56.3% Never married31.4% Now married1.2% Separated2.0% Widowed9.2% DivorcedFemales 48.5% Never married22.6% Now married0.5% Separated9.5% Widowed18.8% DivorcedWomen who gave birth in the past 12 months Now married:
26.4% (29)Unmarried:
73.6% (81)
Women who did not give birth in the past 12 months Now married:
24.2% (665)Unmarried:
75.8% (2,081)
Marital status - American Indian / Alaska Native population 15 years and over
Males 27.3% Never married59.1% Now married0.0% Separated0.0% Widowed13.6% DivorcedFemales 25.9% Never married74.1% Now married0.0% Separated0.0% Widowed0.0% DivorcedWomen who did not give birth in the past 12 months Now married:
100.0% (4)Unmarried:
0.0% (0)
Marital status - Asian population 15 years and over
Males 56.6% Never married38.2% Now married0.0% Separated0.0% Widowed5.2% DivorcedFemales 16.8% Never married43.6% Now married0.0% Separated19.8% Widowed19.8% DivorcedWomen who did not give birth in the past 12 months Now married:
55.7% (84)Unmarried:
44.3% (67)
Marital status - Other race population 15 years and over
Males 26.1% Never married65.4% Now married0.0% Separated0.0% Widowed8.5% DivorcedFemales 32.3% Never married63.9% Now married0.0% Separated3.8% Widowed0.0% DivorcedWomen who did not give birth in the past 12 months Now married:
55.7% (76)Unmarried:
44.3% (61)
Marital status - Two or more races population 15 years and over
Males 52.9% Never married36.3% Now married0.0% Separated2.1% Widowed8.6% DivorcedFemales 39.1% Never married23.1% Now married0.8% Separated20.4% Widowed16.6% DivorcedWomen who gave birth in the past 12 months Now married:
0.0% (0)Unmarried:
100.0% (11)
Women who did not give birth in the past 12 months Now married:
13.7% (83)Unmarried:
86.3% (518)
Marital status - White alone, not Hispanic / Latino population 15 years and over
Males 39.1% Never married40.8% Now married1.3% Separated3.9% Widowed14.9% DivorcedFemales 29.0% Never married40.7% Now married2.2% Separated11.2% Widowed16.8% DivorcedWomen who gave birth in the past 12 months Now married:
58.9% (225)Unmarried:
41.1% (157)
Women who did not give birth in the past 12 months Now married:
42.1% (2,678)Unmarried:
57.9% (3,685)
Marital status - Hispanic or Latino population 15 years and over
Males 40.0% Never married48.0% Now married0.0% Separated0.7% Widowed11.3% DivorcedFemales 36.9% Never married15.5% Now married2.9% Separated33.3% Widowed11.3% DivorcedWomen who gave birth in the past 12 months Now married:
70.8% (18)Unmarried:
29.2% (8)
Women who did not give birth in the past 12 months Now married:
20.4% (62)Unmarried:
79.6% (240)
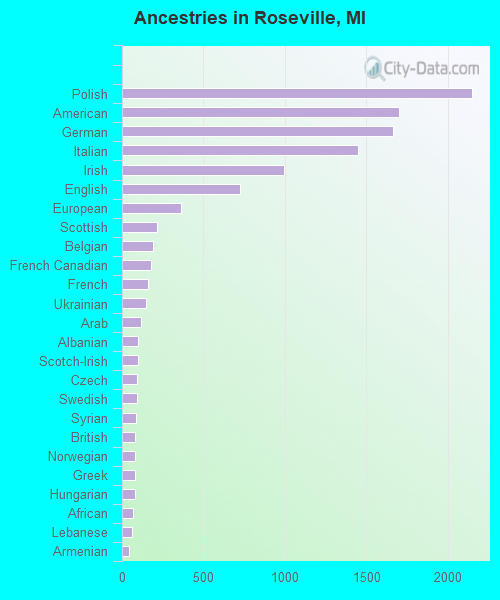
Ancestries in Roseville
2,147 10.0% Polish1,702 7.9% American1,667 7.8% German1,447 6.7% Italian994 4.6% Irish724 3.4% English361 1.7% European213 1.0% Scottish188 0.9% Belgian179 0.8% French Canadian161 0.8% French148 0.7% Ukrainian119 0.6% Arab99 0.5% Albanian96 0.4% Scotch-Irish91 0.4% Czech90 0.4% Swedish88 0.4% Syrian79 0.4% British78 0.4% Norwegian77 0.4% Greek77 0.4% Hungarian68 0.3% African60 0.3% Lebanese45 0.2% Armenian39 0.2% Palestinian36 0.2% Jordanian30 0.1% Welsh25 0.1% Dutch24 0.1% Slovak21 0.10% Canadian18 0.08% Iraqi18 0.08% Eastern European17 0.08% Nigerian16 0.07% Bulgarian15 0.07% Finnish14 0.07% Lithuanian12 0.06% Yugoslavian11 0.05% Scandinavian11 0.05% South African9 0.04% Croatian9 0.04% Russian8 0.04% Austrian7 0.03% Israeli7 0.03% Turkish6 0.03% Northern European4 0.02% Romanian3 0.01% Maltese
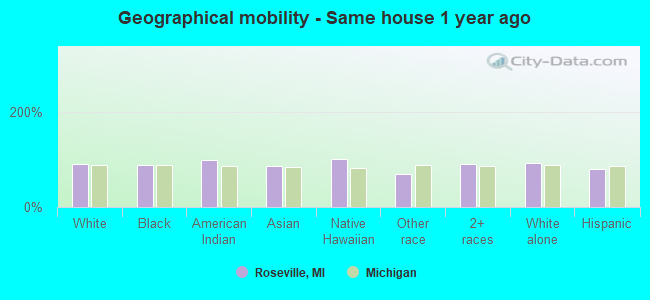
Geographical mobility in Roseville Same house 1 year ago 28,795 91.0% White (Caucasian)9,509 87.6% Black or African American49 98.3% American Indian / Alaska Native620 85.2% Asian26 100.0% Native Hawaiian / Pacific Islander402 69.5% Other race2,733 90.5% Two or more races28,396 91.7% White alone, not Hispanic / Latino1,506 80.3% Hispanic or LatinoMoved within same county 2,024 6.4% White / Caucasian1,001 9.2% Black or African American5 0.7% Asian122 21.0% Other race90 3.0% Two or more races1,893 6.1% White alone, not Hispanic / Latino177 9.4% Hispanic or LatinoMoved within same state 452 1.4% White / Caucasian284 2.6% Black or African American1 2.8% American Indian / Alaska Native40 5.5% Asian10 1.8% Other race55 1.8% Two or more races375 1.2% White alone, not Hispanic / Latino49 2.6% Hispanic or LatinoMoved from different state 197 0.6% White / Caucasian83 0.8% Black or African American71 9.7% Asian14 2.4% Other race97 3.2% Two or more races181 0.6% White alone, not Hispanic / Latino33 1.7% Hispanic or LatinoMoved from abroad 50 0.2% White22 3.8% Other race53 0.2% White alone, not Hispanic / Latino24 1.3% Hispanic or Latino
Children Nativity (place of birth) in Roseville
Children under 6 years - Living with two parents Both parents native 1,250 100.0% NativeBoth parents foreign-born 4 53.2% Native4 46.8% Foreign-bornOne native, one foreign-born parent 19 100.0% NativeChildren under 6 years - Living with one parent Native parent 1,327 100.0% NativeForeign-born parent 8 100.0% NativeChildren 6 to 17 years - Living with two parents Both parents native 2,622 100.0% NativeBoth parents foreign-born 115 78.9% Native31 21.1% Foreign-bornOne native, one foreign-born parent 81 100.0% NativeChildren 6 to 17 years - Living with one parent Native parent 2,951 100.0% NativeForeign-born parent 366 47.3% Native407 52.7% Foreign-born
Grandparents responsible for own grandchildren in Roseville
Grandparents (30 to 59 years) White / Caucasian 100 62.3% Responsible for grandchildren60 37.7% Not responsible for grandchildrenBlack or African American 19 100.0% Not responsible for grandchildrenTwo or more races 10 100.0% Not responsible for grandchildrenWhite alone, not Hispanic / Latino 100 62.5% Responsible for grandchildren60 37.5% Not responsible for grandchildrenHispanic or Latino 8 100.0% Not responsible for grandchildrenGrandparents (60 years and over) White / Caucasian 96 22.1% Responsible for grandchildren338 77.9% Not responsible for grandchildrenBlack or African American 29 24.0% Responsible for grandchildren93 76.0% Not responsible for grandchildrenWhite alone, not Hispanic / Latino 96 22.7% Responsible for grandchildren327 77.3% Not responsible for grandchildrenHispanic or Latino 8 100.0% Not responsible for grandchildren