Races in Roanoke, Virginia (VA) Detailed Stats
Data:
Races - White alone (%)
Races - White alone (% change since 2000)
Races - Black alone (%)
Races - Black alone (% change since 2000)
Races - American Indian alone (%)
Races - American Indian alone (% change since 2000)
Races - Asian alone (%)
Races - Asian alone (% change since 2000)
Races - Hispanic (%)
Races - Hispanic (% change since 2000)
Races - Native Hawaiian and Other Pacific Islander alone (%)
Races - Native Hawaiian and Other Pacific Islander alone (% change since 2000)
Races - Two or more races(%)
Races - Two or more races(% change since 2000)
Races - Other race alone (%)
Races - Other race alone (% change since 2000)
Racial diversity
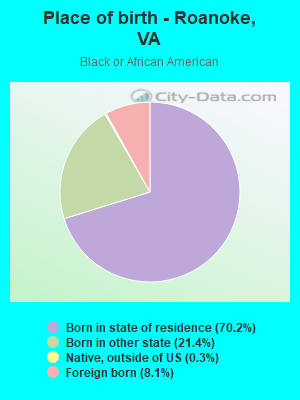
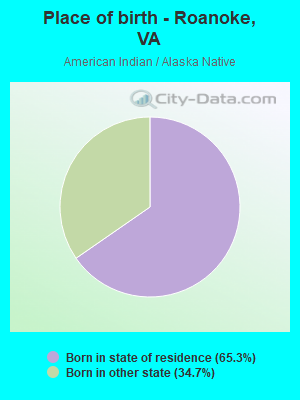
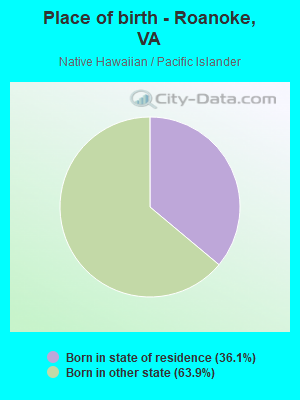
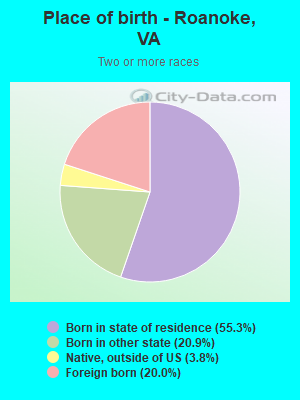
Place of birth - Born in state of residence (%)
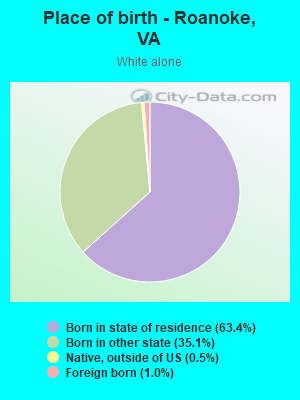
Place of birth - Born in state of residence (%) - White
Place of birth - Born in state of residence (%) - Black or African American
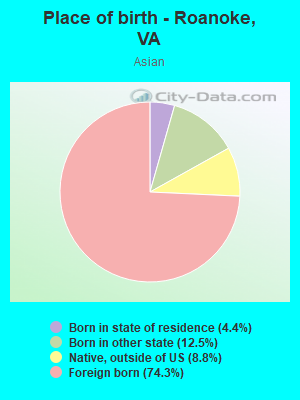
Place of birth - Born in state of residence (%) - Asian
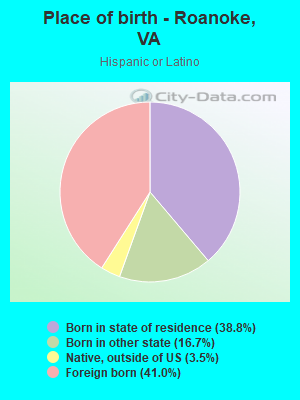
Place of birth - Born in state of residence (%) - Hispanic or Latino
Place of birth - Born in state of residence (%) - American Indian and Alaska Native
Place of birth - Born in state of residence (%) - Multirace
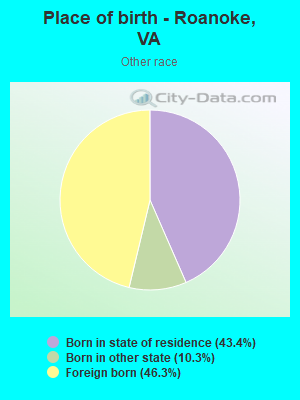
Place of birth - Born in state of residence (%) - Other Race
Place of birth - Born in other state (%)
Place of birth - Born in other state (%) - White
Place of birth - Born in other state (%) - Black or African American
Place of birth - Born in other state (%) - Asian
Place of birth - Born in other state (%) - Hispanic or Latino
Place of birth - Born in other state (%) - American Indian and Alaska Native
Place of birth - Born in other state (%) - Multirace
Place of birth - Born in other state (%) - Other Race
Place of birth - Native, outside of US (%)
Place of birth - Native, outside of US (%) - White
Place of birth - Native, outside of US (%) - Black or African American
Place of birth - Native, outside of US (%) - Asian
Place of birth - Native, outside of US (%) - Hispanic or Latino
Place of birth - Native, outside of US (%) - American Indian and Alaska Native
Place of birth - Native, outside of US (%) - Multirace
Place of birth - Native, outside of US (%) - Other Race
Place of birth - Foreign born (%)
Place of birth - Foreign born (%) - White
Place of birth - Foreign born (%) - Black or African American
Place of birth - Foreign born (%) - Asian
Place of birth - Foreign born (%) - Hispanic or Latino
Place of birth - Foreign born (%) - American Indian and Alaska Native
Place of birth - Foreign born (%) - Multirace
Place of birth - Foreign born (%) - Other Race
Residents speaking English at home (%)
Residents speaking English at home - Born in the United States (%)
Residents speaking English at home - Native, born elsewhere (%)
Residents speaking English at home - Foreign born (%)
Residents speaking Spanish at home (%)
Residents speaking Spanish at home - Born in the United States (%)
Residents speaking Spanish at home - Native, born elsewhere (%)
Residents speaking Spanish at home - Foreign born (%)
Residents speaking other language at home (%)
Residents speaking other language at home - Born in the United States (%)
Residents speaking other language at home - Native, born elsewhere (%)
Residents speaking other language at home - Foreign born (%)
Marital status - Never married (%)
Marital status - Now married (%)
Marital status - Separated (%)
Marital status - Widowed (%)
Marital status - Divorced (%)
Ancestries Reported - Arab (%)
Ancestries Reported - Czech (%)
Ancestries Reported - Danish (%)
Ancestries Reported - Dutch (%)
Ancestries Reported - English (%)
Ancestries Reported - French (%)
Ancestries Reported - French Canadian (%)
Ancestries Reported - German (%)
Ancestries Reported - Greek (%)
Ancestries Reported - Hungarian (%)
Ancestries Reported - Irish (%)
Ancestries Reported - Italian (%)
Ancestries Reported - Lithuanian (%)
Ancestries Reported - Norwegian (%)
Ancestries Reported - Polish (%)
Ancestries Reported - Portuguese (%)
Ancestries Reported - Russian (%)
Ancestries Reported - Scotch-Irish (%)
Ancestries Reported - Scottish (%)
Ancestries Reported - Slovak (%)
Ancestries Reported - Subsaharan African (%)
Ancestries Reported - Swedish (%)
Ancestries Reported - Swiss (%)
Ancestries Reported - Ukrainian (%)
Ancestries Reported - United States (%)
Ancestries Reported - Welsh (%)
Ancestries Reported - West Indian (%)
Ancestries Reported - Other (%)
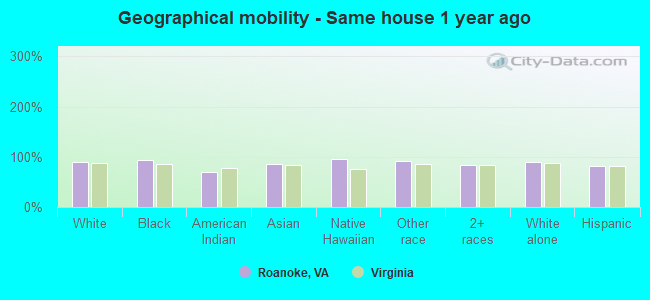
Geographical mobility - Same house 1 year ago (%)
Geographical mobility - Same house 1 year ago (%) - White
Geographical mobility - Same house 1 year ago (%) - Black or African American
Geographical mobility - Same house 1 year ago (%) - Asian
Geographical mobility - Same house 1 year ago (%) - Hispanic or Latino
Geographical mobility - Same house 1 year ago (%) - American Indian and Alaska Native
Geographical mobility - Same house 1 year ago (%) - Multirace
Geographical mobility - Same house 1 year ago (%) - Other Race
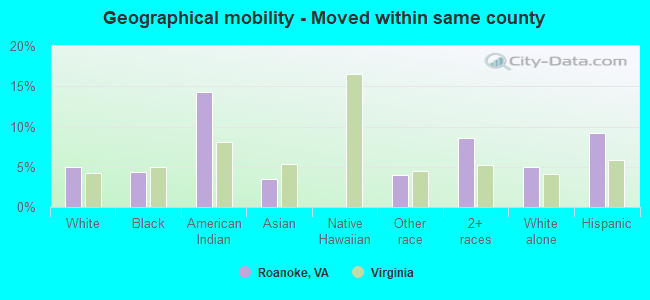
Geographical mobility - Moved within same county (%)
Geographical mobility - Moved within same county (%) - White
Geographical mobility - Moved within same county (%) - Black or African American
Geographical mobility - Moved within same county (%) - Asian
Geographical mobility - Moved within same county (%) - Hispanic or Latino
Geographical mobility - Moved within same county (%) - American Indian and Alaska Native
Geographical mobility - Moved within same county (%) - Multirace
Geographical mobility - Moved within same county (%) - Other Race
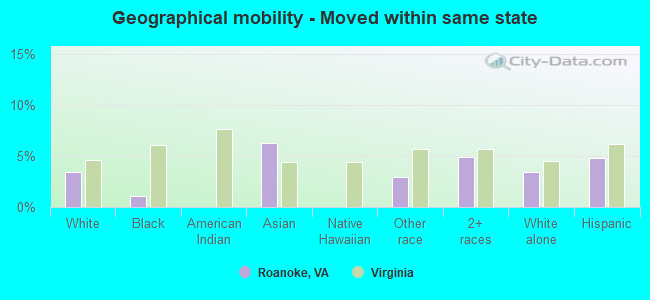
Geographical mobility - Moved from different county within same state (%)
Geographical mobility - Moved from different county within same state (%) - White
Geographical mobility - Moved from different county within same state (%) - Black or African American
Geographical mobility - Moved from different county within same state (%) - Asian
Geographical mobility - Moved from different county within same state (%) - Hispanic or Latino
Geographical mobility - Moved from different county within same state (%) - American Indian and Alaska Native
Geographical mobility - Moved from different county within same state (%) - Multirace
Geographical mobility - Moved from different county within same state (%) - Other Race
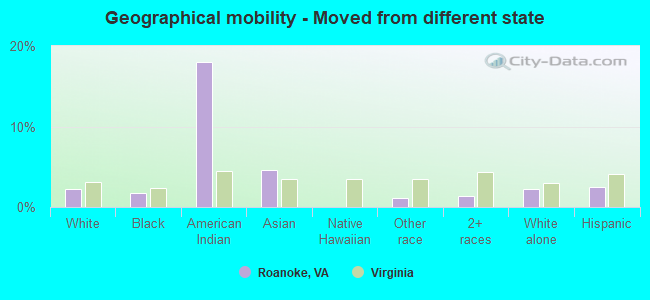
Geographical mobility - Moved from different state (%)
Geographical mobility - Moved from different state (%) - White
Geographical mobility - Moved from different state (%) - Black or African American
Geographical mobility - Moved from different state (%) - Asian
Geographical mobility - Moved from different state (%) - Hispanic or Latino
Geographical mobility - Moved from different state (%) - American Indian and Alaska Native
Geographical mobility - Moved from different state (%) - Multirace
Geographical mobility - Moved from different state (%) - Other Race
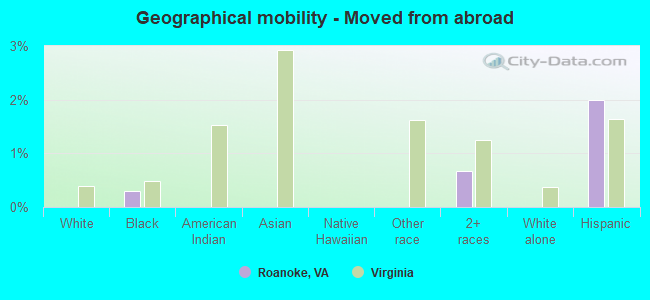
Geographical mobility - Moved from abroad (%)
Geographical mobility - Moved from abroad (%) - White
Geographical mobility - Moved from abroad (%) - Black or African American
Geographical mobility - Moved from abroad (%) - Asian
Geographical mobility - Moved from abroad (%) - Hispanic or Latino
Geographical mobility - Moved from abroad (%) - American Indian and Alaska Native
Geographical mobility - Moved from abroad (%) - Multirace
Geographical mobility - Moved from abroad (%) - Other Race
Place of birth for the foreign-born population - Ireland (%)
Place of birth for the foreign-born population - Denmark (%)
Place of birth for the foreign-born population - Norway (%)
Place of birth for the foreign-born population - Sweden (%)
Place of birth for the foreign-born population - United Kingdom (%)
Place of birth for the foreign-born population - England (%)
Place of birth for the foreign-born population - Scotland (%)
Place of birth for the foreign-born population - Other Northern Europe (%)
Place of birth for the foreign-born population - Austria (%)
Place of birth for the foreign-born population - Belgium (%)
Place of birth for the foreign-born population - France (%)
Place of birth for the foreign-born population - Germany (%)
Place of birth for the foreign-born population - Netherlands (%)
Place of birth for the foreign-born population - Switzerland (%)
Place of birth for the foreign-born population - Other Western Europe (%)
Place of birth for the foreign-born population - Greece (%)
Place of birth for the foreign-born population - Italy (%)
Place of birth for the foreign-born population - Portugal (%)
Place of birth for the foreign-born population - Spain (%)
Place of birth for the foreign-born population - Other Southern Europe (%)
Place of birth for the foreign-born population - Albania (%)
Place of birth for the foreign-born population - Belarus (%)
Place of birth for the foreign-born population - Bosnia and Herzegovina (%)
Place of birth for the foreign-born population - Bulgaria (%)
Place of birth for the foreign-born population - Croatia (%)
Place of birth for the foreign-born population - Czechoslovakia (%)
Place of birth for the foreign-born population - Hungary (%)
Place of birth for the foreign-born population - Latvia (%)
Place of birth for the foreign-born population - Lithuania (%)
Place of birth for the foreign-born population - North Macedonia (Macedonia) (%)
Place of birth for the foreign-born population - Moldova (%)
Place of birth for the foreign-born population - Poland (%)
Place of birth for the foreign-born population - Romania (%)
Place of birth for the foreign-born population - Russia (%)
Place of birth for the foreign-born population - Serbia (%)
Place of birth for the foreign-born population - Ukraine (%)
Place of birth for the foreign-born population - Other Eastern Europe (%)
Place of birth for the foreign-born population - China (%)
Place of birth for the foreign-born population - Hong Kong (%)
Place of birth for the foreign-born population - Taiwan (%)
Place of birth for the foreign-born population - Japan (%)
Place of birth for the foreign-born population - Korea (%)
Place of birth for the foreign-born population - Other Eastern Asia (%)
Place of birth for the foreign-born population - Afghanistan (%)
Place of birth for the foreign-born population - Bangladesh (%)
Place of birth for the foreign-born population - India (%)
Place of birth for the foreign-born population - Iran (%)
Place of birth for the foreign-born population - Kazakhstan (%)
Place of birth for the foreign-born population - Nepal (%)
Place of birth for the foreign-born population - Pakistan (%)
Place of birth for the foreign-born population - Sri Lanka (%)
Place of birth for the foreign-born population - Uzbekistan (%)
Place of birth for the foreign-born population - Other South Central Asia (%)
Place of birth for the foreign-born population - Burma (%)
Place of birth for the foreign-born population - Cambodia (%)
Place of birth for the foreign-born population - Indonesia (%)
Place of birth for the foreign-born population - Laos (%)
Place of birth for the foreign-born population - Malaysia (%)
Place of birth for the foreign-born population - Philippines (%)
Place of birth for the foreign-born population - Singapore (%)
Place of birth for the foreign-born population - Thailand (%)
Place of birth for the foreign-born population - Vietnam (%)
Place of birth for the foreign-born population - Other South Eastern Asia (%)
Place of birth for the foreign-born population - Armenia (%)
Place of birth for the foreign-born population - Iraq (%)
Place of birth for the foreign-born population - Israel (%)
Place of birth for the foreign-born population - Jordan (%)
Place of birth for the foreign-born population - Kuwait (%)
Place of birth for the foreign-born population - Lebanon (%)
Place of birth for the foreign-born population - Saudi Arabia (%)
Place of birth for the foreign-born population - Syria (%)
Place of birth for the foreign-born population - Turkey (%)
Place of birth for the foreign-born population - Yemen (%)
Place of birth for the foreign-born population - Other Western Asia (%)
Place of birth for the foreign-born population - Eritrea (%)
Place of birth for the foreign-born population - Ethiopia (%)
Place of birth for the foreign-born population - Kenya (%)
Place of birth for the foreign-born population - Somalia (%)
Place of birth for the foreign-born population - Uganda (%)
Place of birth for the foreign-born population - Zimbabwe (%)
Place of birth for the foreign-born population - Other Eastern Africa (%)
Place of birth for the foreign-born population - Cameroon (%)
Place of birth for the foreign-born population - Congo (%)
Place of birth for the foreign-born population - Democratic Republic of Congo (Zaire) (%)
Place of birth for the foreign-born population - Other Middle Africa (%)
Place of birth for the foreign-born population - Egypt (%)
Place of birth for the foreign-born population - Morocco (%)
Place of birth for the foreign-born population - Sudan (%)
Place of birth for the foreign-born population - Other Northern Africa (%)
Place of birth for the foreign-born population - South Africa (%)
Place of birth for the foreign-born population - Other Southern Africa (%)
Place of birth for the foreign-born population - Cabo Verde (%)
Place of birth for the foreign-born population - Ghana (%)
Place of birth for the foreign-born population - Liberia (%)
Place of birth for the foreign-born population - Nigeria (%)
Place of birth for the foreign-born population - Senegal (%)
Place of birth for the foreign-born population - Sierra Leone (%)
Place of birth for the foreign-born population - Other Western Africa (%)
Place of birth for the foreign-born population - Australia (%)
Place of birth for the foreign-born population - New Zealand (%)
Place of birth for the foreign-born population - Fiji (%)
Place of birth for the foreign-born population - Micronesia (%)
Place of birth for the foreign-born population - Bahamas (%)
Place of birth for the foreign-born population - Barbados (%)
Place of birth for the foreign-born population - Cuba (%)
Place of birth for the foreign-born population - Dominica (%)
Place of birth for the foreign-born population - Dominican Republic (%)
Place of birth for the foreign-born population - Grenada (%)
Place of birth for the foreign-born population - Haiti (%)
Place of birth for the foreign-born population - Jamaica (%)
Place of birth for the foreign-born population - St. Vincent and the Grenadines (%)
Place of birth for the foreign-born population - Trinidad and Tobago (%)
Place of birth for the foreign-born population - West Indies (%)
Place of birth for the foreign-born population - Other Caribbean (%)
Place of birth for the foreign-born population - Belize (%)
Place of birth for the foreign-born population - Costa Rica (%)
Place of birth for the foreign-born population - El Salvador (%)
Place of birth for the foreign-born population - Guatemala (%)
Place of birth for the foreign-born population - Honduras (%)
Place of birth for the foreign-born population - Mexico (%)
Place of birth for the foreign-born population - Nicaragua (%)
Place of birth for the foreign-born population - Panama (%)
Place of birth for the foreign-born population - Other Central America (%)
Place of birth for the foreign-born population - Argentina (%)
Place of birth for the foreign-born population - Bolivia (%)
Place of birth for the foreign-born population - Brazil (%)
Place of birth for the foreign-born population - Chile (%)
Place of birth for the foreign-born population - Colombia (%)
Place of birth for the foreign-born population - Ecuador (%)
Place of birth for the foreign-born population - Guyana (%)
Place of birth for the foreign-born population - Peru (%)
Place of birth for the foreign-born population - Uruguay (%)
Place of birth for the foreign-born population - Venezuela (%)
Place of birth for the foreign-born population - Other South America (%)
Place of birth for the foreign-born population - Canada (%)
Place of birth for the foreign-born population - Other Northern America (%)
Place of birth for the foreign-born population - Other (%)
Latest news about races in Roanoke, VA collected exclusively by city-data.com from local newspapers, TV, and radio stations
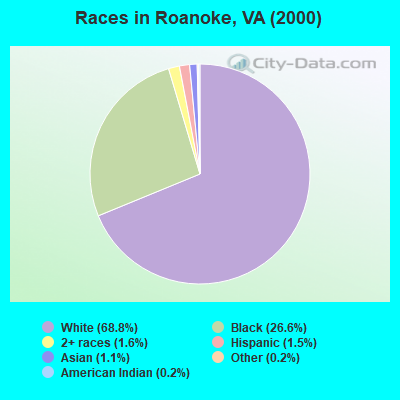
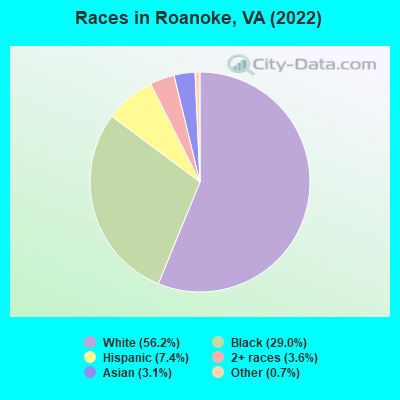
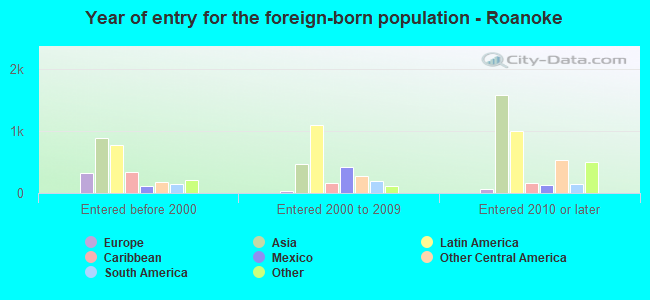
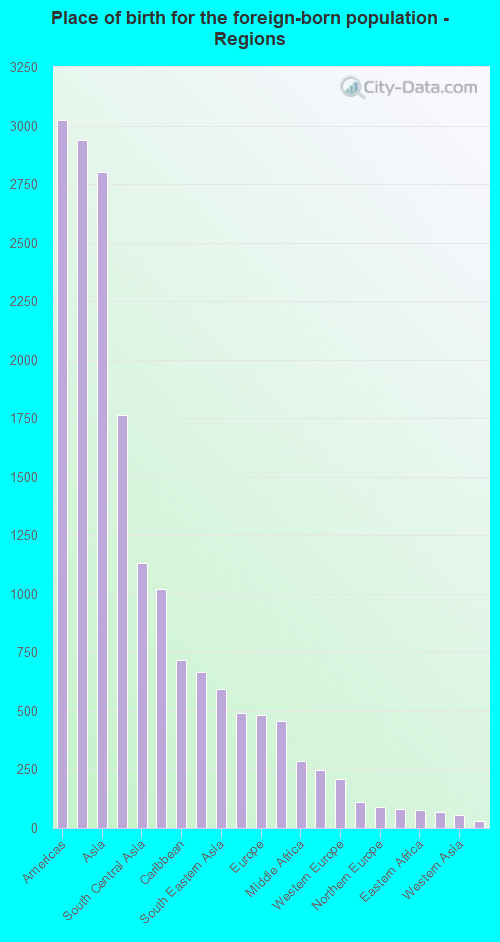
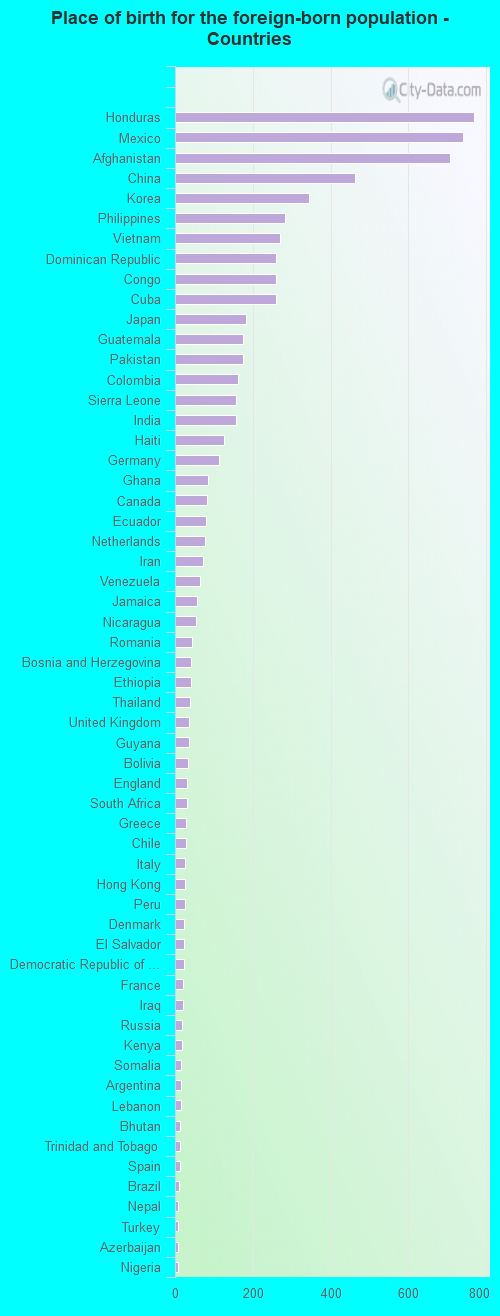
According to 2022 data, the most numerous races in Roanoke, VA are White alone (54,955 residents), Black alone (28,342 residents), and Hispanic (7,222 residents). 87.3% of Roanoke residents speak English at home. 7.0% of Roanoke, VA residents are foreign-born (2.9% born in Latin America, 2.8% born in Asia), which is 71.3% less than the foreign-born rate of 12.0% across the entire state of Virginia.
Race distribution in Roanoke
2000 2022
65,256 68.8% White alone 25,220 26.6% Black alone 1,558 1.6% Two or more races 1,405 1.5% Hispanic 1,088 1.1% Asian alone 185 0.2% Other race alone 178 0.2% American Indian alone 21 0.02% Native Hawaiian and Other
54,955 56.2% White alone 28,342 29.0% Black alone 7,222 7.4% Hispanic 3,484 3.6% Two or more races 3,053 3.1% Asian alone 705 0.7% Other race alone 75 0.08% Native Hawaiian and Other 11 0.01% American Indian alone
2000 2022
4,965,637 70.2% White alone 1,376,378 19.4% Black alone 329,540 4.7% Hispanic 259,277 3.7% Asian alone 114,022 1.6% Two or more races 18,596 0.3% American Indian alone 11,685 0.2% Other race alone 3,380 0.05% Native Hawaiian and Other
5,095,130 58.7% White alone 1,594,785 18.4% Black alone 905,750 10.4% Hispanic 602,881 6.9% Asian alone 406,047 4.7% Two or more races 60,419 0.7% Other race alone 11,738 0.1% American Indian alone 6,869 0.08% Native Hawaiian and Other
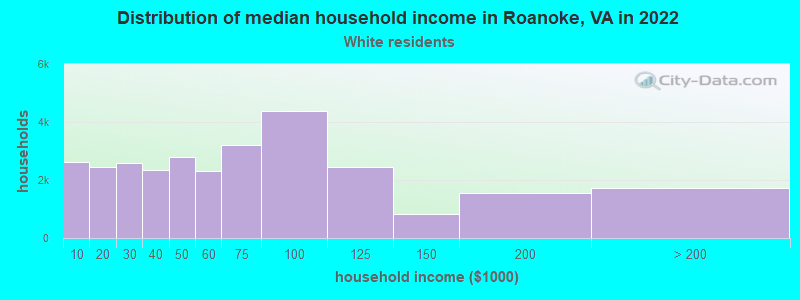
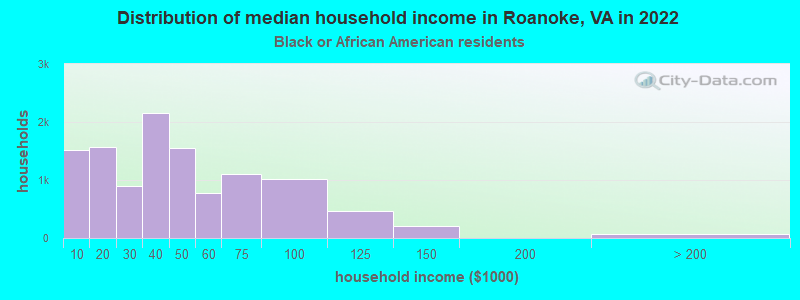
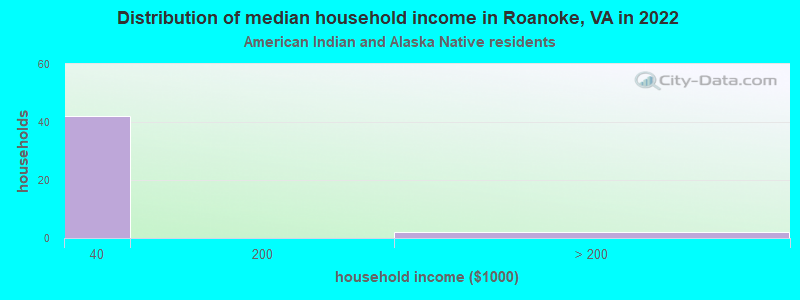
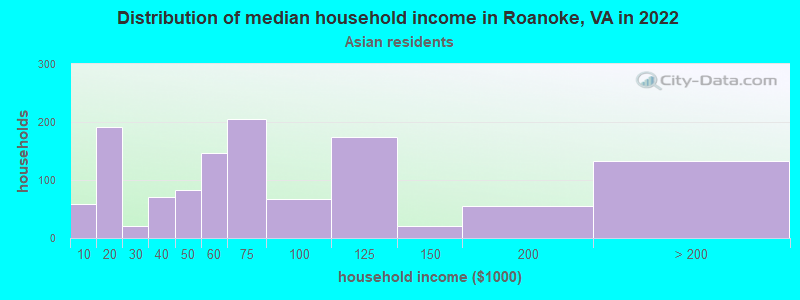
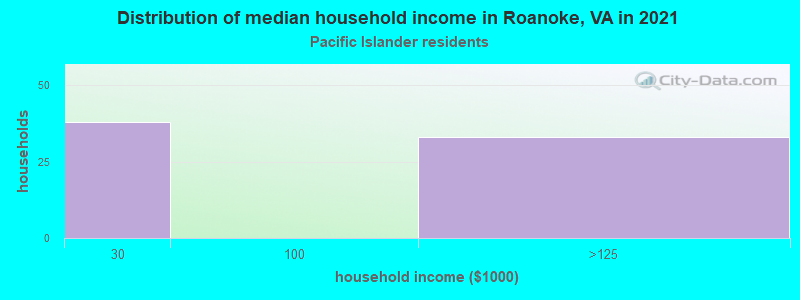
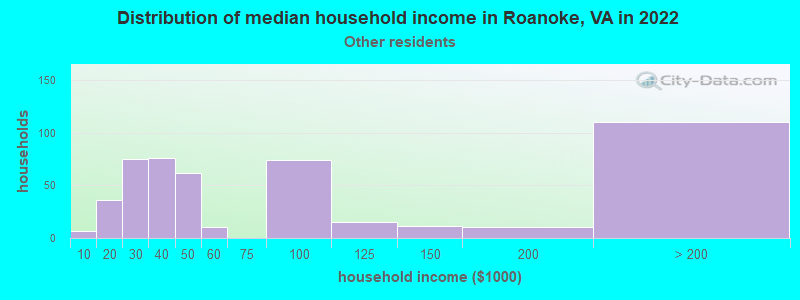
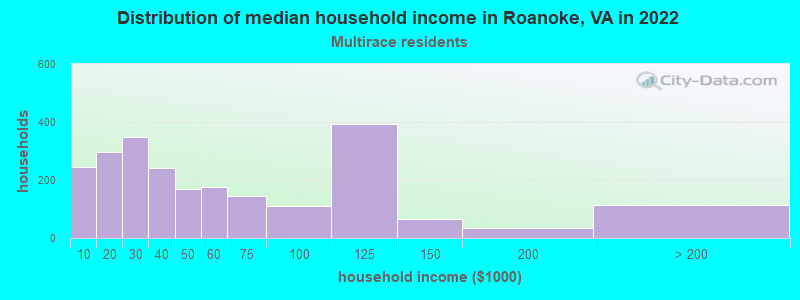
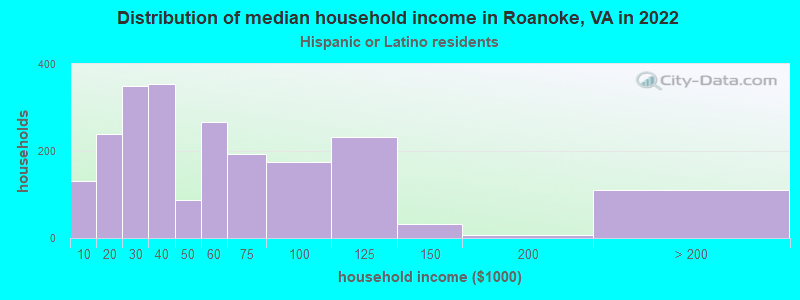
Income and house value in Roanoke Median household income in 2022 $56,685 White non-Hispanic householders$37,146 Black householders$71,158 Asian householders$39,742 Some other race householders$53,183 Two or more races householders$43,105 Hispanic or Latino race householdersMedian 2022 house value $194,161 White Non-Hispanic householders$148,139 Black or African American householders$257,584 American Indian or Alaska Native householders $181,797 Asian householders$194,619 Native Hawaiian and other Pacific Islander householders$234,687 Some other race householders$168,975 Two or more races householders$339,324 Hispanic or Latino householders
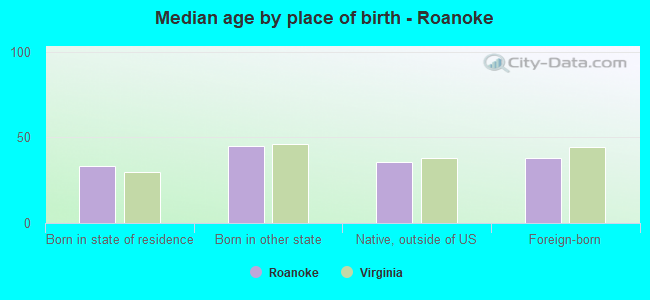
Median age by race in Roanoke
42.8 Median age for White residents42.3 43.7 37.1 Median age for Black or African American residents34.6 37.9 -666,666,666.0 Median age for American Indian / Alaska Native residents-666,666,666.0 -666,666,666.0 33.5 Median age for Asian residents39.3 33.4 -666,666,666.0 Median age for Native Hawaiian / Pacific Islander residents-666,666,666.0 -666,666,666.0 33.1 Median age for Other race residents26.7 34.2 23.9 Median age for Two or more races residents25.8 22.2 43.0 Median age for White alone residents42.6 44.1 28.5 Median age for Hispanic or Latino residents26.9 33.8
Owner/renter occupied households by race in Roanoke
House owners and renters - White residents 16,829 57.5% Owner occupied12,437 42.5% Renter occupiedHouse owners and renters - Black or African American residents 3,660 32.4% Owner occupied7,623 67.6% Renter occupiedHouse owners and renters - American Indian / Alaska Native residents 59 100.0% Owner occupiedHouse owners and renters - Asian residents 280 37.7% Owner occupied463 62.3% Renter occupiedHouse owners and renters - Native Hawaiian / Pacific Islander residents 32 42.6% Owner occupied42 57.4% Renter occupiedHouse owners and renters - Other race residents 448 38.3% Owner occupied723 61.7% Renter occupiedHouse owners and renters - Two or more races residents 1,248 60.0% Owner occupied832 40.0% Renter occupiedHouse owners and renters - White alone residents 16,737 57.4% Owner occupied12,437 42.6% Renter occupiedHouse owners and renters - Hispanic or Latino residents 887 43.0% Owner occupied1,174 57.0% Renter occupied
Language usage in Roanoke
English speakers - Total 87.3% of residents of Roanoke speak English at home.
6.4% of residents speak Spanish at home 3,469 58.9% Speak English very well2,417 41.1% Speak English less than very well6.3% of residents speak other language at home 3,157 54.8% Speak English very well2,609 45.2% Speak English less than very well
English speakers - Born in the United States 95.5% of residents of Roanoke speak English at home.
3.6% of residents speak Spanish at home 805 82.1% Speak English very well175 17.9% Speak English less than very well0.9% of residents speak other language at home 233 100.0% Speak English very well
English speakers - Native, born elsewhere 43.5% of residents of Roanoke speak English at home.
44.0% of residents speak Spanish at home 137 53.9% Speak English very well117 46.1% Speak English less than very well12.5% of residents speak other language at home 72 100.0% Speak English very well
English speakers - Foreign-born 12.9% of residents of Roanoke speak English at home.
32.6% of residents speak Spanish at home 786 27.4% Speak English very well2,083 72.6% Speak English less than very well54.5% of residents speak other language at home 2,424 50.5% Speak English very well2,375 49.5% Speak English less than very well
White (Caucasian) - Speak only English Native:
98.4% (50,898)Foreign-born:
75.3% (434)
White (Caucasian) - Speak another language Native:
1.6% (843)Foreign-born:
24.7% (142)
Black or African American - Speak only English Native:
96.5% (23,675)Foreign-born:
12.9% (300)
Black or African American - Speak another language Native:
3.5% (855)Foreign-born:
87.1% (2,023)
Asian - Speak only English Native:
50.5% (333)Foreign-born:
11.1% (274)
Asian - Speak another language Native:
49.6% (327)Foreign-born:
88.7% (2,198)
Other race - Speak another language Native:
63.8% (1,328)Foreign-born:
100.0% (1,907)
Two or more races - Speak only English Native:
83.9% (3,777)Foreign-born:
6.8% (90)
Two or more races - Speak another language Native:
16.1% (725)Foreign-born:
93.2% (1,240)
White alone - Speak only English Native:
98.4% (50,677)Foreign-born:
75.3% (434)
White alone - Speak another language Native:
1.6% (809)Foreign-born:
24.7% (142)
Hispanic or Latino - Speak only English Native:
41.7% (1,636)Foreign-born:
3.0% (90)
Hispanic or Latino - Speak another language Native:
58.3% (2,283)Foreign-born:
97.0% (2,869)
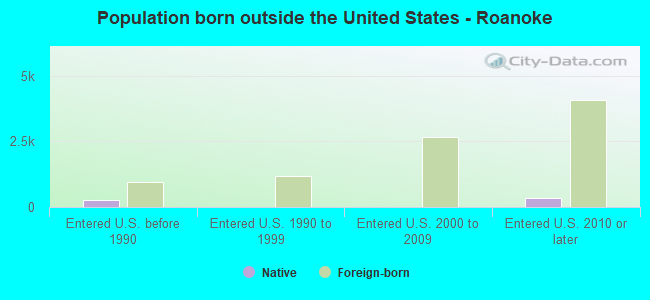
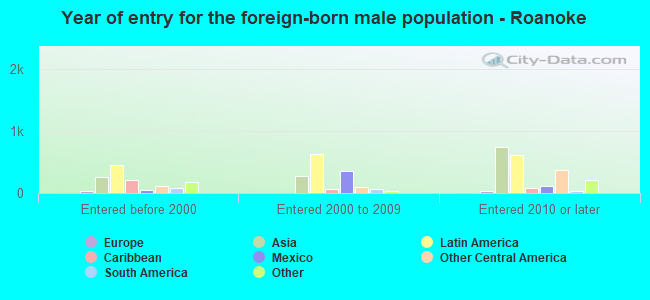
Foreign-born residents in Roanoke 6,970 residents are foreign born (2.9% Latin America , 2.8% Asia ).
This city:
7.0%Virginia:
12.6%
Marital status for residents in Roanoke Marital status - White (Caucasian) population 15 years and over
Males 34.1% Never married44.9% Now married0.7% Separated4.4% Widowed15.9% DivorcedFemales 33.4% Never married38.4% Now married3.5% Separated11.5% Widowed13.1% DivorcedWomen who gave birth in the past 12 months Now married:
52.0% (186)Unmarried:
48.0% (172)
Women who did not give birth in the past 12 months Now married:
37.0% (4,201)Unmarried:
63.0% (7,142)
Marital status - Black or African American population 15 years and over
Males 63.4% Never married19.6% Now married3.1% Separated1.8% Widowed12.1% DivorcedFemales 58.9% Never married13.2% Now married6.6% Separated12.4% Widowed8.9% DivorcedWomen who gave birth in the past 12 months Now married:
32.3% (41)Unmarried:
67.7% (87)
Women who did not give birth in the past 12 months Now married:
17.6% (1,220)Unmarried:
82.4% (5,693)
Marital status - American Indian / Alaska Native population 15 years and over
Males 19.0% Never married0.0% Now married0.0% Separated81.0% Widowed0.0% DivorcedFemales 71.4% Never married0.0% Now married0.0% Separated0.0% Widowed28.6% DivorcedWomen who did not give birth in the past 12 months Now married:
0.0% (0)Unmarried:
100.0% (43)
Marital status - Asian population 15 years and over
Males 36.2% Never married51.7% Now married0.0% Separated1.6% Widowed10.5% DivorcedFemales 23.0% Never married64.0% Now married1.2% Separated9.4% Widowed2.4% DivorcedWomen who gave birth in the past 12 months Now married:
100.0% (60)Unmarried:
0.0% (0)
Women who did not give birth in the past 12 months Now married:
54.7% (479)Unmarried:
45.3% (396)
Marital status - Native Hawaiian / Pacific Islander population 15 years and over
Males 40.7% Never married59.3% Now married0.0% Separated0.0% Widowed0.0% DivorcedFemales 100.0% Never married0.0% Now married0.0% Separated0.0% Widowed0.0% DivorcedWomen who did not give birth in the past 12 months Now married:
0.0% (0)Unmarried:
100.0% (46)
Marital status - Other race population 15 years and over
Males 73.3% Never married8.3% Now married0.0% Separated1.7% Widowed16.8% DivorcedFemales 53.0% Never married19.5% Now married8.4% Separated0.0% Widowed19.1% DivorcedWomen who gave birth in the past 12 months Now married:
80.0% (21)Unmarried:
20.0% (5)
Women who did not give birth in the past 12 months Now married:
28.3% (137)Unmarried:
71.7% (346)
Marital status - Two or more races population 15 years and over
Males 61.7% Never married26.5% Now married0.4% Separated3.3% Widowed8.1% DivorcedFemales 56.3% Never married22.0% Now married0.0% Separated7.9% Widowed13.8% DivorcedWomen who gave birth in the past 12 months Now married:
32.8% (96)Unmarried:
67.2% (197)
Women who did not give birth in the past 12 months Now married:
32.0% (528)Unmarried:
68.0% (1,121)
Marital status - White alone, not Hispanic / Latino population 15 years and over
Males 34.4% Never married44.5% Now married0.7% Separated4.4% Widowed16.0% DivorcedFemales 33.5% Never married38.4% Now married3.6% Separated11.6% Widowed13.0% DivorcedWomen who gave birth in the past 12 months Now married:
52.0% (186)Unmarried:
48.0% (172)
Women who did not give birth in the past 12 months Now married:
36.8% (4,143)Unmarried:
63.2% (7,108)
Marital status - Hispanic or Latino population 15 years and over
Males 53.0% Never married47.0% Now married0.0% Separated0.0% Widowed0.0% DivorcedFemales 40.5% Never married28.3% Now married12.0% Separated4.3% Widowed14.8% DivorcedWomen who gave birth in the past 12 months Now married:
44.1% (64)Unmarried:
55.9% (81)
Women who did not give birth in the past 12 months Now married:
35.7% (571)Unmarried:
64.3% (1,030)
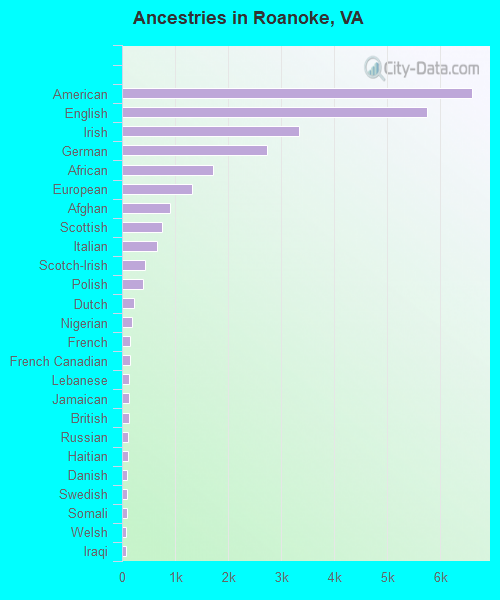
Ancestries in Roanoke
6,588 12.3% American5,755 10.8% English3,330 6.2% Irish2,739 5.1% German1,707 3.2% African1,318 2.5% European912 1.7% Afghan749 1.4% Scottish659 1.2% Italian425 0.8% Scotch-Irish397 0.7% Polish219 0.4% Dutch192 0.4% Nigerian157 0.3% French142 0.3% French Canadian138 0.3% Lebanese135 0.3% Jamaican134 0.3% British117 0.2% Russian105 0.2% Haitian99 0.2% Danish93 0.2% Swedish91 0.2% Somali84 0.2% Welsh79 0.1% Iraqi73 0.1% Ghanaian68 0.1% Sierra Leonean58 0.1% Eastern European55 0.1% Romanian53 0.10% South African47 0.09% Egyptian45 0.08% Canadian39 0.07% Norwegian38 0.07% Greek37 0.07% Austrian33 0.06% Hungarian32 0.06% Northern European31 0.06% Armenian30 0.06% Arab29 0.05% Palestinian29 0.05% Yugoslavian24 0.04% Sudanese22 0.04% Czech18 0.03% Scandinavian14 0.03% Brazilian13 0.02% Slavic12 0.02% Latvian10 0.02% Iranian10 0.02% U.S. Virgin Islander9 0.02% Croatian7 0.01% Slovak7 0.01% Turkish4 0.01% Lithuanian
Geographical mobility in Roanoke Same house 1 year ago 48,981 89.4% White (Caucasian)26,605 92.6% Black or African American80 69.6% American Indian / Alaska Native2,809 85.0% Asian118 95.3% Native Hawaiian / Pacific Islander2,031 92.4% Other race7,067 84.3% Two or more races48,726 89.4% White alone, not Hispanic / Latino5,805 81.3% Hispanic or LatinoMoved within same county 2,730 5.0% White / Caucasian1,236 4.3% Black or African American16 14.3% American Indian / Alaska Native116 3.5% Asian87 4.0% Other race723 8.6% Two or more races2,730 5.0% White alone, not Hispanic / Latino654 9.2% Hispanic or LatinoMoved within same state 1,859 3.4% White / Caucasian308 1.1% Black or African American207 6.3% Asian66 3.0% Other race415 5.0% Two or more races1,859 3.4% White alone, not Hispanic / Latino343 4.8% Hispanic or LatinoMoved from different state 1,204 2.2% White / Caucasian494 1.7% Black or African American21 18.0% American Indian / Alaska Native150 4.5% Asian26 1.2% Other race115 1.4% Two or more races1,204 2.2% White alone, not Hispanic / Latino176 2.5% Hispanic or LatinoMoved from abroad 84 0.3% Black or African American56 0.7% Two or more races143 2.0% Hispanic or Latino
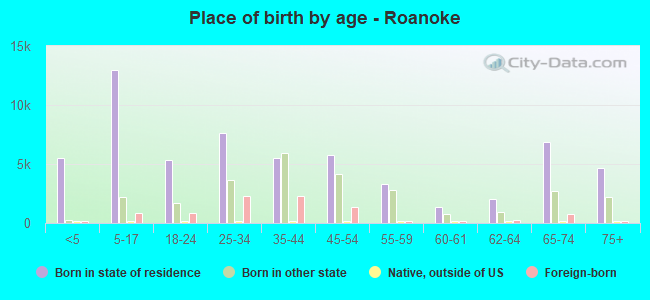
Children Nativity (place of birth) in Roanoke
Children under 6 years - Living with two parents Both parents native 2,504 100.0% Native1 0.0% Foreign-bornBoth parents foreign-born 215 64.3% Native120 35.7% Foreign-bornOne native, one foreign-born parent 150 100.0% NativeChildren under 6 years - Living with one parent Native parent 3,873 99.4% Native25 0.6% Foreign-bornForeign-born parent 591 97.3% Native16 2.7% Foreign-bornChildren 6 to 17 years - Living with two parents Both parents native 4,539 99.9% Native6 0.1% Foreign-bornBoth parents foreign-born 424 52.8% Native378 47.2% Foreign-bornOne native, one foreign-born parent 164 100.0% NativeChildren 6 to 17 years - Living with one parent Native parent 7,161 100.0% NativeForeign-born parent 788 53.9% Native673 46.1% Foreign-born
Grandparents responsible for own grandchildren in Roanoke
Grandparents (30 to 59 years) White / Caucasian 142 36.9% Responsible for grandchildren243 63.1% Not responsible for grandchildrenBlack or African American 82 38.2% Responsible for grandchildren132 61.8% Not responsible for grandchildrenTwo or more races 93 100.0% Not responsible for grandchildrenWhite alone, not Hispanic / Latino 145 34.8% Responsible for grandchildren271 65.2% Not responsible for grandchildrenGrandparents (60 years and over) White / Caucasian 307 72.3% Responsible for grandchildren117 27.7% Not responsible for grandchildrenBlack or African American 72 35.5% Responsible for grandchildren130 64.5% Not responsible for grandchildrenTwo or more races 111 100.0% Not responsible for grandchildrenWhite alone, not Hispanic / Latino 311 71.5% Responsible for grandchildren124 28.5% Not responsible for grandchildren