Races in Riverton, Wyoming (WY) Detailed Stats
Ancestries, Foreign-born residents, place of birth
Settings
X


Recent posts about races in Riverton, Wyoming on our local forum with over 2,400,000 registered users:
 | If you had a choice on these particular places... (63 replies) |
| Rewards (7 replies) |
| What can you tell me about Story, WY? & a base camp for research (70 replies) |
| Rental house in-between Lander and Riverton? (4 replies) |
| Moves to Wyoming pick up during COVID-19 pandemic (108 replies) |
| So, is Riverton on the reservation? (39 replies) |
Latest news about races in Riverton, WY collected exclusively by city-data.com from local newspapers, TV, and radio stations
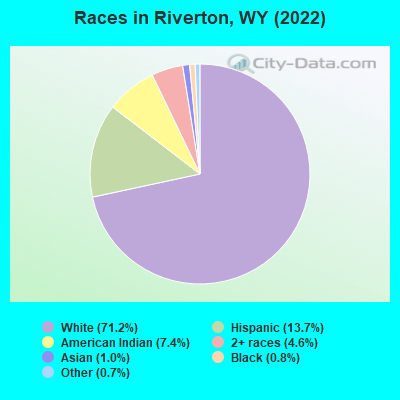
According to 2022 data, the most numerous races in Riverton, WY are White alone (7,684 residents), Hispanic (1,475 residents), and Two or more races (500 residents). 95.0% of Riverton residents speak English at home. 2.2% of Riverton, WY residents are foreign-born (1.3% born in Asia, 0.5% born in Europe, 0.3% born in Latin America), which is 35.0% less than the foreign-born rate of 3.0% across the entire state of Wyoming.
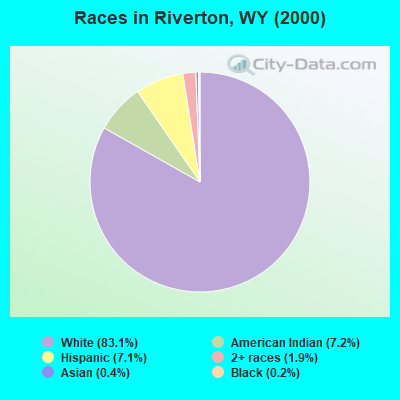
Race distribution in Riverton
2000
2022

- 7,73683.1%White alone
- 6707.2%American Indian alone
- 6607.1%Hispanic
- 1791.9%Two or more races
- 400.4%Asian alone
- 160.2%Black alone
- 70.08%Other race alone
- 20.02%Native Hawaiian and Other
Pacific Islander alone
-
- 7,68471.2%White alone
- 1,47513.7%Hispanic
- 8027.4%American Indian alone
- 5004.6%Two or more races
- 1121.0%Asian alone
- 860.8%Black alone
- 770.7%Other race alone
2000
2022
-
- 438,79988.9%White alone
- 31,6696.4%Hispanic
- 10,2382.1%American Indian alone
- 6,1641.2%Two or more races
- 3,5040.7%Black alone
- 2,6700.5%Asian alone
- 4740.10%Other race alone
- 2640.05%Native Hawaiian and Other
Pacific Islander alone

-
- 473,22081.4%White alone
- 62,80310.8%Hispanic
- 22,9113.9%Two or more races
- 9,5891.6%American Indian alone
- 4,9970.9%Other race alone
- 3,9900.7%Black alone
- 3,5770.6%Asian alone
- 2940.05%Native Hawaiian and Other
Pacific Islander alone

Income and house value in Riverton
- Median household income in 2022
- $48,953White non-Hispanic householders
- $26,283Black householders
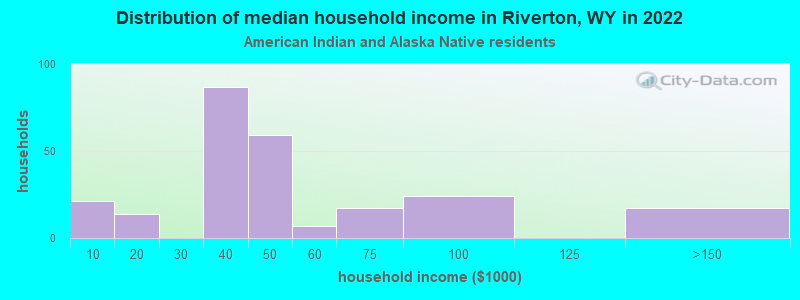
- $31,446American Indian and Alaska Native householders
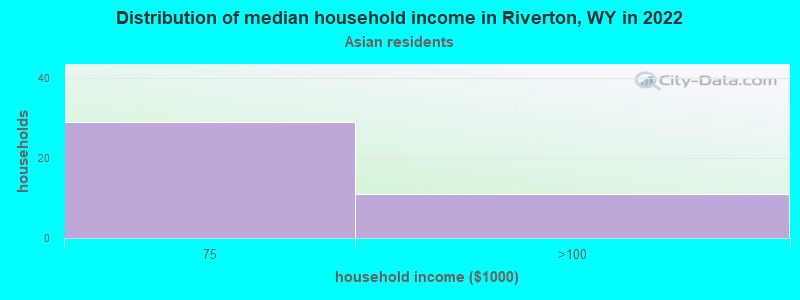
- $93,455Asian householders
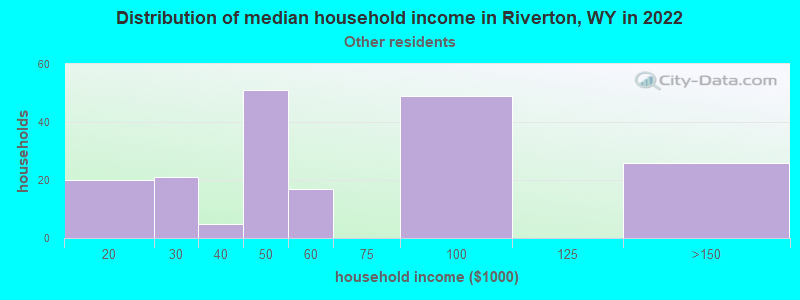
- $44,705Some other race householders
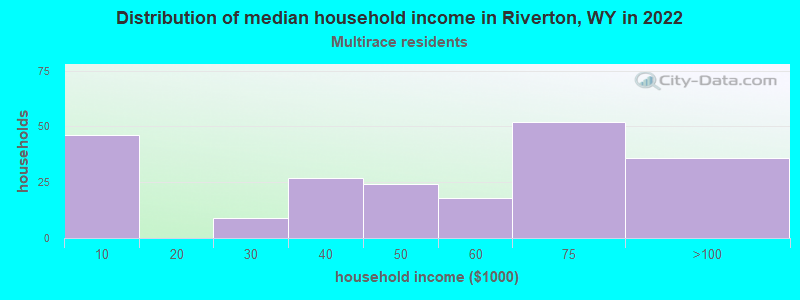
- $50,245Two or more races householders
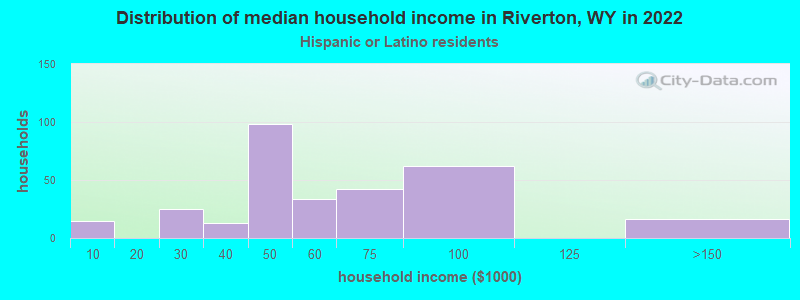
- $56,970Hispanic or Latino race householders
- Median 2022 house value
- $219,707White Non-Hispanic householders
- $175,713American Indian or Alaska Native householders
- $90,095Some other race householders
- $217,336Two or more races householders
- $201,003Hispanic or Latino householders
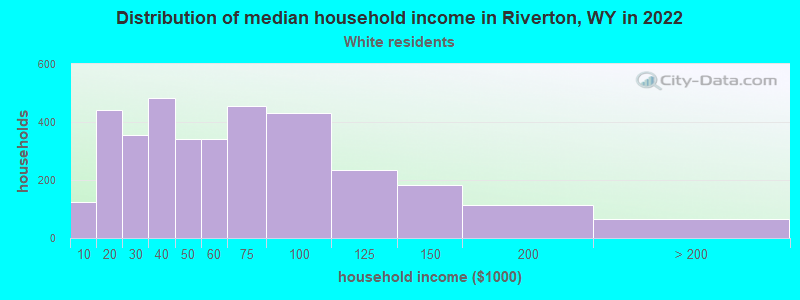
Household income for White non-Hispanic householders
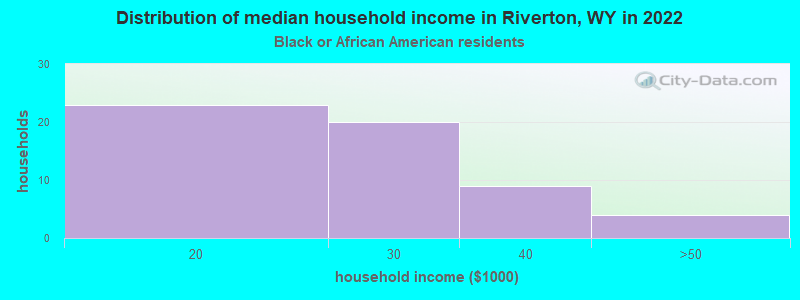
Household income for Black householders
Household income for American Indian and Alaska Native householders
Household income for Asian householders
Household income for Some other race householders
Household income for Two or more races householders
Household income for Hispanic or Latino race householders
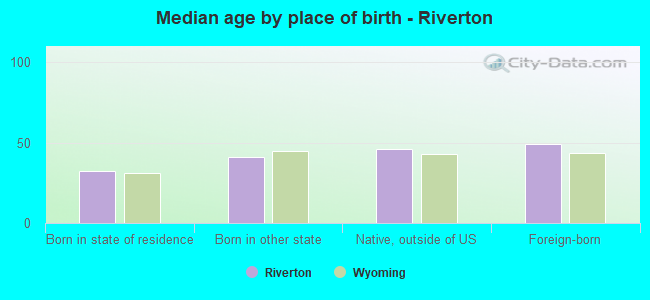
Median age by race in Riverton
- 40.8Median age for White residents
- 40.9Males
- 40.3Females
- 53.9Median age for Black or African American residents
- 45.8Males
- -746,302,615.9Females
- 22.1Median age for American Indian / Alaska Native residents
- 12.4Males
- 26.0Females
- 25.2Median age for Asian residents
- 21.4Males
- 56.0Females
- -594,708,994.1Median age for Native Hawaiian / Pacific Islander residents
- -652,729,383.8Males
- -865,828,091.4Females
- 27.1Median age for Other race residents
- 28.7Males
- 34.7Females
- 25.5Median age for Two or more races residents
- 11.6Males
- 35.3Females
- 42.9Median age for White alone residents
- 41.9Males
- 44.6Females
- 20.1Median age for Hispanic or Latino residents
- 20.6Males
- 17.2Females
Owner/renter occupied households by race in Riverton
- House owners and renters - White residents
- 2,20263.2%Owner occupied
- 1,28436.8%Renter occupied
- House owners and renters - Black or African American residents
- 56100.0%Renter occupied
- House owners and renters - American Indian / Alaska Native residents
- 6123.3%Owner occupied
- 20276.7%Renter occupied
- House owners and renters - Asian residents
- 26100.0%Owner occupied
- House owners and renters - Other race residents
- 6132.1%Owner occupied
- 12967.9%Renter occupied
- House owners and renters - Two or more races residents
- 20478.7%Owner occupied
- 5521.3%Renter occupied
- House owners and renters - White alone residents
- 2,23064.0%Owner occupied
- 1,25436.0%Renter occupied
- House owners and renters - Hispanic or Latino residents
- 12843.5%Owner occupied
- 16756.5%Renter occupied
Language usage in Riverton
- English speakers - Total
- 95.0% of residents of Riverton speak English at home.
- 2.8% of residents speak Spanish at home
- 27595.8%Speak English very well
- 124.2%Speak English less than very well
- 1.9% of residents speak other language at home
- 19397.5%Speak English very well
- 52.5%Speak English less than very well
- English speakers - Born in the United States
- 96.9% of residents of Riverton speak English at home.
- 1.4% of residents speak Spanish at home
- 65100.0%Speak English very well
- 1.5% of residents speak other language at home
- 67100.0%Speak English very well
- English speakers - Native, born elsewhere
- 98.6% of residents of Riverton speak English at home.
- 2.8% of residents speak other language at home
- 2100.0%Speak English very well
- English speakers - Foreign-born
- 34.0% of residents of Riverton speak English at home.
- 9.9% of residents speak Spanish at home
- 942.9%Speak English very well
- 1257.1%Speak English less than very well
- 47.2% of residents speak other language at home
- 9494.0%Speak English very well
- 66.0%Speak English less than very well
White (Caucasian) - Speak only English
| Native: | 100.0% (7,635) |
| Foreign-born: | 62.2% (28) |
White (Caucasian) - Speak another language
| Native: | 0.5% (39) |
| Foreign-born: | 41.2% (18) |
Black or African American - Speak only English
| Native: | 85.6% (70) |
| Foreign-born: | 97.4% (10) |
Asian - Speak only English
| Native: | 89.3% (8) |
| Foreign-born: | 43.6% (52) |
Asian - Speak another language
| Native: | 47.8% (4) |
| Foreign-born: | 59.9% (72) |
Other race - Speak another language
| Native: | 40.5% (270) |
| Foreign-born: | 100.0% (27) |
White alone - Speak only English
| Native: | 99.6% (7,402) |
| Foreign-born: | 52.3% (31) |
White alone - Speak another language
| Native: | 0.6% (47) |
| Foreign-born: | 48.0% (29) |
Hispanic or Latino - Speak another language
| Native: | 21.9% (271) |
| Foreign-born: | 100.0% (21) |
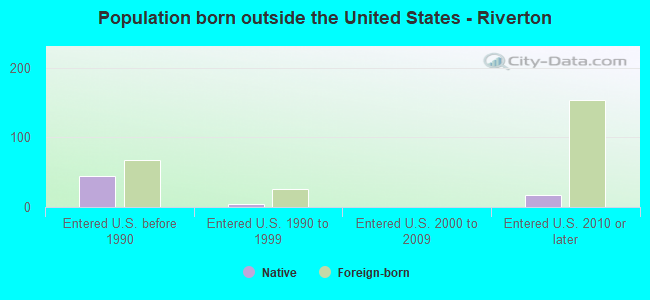
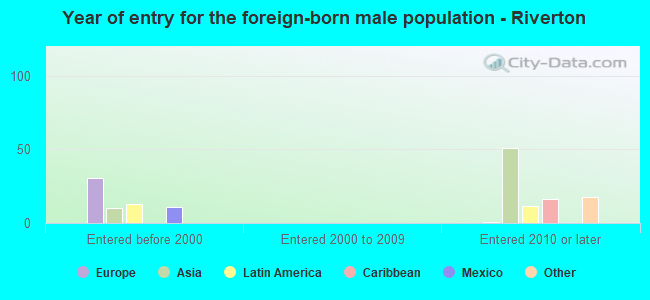
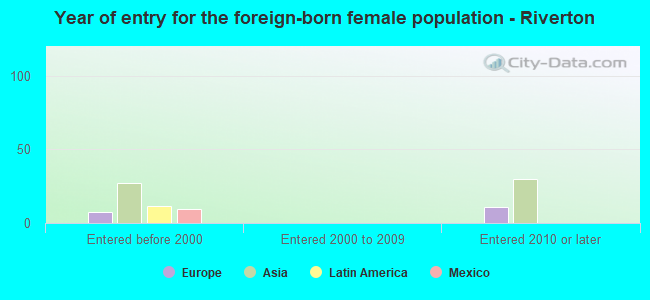
Foreign-born residents in Riverton
240 residents are foreign born (1.3% Asia, 0.5% Europe, 0.3% Latin America).
| This city: | 2.2% |
| Wyoming: | 3.4% |
Marital status for residents in Riverton
Marital status - White (Caucasian) population 15 years and over
- Males
- 33.8%Never married
- 45.8%Now married
- 2.3%Separated
- 4.0%Widowed
- 14.1%Divorced
- Females
- 28.6%Never married
- 43.1%Now married
- 2.6%Separated
- 8.5%Widowed
- 17.2%Divorced
Women who gave birth in the past 12 months
| Now married: | 52.0% (38) |
| Unmarried: | 48.0% (35) |
Women who did not give birth in the past 12 months
| Now married: | 35.8% (595) |
| Unmarried: | 64.2% (1,068) |
Marital status - Black or African American population 15 years and over
- Males
- 42.9%Never married
- 35.7%Now married
- 1.2%Separated
- 3.6%Widowed
- 16.7%Divorced
- Females
- 100.0%Never married
- 0.0%Now married
- 0.0%Separated
- 0.0%Widowed
- 0.0%Divorced
Women who did not give birth in the past 12 months
| Now married: | 0.0% (0) |
| Unmarried: | 100.0% (4) |
Marital status - American Indian / Alaska Native population 15 years and over
- Males
- 56.9%Never married
- 23.0%Now married
- 5.3%Separated
- 0.0%Widowed
- 14.8%Divorced
- Females
- 45.5%Never married
- 18.2%Now married
- 0.0%Separated
- 4.6%Widowed
- 31.7%Divorced
Women who gave birth in the past 12 months
| Now married: | 0.0% (0) |
| Unmarried: | 100.0% (17) |
Women who did not give birth in the past 12 months
| Now married: | 19.5% (55) |
| Unmarried: | 80.5% (226) |
Marital status - Asian population 15 years and over
- Males
- 57.1%Never married
- 27.4%Now married
- 0.0%Separated
- 0.0%Widowed
- 15.5%Divorced
- Females
- 0.0%Never married
- 100.0%Now married
- 0.0%Separated
- 0.0%Widowed
- 0.0%Divorced
Women who did not give birth in the past 12 months
| Now married: | 100.0% (25) |
| Unmarried: | 0.0% (0) |
Marital status - Other race population 15 years and over
- Males
- 47.9%Never married
- 14.3%Now married
- 5.1%Separated
- 9.7%Widowed
- 23.0%Divorced
- Females
- 16.2%Never married
- 3.4%Now married
- 0.0%Separated
- 0.0%Widowed
- 80.3%Divorced
Women who did not give birth in the past 12 months
| Now married: | 4.4% (5) |
| Unmarried: | 95.6% (104) |
Marital status - Two or more races population 15 years and over
- Males
- 60.5%Never married
- 21.0%Now married
- 0.0%Separated
- 9.2%Widowed
- 9.2%Divorced
- Females
- 51.9%Never married
- 29.2%Now married
- 0.0%Separated
- 0.0%Widowed
- 18.8%Divorced
Women who gave birth in the past 12 months
| Now married: | 100.0% (33) |
| Unmarried: | 0.0% (0) |
Women who did not give birth in the past 12 months
| Now married: | 20.0% (45) |
| Unmarried: | 80.0% (178) |
Marital status - White alone, not Hispanic / Latino population 15 years and over
- Males
- 32.7%Never married
- 46.0%Now married
- 2.4%Separated
- 4.2%Widowed
- 14.7%Divorced
- Females
- 27.9%Never married
- 43.5%Now married
- 2.7%Separated
- 8.7%Widowed
- 17.2%Divorced
Women who gave birth in the past 12 months
| Now married: | 52.0% (38) |
| Unmarried: | 48.0% (35) |
Women who did not give birth in the past 12 months
| Now married: | 35.8% (582) |
| Unmarried: | 64.2% (1,044) |
Marital status - Hispanic or Latino population 15 years and over
- Males
- 58.3%Never married
- 25.7%Now married
- 3.1%Separated
- 5.5%Widowed
- 7.3%Divorced
- Females
- 37.1%Never married
- 18.2%Now married
- 0.0%Separated
- 2.3%Widowed
- 42.4%Divorced
Women who did not give birth in the past 12 months
| Now married: | 14.2% (45) |
| Unmarried: | 85.8% (270) |
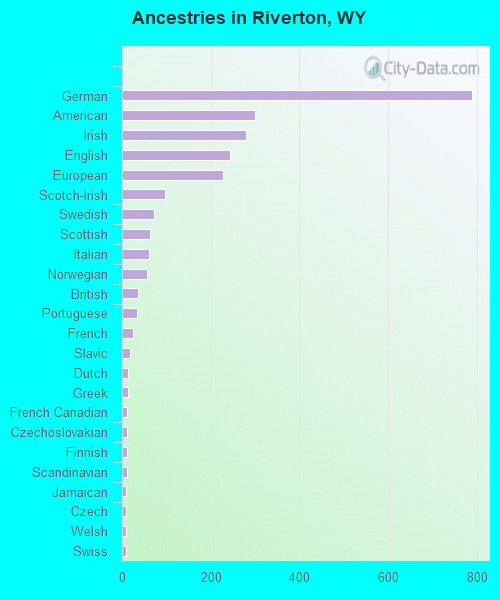
Ancestries in Riverton

- 78817.7%German
- 2996.7%American
- 2806.3%Irish
- 2445.5%English
- 2285.1%European
- 982.2%Scotch-Irish
- 731.6%Swedish
- 621.4%Scottish
- 601.3%Italian
- 571.3%Norwegian
- 370.8%British
- 330.7%Portuguese
- 250.6%French
- 190.4%Slavic
- 140.3%Dutch
- 140.3%Greek
- 120.3%French Canadian
- 110.2%Czechoslovakian
- 110.2%Finnish
- 110.2%Scandinavian
- 100.2%Jamaican
- 90.2%Czech
- 90.2%Welsh
- 80.2%Swiss
- 30.07%Croatian
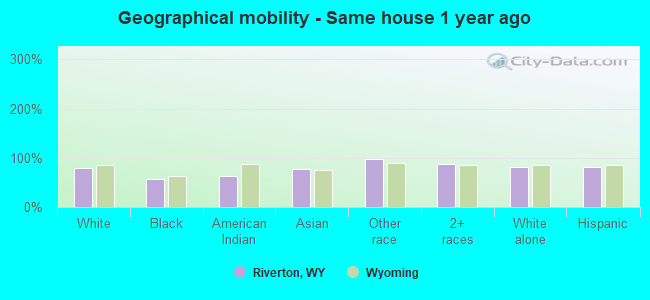
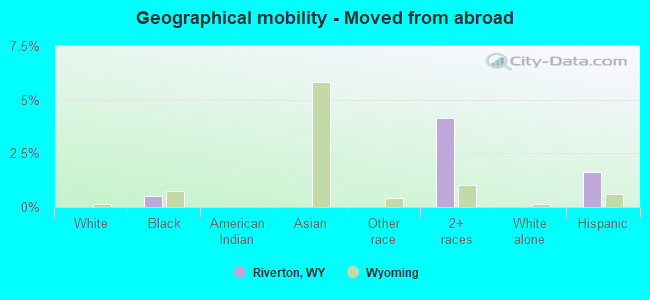
Geographical mobility in Riverton

- Same house 1 year ago
- 6,35179.6%White (Caucasian)
- 4757.8%Black or African American
- 58762.5%American Indian / Alaska Native
- 11376.8%Asian
- 67597.1%Other race
- 79188.2%Two or more races
- 6,17280.9%White alone, not Hispanic / Latino
- 1,18180.9%Hispanic or Latino
-
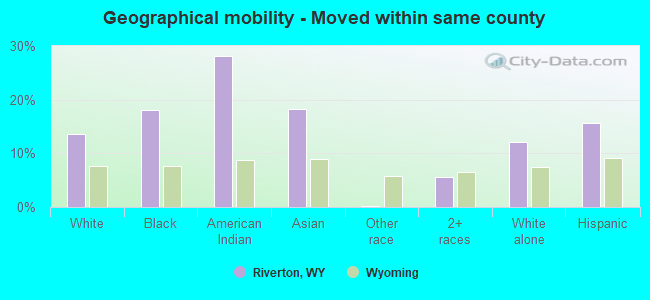
- Moved within same county
- 1,08513.6%White / Caucasian
- 1518.0%Black or African American
- 26428.2%American Indian / Alaska Native
- 2718.2%Asian
- 20.3%Other race
- 505.6%Two or more races
- 92812.2%White alone, not Hispanic / Latino
- 22915.7%Hispanic or Latino
-
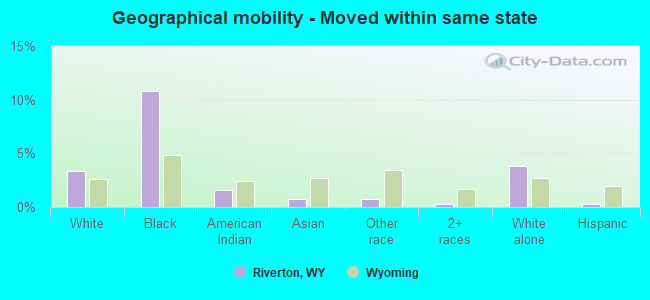
- Moved within same state
- 2703.4%White / Caucasian
- 910.9%Black or African American
- 141.5%American Indian / Alaska Native
- 10.7%Asian
- 50.7%Other race
- 30.3%Two or more races
- 2883.8%White alone, not Hispanic / Latino
- 40.3%Hispanic or Latino
-
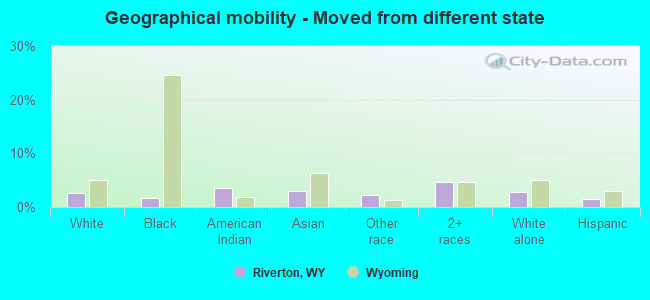
- Moved from different state
- 2112.6%White / Caucasian
- 11.7%Black or African American
- 333.5%American Indian / Alaska Native
- 43.0%Asian
- 162.3%Other race
- 414.6%Two or more races
- 2122.8%White alone, not Hispanic / Latino
- 231.6%Hispanic or Latino
-
- Moved from abroad
- 10.0%White
- 00.5%Black or African American
- 374.1%Two or more races
- 10.0%White alone, not Hispanic / Latino
- 231.6%Hispanic or Latino
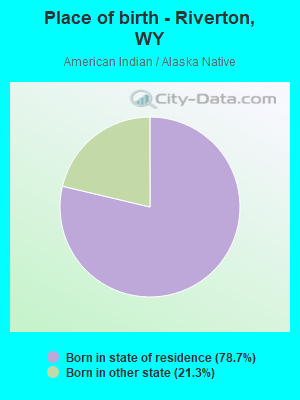
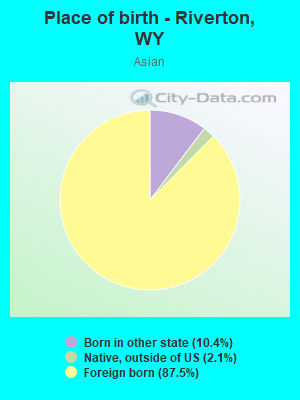
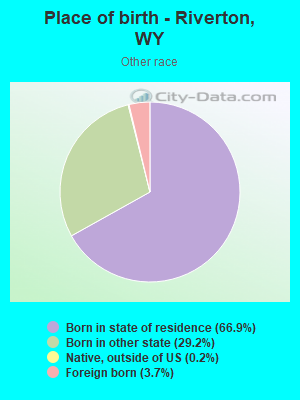
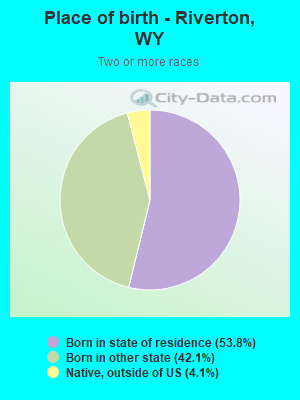
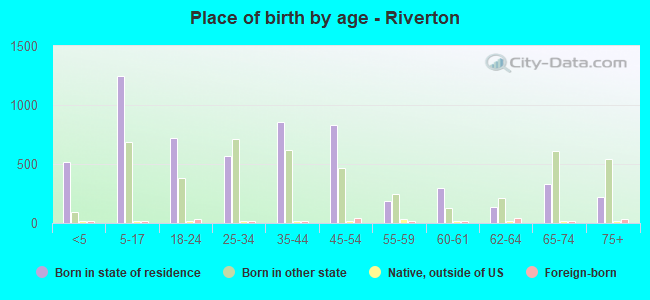
Children Nativity (place of birth) in Riverton
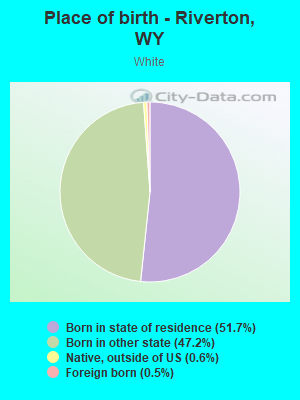
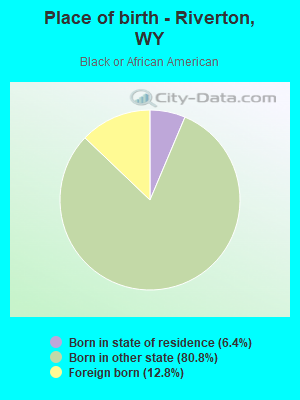
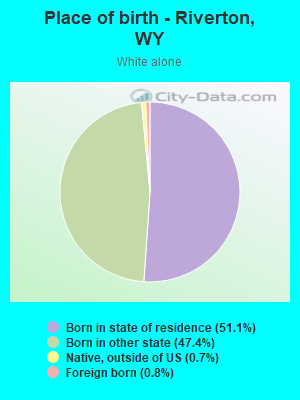
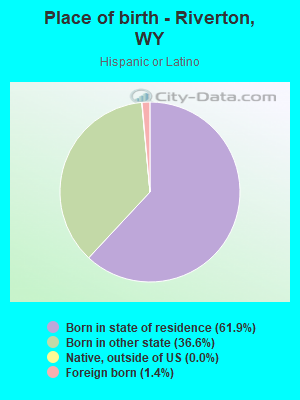
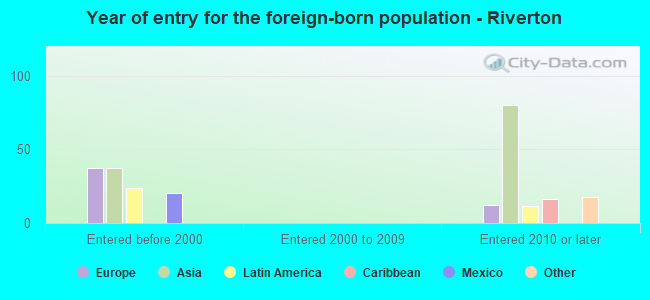
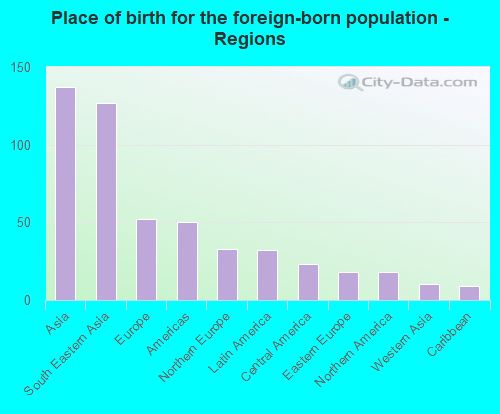
Place of birth for residents in Riverton
![Place of birth for the foreign-born population - Regions]()
- 137Asia
- 127South Eastern Asia
- 52Europe
- 50Americas
- 33Northern Europe
- 32Latin America
- 23Central America
- 18Eastern Europe
- 18Northern America
- 10Western Asia
- 9Caribbean
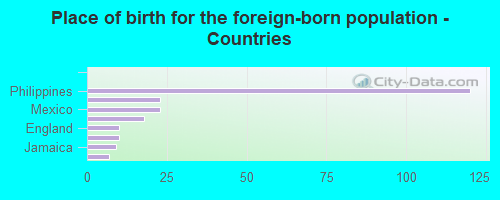
![Place of birth for the foreign-born population - Countries]()
- 120Philippines
- 23Ireland
- 23Mexico
- 18Canada
- 10England
- 10United Arab Emirates
- 9Jamaica
- 7Vietnam
- 1Russia
Grandparents responsible for own grandchildren in Riverton
Zip codes: 82501.