Races in Riverton, Utah (UT) Detailed Stats
Data:
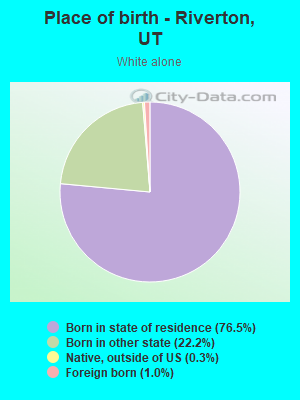
Races - White alone (%)
Races - White alone (% change since 2000)
Races - Black alone (%)
Races - Black alone (% change since 2000)
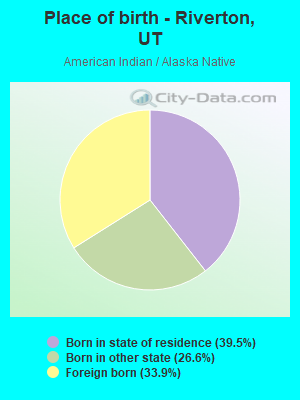
Races - American Indian alone (%)
Races - American Indian alone (% change since 2000)
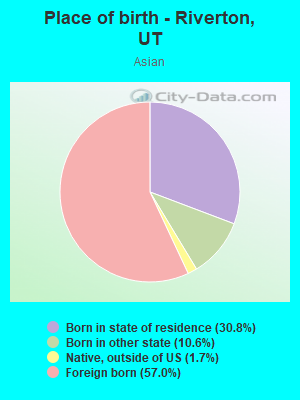
Races - Asian alone (%)
Races - Asian alone (% change since 2000)
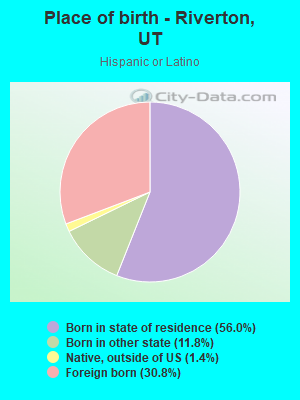
Races - Hispanic (%)
Races - Hispanic (% change since 2000)
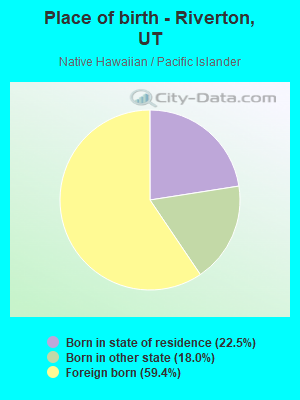
Races - Native Hawaiian and Other Pacific Islander alone (%)
Races - Native Hawaiian and Other Pacific Islander alone (% change since 2000)
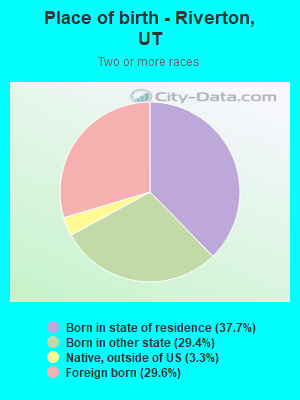
Races - Two or more races(%)
Races - Two or more races(% change since 2000)
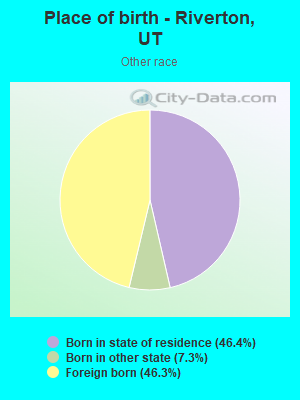
Races - Other race alone (%)
Races - Other race alone (% change since 2000)
Racial diversity
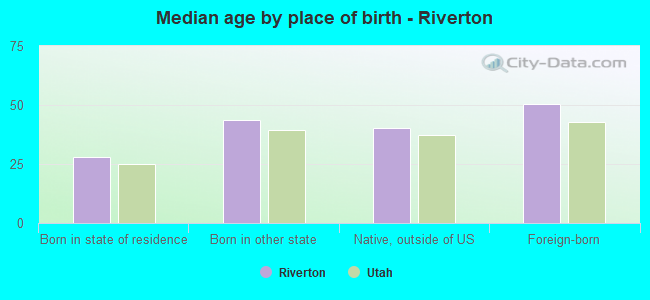
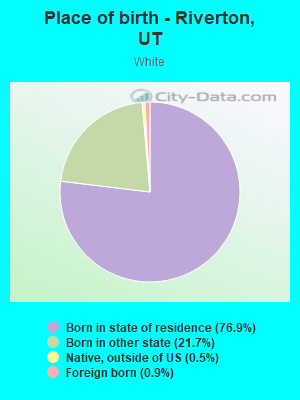
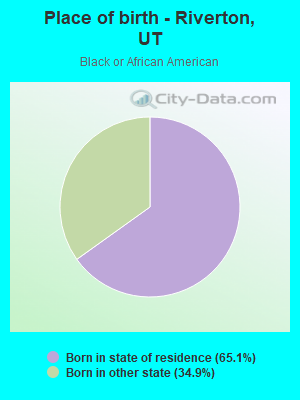
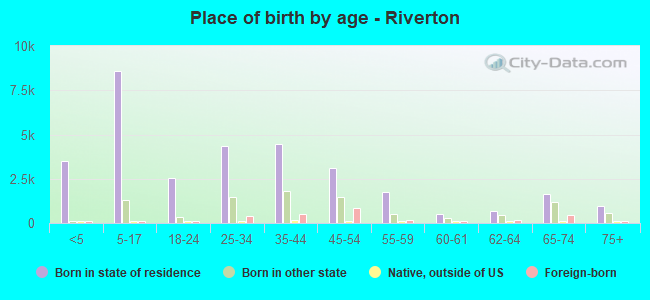
Place of birth - Born in state of residence (%)
Place of birth - Born in state of residence (%) - White
Place of birth - Born in state of residence (%) - Black or African American
Place of birth - Born in state of residence (%) - Asian
Place of birth - Born in state of residence (%) - Hispanic or Latino
Place of birth - Born in state of residence (%) - American Indian and Alaska Native
Place of birth - Born in state of residence (%) - Multirace
Place of birth - Born in state of residence (%) - Other Race
Place of birth - Born in other state (%)
Place of birth - Born in other state (%) - White
Place of birth - Born in other state (%) - Black or African American
Place of birth - Born in other state (%) - Asian
Place of birth - Born in other state (%) - Hispanic or Latino
Place of birth - Born in other state (%) - American Indian and Alaska Native
Place of birth - Born in other state (%) - Multirace
Place of birth - Born in other state (%) - Other Race
Place of birth - Native, outside of US (%)
Place of birth - Native, outside of US (%) - White
Place of birth - Native, outside of US (%) - Black or African American
Place of birth - Native, outside of US (%) - Asian
Place of birth - Native, outside of US (%) - Hispanic or Latino
Place of birth - Native, outside of US (%) - American Indian and Alaska Native
Place of birth - Native, outside of US (%) - Multirace
Place of birth - Native, outside of US (%) - Other Race
Place of birth - Foreign born (%)
Place of birth - Foreign born (%) - White
Place of birth - Foreign born (%) - Black or African American
Place of birth - Foreign born (%) - Asian
Place of birth - Foreign born (%) - Hispanic or Latino
Place of birth - Foreign born (%) - American Indian and Alaska Native
Place of birth - Foreign born (%) - Multirace
Place of birth - Foreign born (%) - Other Race
Residents speaking English at home (%)
Residents speaking English at home - Born in the United States (%)
Residents speaking English at home - Native, born elsewhere (%)
Residents speaking English at home - Foreign born (%)
Residents speaking Spanish at home (%)
Residents speaking Spanish at home - Born in the United States (%)
Residents speaking Spanish at home - Native, born elsewhere (%)
Residents speaking Spanish at home - Foreign born (%)
Residents speaking other language at home (%)
Residents speaking other language at home - Born in the United States (%)
Residents speaking other language at home - Native, born elsewhere (%)
Residents speaking other language at home - Foreign born (%)
Marital status - Never married (%)
Marital status - Now married (%)
Marital status - Separated (%)
Marital status - Widowed (%)
Marital status - Divorced (%)
Ancestries Reported - Arab (%)
Ancestries Reported - Czech (%)
Ancestries Reported - Danish (%)
Ancestries Reported - Dutch (%)
Ancestries Reported - English (%)
Ancestries Reported - French (%)
Ancestries Reported - French Canadian (%)
Ancestries Reported - German (%)
Ancestries Reported - Greek (%)
Ancestries Reported - Hungarian (%)
Ancestries Reported - Irish (%)
Ancestries Reported - Italian (%)
Ancestries Reported - Lithuanian (%)
Ancestries Reported - Norwegian (%)
Ancestries Reported - Polish (%)
Ancestries Reported - Portuguese (%)
Ancestries Reported - Russian (%)
Ancestries Reported - Scotch-Irish (%)
Ancestries Reported - Scottish (%)
Ancestries Reported - Slovak (%)
Ancestries Reported - Subsaharan African (%)
Ancestries Reported - Swedish (%)
Ancestries Reported - Swiss (%)
Ancestries Reported - Ukrainian (%)
Ancestries Reported - United States (%)
Ancestries Reported - Welsh (%)
Ancestries Reported - West Indian (%)
Ancestries Reported - Other (%)
Geographical mobility - Same house 1 year ago (%)
Geographical mobility - Same house 1 year ago (%) - White
Geographical mobility - Same house 1 year ago (%) - Black or African American
Geographical mobility - Same house 1 year ago (%) - Asian
Geographical mobility - Same house 1 year ago (%) - Hispanic or Latino
Geographical mobility - Same house 1 year ago (%) - American Indian and Alaska Native
Geographical mobility - Same house 1 year ago (%) - Multirace
Geographical mobility - Same house 1 year ago (%) - Other Race
Geographical mobility - Moved within same county (%)
Geographical mobility - Moved within same county (%) - White
Geographical mobility - Moved within same county (%) - Black or African American
Geographical mobility - Moved within same county (%) - Asian
Geographical mobility - Moved within same county (%) - Hispanic or Latino
Geographical mobility - Moved within same county (%) - American Indian and Alaska Native
Geographical mobility - Moved within same county (%) - Multirace
Geographical mobility - Moved within same county (%) - Other Race
Geographical mobility - Moved from different county within same state (%)
Geographical mobility - Moved from different county within same state (%) - White
Geographical mobility - Moved from different county within same state (%) - Black or African American
Geographical mobility - Moved from different county within same state (%) - Asian
Geographical mobility - Moved from different county within same state (%) - Hispanic or Latino
Geographical mobility - Moved from different county within same state (%) - American Indian and Alaska Native
Geographical mobility - Moved from different county within same state (%) - Multirace
Geographical mobility - Moved from different county within same state (%) - Other Race
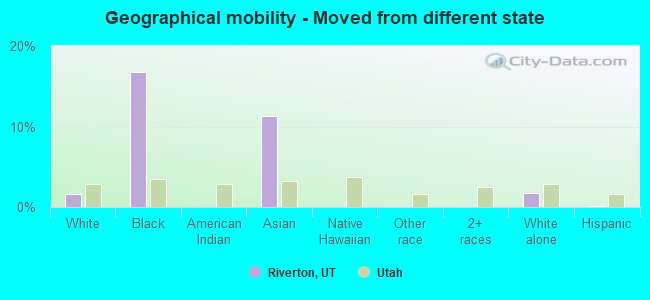
Geographical mobility - Moved from different state (%)
Geographical mobility - Moved from different state (%) - White
Geographical mobility - Moved from different state (%) - Black or African American
Geographical mobility - Moved from different state (%) - Asian
Geographical mobility - Moved from different state (%) - Hispanic or Latino
Geographical mobility - Moved from different state (%) - American Indian and Alaska Native
Geographical mobility - Moved from different state (%) - Multirace
Geographical mobility - Moved from different state (%) - Other Race
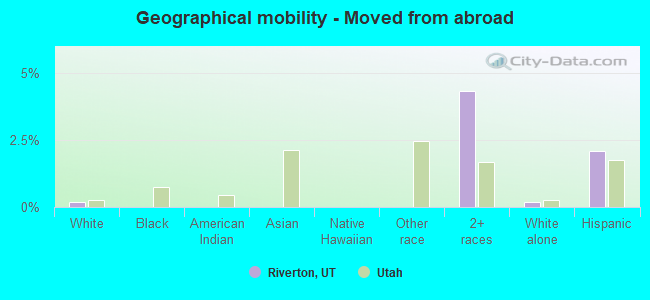
Geographical mobility - Moved from abroad (%)
Geographical mobility - Moved from abroad (%) - White
Geographical mobility - Moved from abroad (%) - Black or African American
Geographical mobility - Moved from abroad (%) - Asian
Geographical mobility - Moved from abroad (%) - Hispanic or Latino
Geographical mobility - Moved from abroad (%) - American Indian and Alaska Native
Geographical mobility - Moved from abroad (%) - Multirace
Geographical mobility - Moved from abroad (%) - Other Race
Place of birth for the foreign-born population - Ireland (%)
Place of birth for the foreign-born population - Denmark (%)
Place of birth for the foreign-born population - Norway (%)
Place of birth for the foreign-born population - Sweden (%)
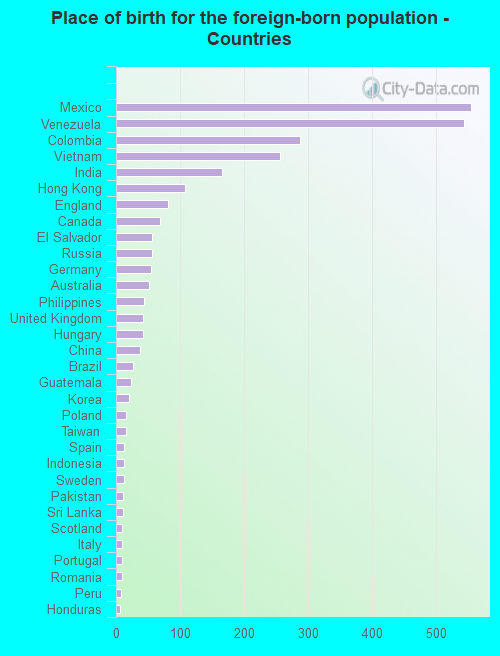
Place of birth for the foreign-born population - United Kingdom (%)
Place of birth for the foreign-born population - England (%)
Place of birth for the foreign-born population - Scotland (%)
Place of birth for the foreign-born population - Other Northern Europe (%)
Place of birth for the foreign-born population - Austria (%)
Place of birth for the foreign-born population - Belgium (%)
Place of birth for the foreign-born population - France (%)
Place of birth for the foreign-born population - Germany (%)
Place of birth for the foreign-born population - Netherlands (%)
Place of birth for the foreign-born population - Switzerland (%)
Place of birth for the foreign-born population - Other Western Europe (%)
Place of birth for the foreign-born population - Greece (%)
Place of birth for the foreign-born population - Italy (%)
Place of birth for the foreign-born population - Portugal (%)
Place of birth for the foreign-born population - Spain (%)
Place of birth for the foreign-born population - Other Southern Europe (%)
Place of birth for the foreign-born population - Albania (%)
Place of birth for the foreign-born population - Belarus (%)
Place of birth for the foreign-born population - Bosnia and Herzegovina (%)
Place of birth for the foreign-born population - Bulgaria (%)
Place of birth for the foreign-born population - Croatia (%)
Place of birth for the foreign-born population - Czechoslovakia (%)
Place of birth for the foreign-born population - Hungary (%)
Place of birth for the foreign-born population - Latvia (%)
Place of birth for the foreign-born population - Lithuania (%)
Place of birth for the foreign-born population - North Macedonia (Macedonia) (%)
Place of birth for the foreign-born population - Moldova (%)
Place of birth for the foreign-born population - Poland (%)
Place of birth for the foreign-born population - Romania (%)
Place of birth for the foreign-born population - Russia (%)
Place of birth for the foreign-born population - Serbia (%)
Place of birth for the foreign-born population - Ukraine (%)
Place of birth for the foreign-born population - Other Eastern Europe (%)
Place of birth for the foreign-born population - China (%)
Place of birth for the foreign-born population - Hong Kong (%)
Place of birth for the foreign-born population - Taiwan (%)
Place of birth for the foreign-born population - Japan (%)
Place of birth for the foreign-born population - Korea (%)
Place of birth for the foreign-born population - Other Eastern Asia (%)
Place of birth for the foreign-born population - Afghanistan (%)
Place of birth for the foreign-born population - Bangladesh (%)
Place of birth for the foreign-born population - India (%)
Place of birth for the foreign-born population - Iran (%)
Place of birth for the foreign-born population - Kazakhstan (%)
Place of birth for the foreign-born population - Nepal (%)
Place of birth for the foreign-born population - Pakistan (%)
Place of birth for the foreign-born population - Sri Lanka (%)
Place of birth for the foreign-born population - Uzbekistan (%)
Place of birth for the foreign-born population - Other South Central Asia (%)
Place of birth for the foreign-born population - Burma (%)
Place of birth for the foreign-born population - Cambodia (%)
Place of birth for the foreign-born population - Indonesia (%)
Place of birth for the foreign-born population - Laos (%)
Place of birth for the foreign-born population - Malaysia (%)
Place of birth for the foreign-born population - Philippines (%)
Place of birth for the foreign-born population - Singapore (%)
Place of birth for the foreign-born population - Thailand (%)
Place of birth for the foreign-born population - Vietnam (%)
Place of birth for the foreign-born population - Other South Eastern Asia (%)
Place of birth for the foreign-born population - Armenia (%)
Place of birth for the foreign-born population - Iraq (%)
Place of birth for the foreign-born population - Israel (%)
Place of birth for the foreign-born population - Jordan (%)
Place of birth for the foreign-born population - Kuwait (%)
Place of birth for the foreign-born population - Lebanon (%)
Place of birth for the foreign-born population - Saudi Arabia (%)
Place of birth for the foreign-born population - Syria (%)
Place of birth for the foreign-born population - Turkey (%)
Place of birth for the foreign-born population - Yemen (%)
Place of birth for the foreign-born population - Other Western Asia (%)
Place of birth for the foreign-born population - Eritrea (%)
Place of birth for the foreign-born population - Ethiopia (%)
Place of birth for the foreign-born population - Kenya (%)
Place of birth for the foreign-born population - Somalia (%)
Place of birth for the foreign-born population - Uganda (%)
Place of birth for the foreign-born population - Zimbabwe (%)
Place of birth for the foreign-born population - Other Eastern Africa (%)
Place of birth for the foreign-born population - Cameroon (%)
Place of birth for the foreign-born population - Congo (%)
Place of birth for the foreign-born population - Democratic Republic of Congo (Zaire) (%)
Place of birth for the foreign-born population - Other Middle Africa (%)
Place of birth for the foreign-born population - Egypt (%)
Place of birth for the foreign-born population - Morocco (%)
Place of birth for the foreign-born population - Sudan (%)
Place of birth for the foreign-born population - Other Northern Africa (%)
Place of birth for the foreign-born population - South Africa (%)
Place of birth for the foreign-born population - Other Southern Africa (%)
Place of birth for the foreign-born population - Cabo Verde (%)
Place of birth for the foreign-born population - Ghana (%)
Place of birth for the foreign-born population - Liberia (%)
Place of birth for the foreign-born population - Nigeria (%)
Place of birth for the foreign-born population - Senegal (%)
Place of birth for the foreign-born population - Sierra Leone (%)
Place of birth for the foreign-born population - Other Western Africa (%)
Place of birth for the foreign-born population - Australia (%)
Place of birth for the foreign-born population - New Zealand (%)
Place of birth for the foreign-born population - Fiji (%)
Place of birth for the foreign-born population - Micronesia (%)
Place of birth for the foreign-born population - Bahamas (%)
Place of birth for the foreign-born population - Barbados (%)
Place of birth for the foreign-born population - Cuba (%)
Place of birth for the foreign-born population - Dominica (%)
Place of birth for the foreign-born population - Dominican Republic (%)
Place of birth for the foreign-born population - Grenada (%)
Place of birth for the foreign-born population - Haiti (%)
Place of birth for the foreign-born population - Jamaica (%)
Place of birth for the foreign-born population - St. Vincent and the Grenadines (%)
Place of birth for the foreign-born population - Trinidad and Tobago (%)
Place of birth for the foreign-born population - West Indies (%)
Place of birth for the foreign-born population - Other Caribbean (%)
Place of birth for the foreign-born population - Belize (%)
Place of birth for the foreign-born population - Costa Rica (%)
Place of birth for the foreign-born population - El Salvador (%)
Place of birth for the foreign-born population - Guatemala (%)
Place of birth for the foreign-born population - Honduras (%)
Place of birth for the foreign-born population - Mexico (%)
Place of birth for the foreign-born population - Nicaragua (%)
Place of birth for the foreign-born population - Panama (%)
Place of birth for the foreign-born population - Other Central America (%)
Place of birth for the foreign-born population - Argentina (%)
Place of birth for the foreign-born population - Bolivia (%)
Place of birth for the foreign-born population - Brazil (%)
Place of birth for the foreign-born population - Chile (%)
Place of birth for the foreign-born population - Colombia (%)
Place of birth for the foreign-born population - Ecuador (%)
Place of birth for the foreign-born population - Guyana (%)
Place of birth for the foreign-born population - Peru (%)
Place of birth for the foreign-born population - Uruguay (%)
Place of birth for the foreign-born population - Venezuela (%)
Place of birth for the foreign-born population - Other South America (%)
Place of birth for the foreign-born population - Canada (%)
Place of birth for the foreign-born population - Other Northern America (%)
Place of birth for the foreign-born population - Other (%)
Latest news about races in Riverton, UT collected exclusively by city-data.com from local newspapers, TV, and radio stations
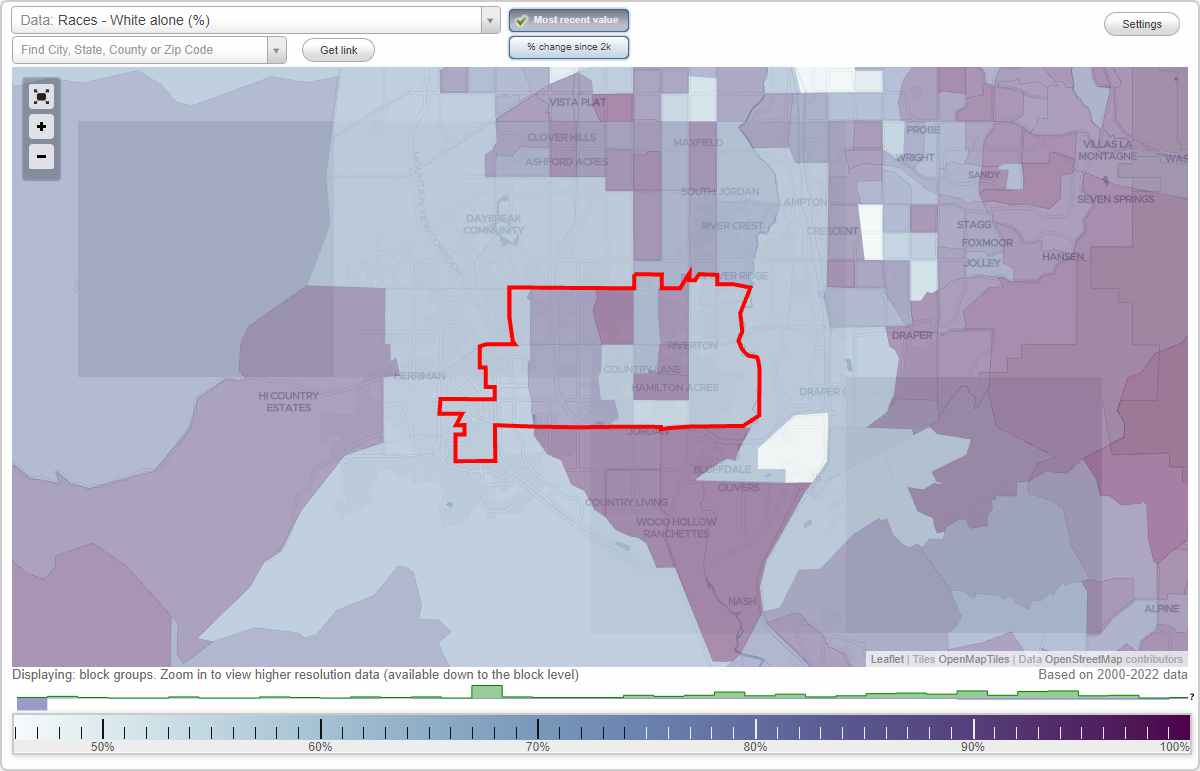
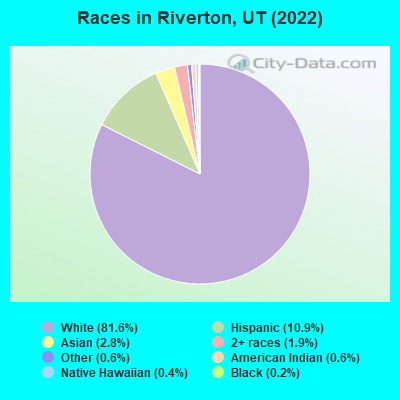
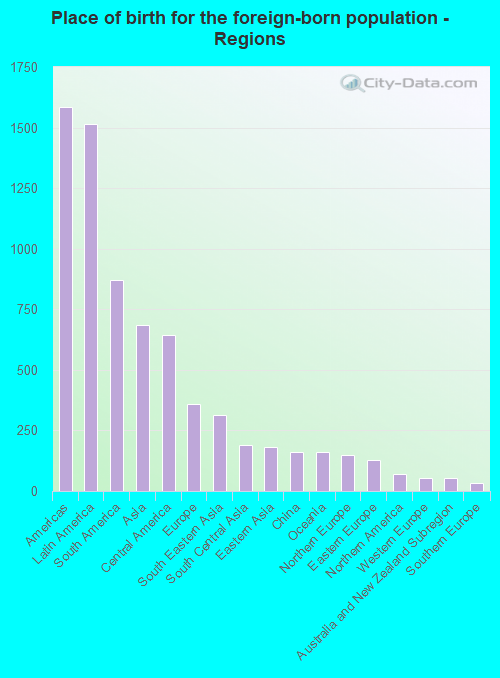
According to 2022 data, the most numerous races in Riverton, UT are White alone (36,801 residents), Hispanic (4,894 residents), and Two or more races (877 residents). 89.4% of Riverton residents speak English at home. 6.2% of Riverton, UT residents are foreign-born (3.2% born in Latin America, 1.4% born in Asia, 0.8% born in Europe), which is 29.1% less than the foreign-born rate of 8.0% across the entire state of Utah.
Race distribution in Riverton
2000 2022
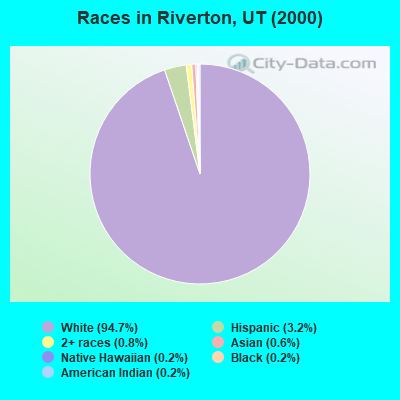
1,904,265 85.3% White alone 201,559 9.0% Hispanic 36,483 1.6% Asian alone 31,308 1.4% Two or more races 26,663 1.2% American Indian alone 14,806 0.7% Native Hawaiian and Other 16,137 0.7% Black alone 1,948 0.09% Other race alone
2,557,466 75.6% White alone 512,086 15.1% Hispanic 119,308 3.5% Two or more races 82,388 2.4% Asian alone 36,978 1.1% Native Hawaiian and Other 34,873 1.0% Black alone 22,803 0.7% American Indian alone 14,898 0.4% Other race alone
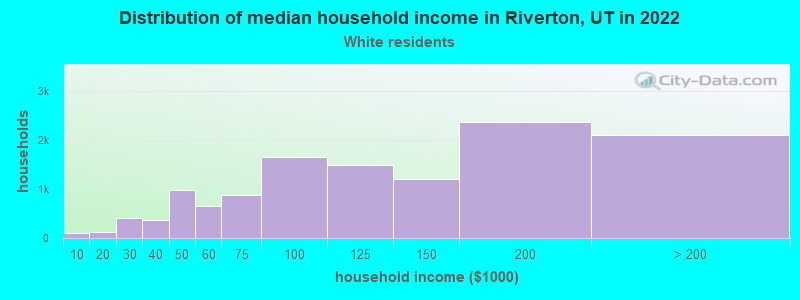
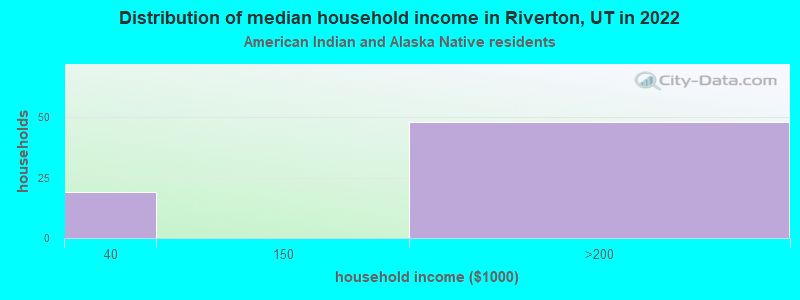
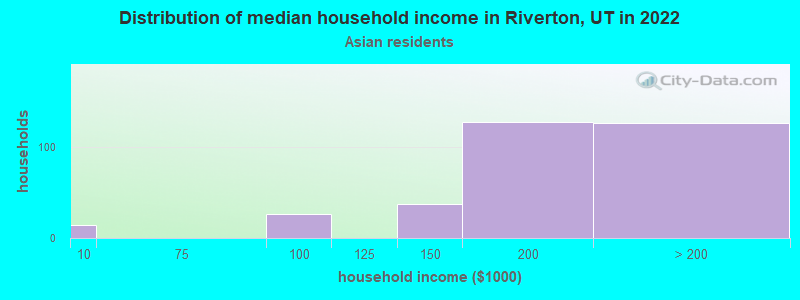
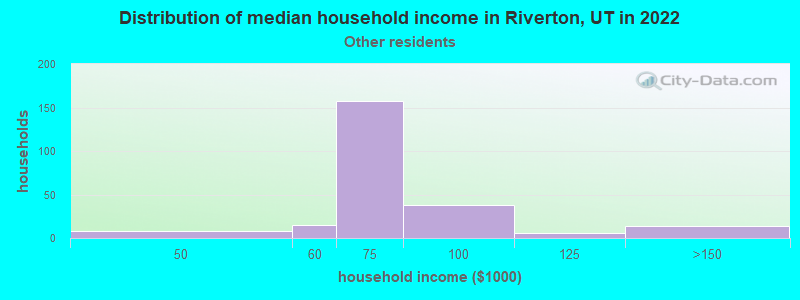
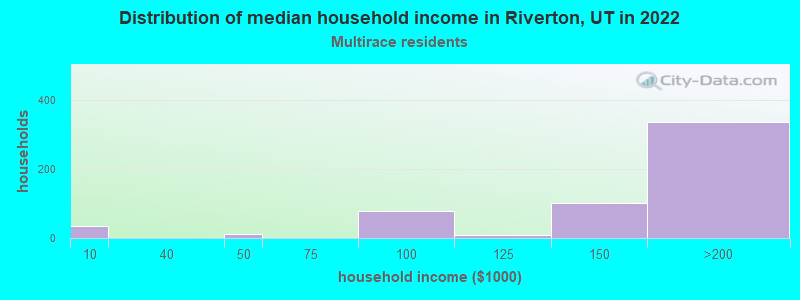
Income and house value in Riverton Median household income in 2022 $113,635 White non-Hispanic householders$179,913 American Indian and Alaska Native householders$195,225 Asian householders$67,888 Some other race householders$145,198 Two or more races householders$151,517 Hispanic or Latino race householdersMedian 2022 house value $582,123 White Non-Hispanic householders$461,603 Black or African American householders$489,467 American Indian or Alaska Native householders $590,181 Asian householders$755,351 Native Hawaiian and other Pacific Islander householders$562,317 Some other race householders$449,517 Two or more races householders$554,931 Hispanic or Latino householders
Median age by race in Riverton
34.8 Median age for White residents32.9 36.1 12.1 Median age for Black or African American residents9.4 18.9 22.3 Median age for American Indian / Alaska Native residents40.1 3.8 36.5 Median age for Asian residents19.6 41.9 27.3 Median age for Native Hawaiian / Pacific Islander residents26.2 -673,860,910.6 27.4 Median age for Other race residents21.0 30.1 36.9 Median age for Two or more races residents38.4 28.4 36.0 Median age for White alone residents33.9 37.0 27.2 Median age for Hispanic or Latino residents31.3 26.7
Owner/renter occupied households by race in Riverton
House owners and renters - White residents 10,684 87.1% Owner occupied1,581 12.9% Renter occupiedHouse owners and renters - American Indian / Alaska Native residents 66 100.0% Owner occupiedHouse owners and renters - Asian residents 322 100.0% Owner occupiedHouse owners and renters - Native Hawaiian / Pacific Islander residents 6 100.0% Owner occupiedHouse owners and renters - Other race residents 46 18.0% Owner occupied208 82.0% Renter occupiedHouse owners and renters - Two or more races residents 572 95.8% Owner occupied25 4.2% Renter occupiedHouse owners and renters - White alone residents 10,558 86.8% Owner occupied1,599 13.2% Renter occupiedHouse owners and renters - Hispanic or Latino residents 666 72.5% Owner occupied253 27.5% Renter occupied
Language usage in Riverton
English speakers - Total 89.4% of residents of Riverton speak English at home.
5.7% of residents speak Spanish at home 1,487 62.8% Speak English very well880 37.2% Speak English less than very well4.4% of residents speak other language at home 1,615 88.8% Speak English very well204 11.2% Speak English less than very well
English speakers - Born in the United States 89.3% of residents of Riverton speak English at home.
6.8% of residents speak Spanish at home 626 97.1% Speak English very well19 2.9% Speak English less than very well3.6% of residents speak other language at home 333 98.2% Speak English very well6 1.8% Speak English less than very well
English speakers - Native, born elsewhere 64.2% of residents of Riverton speak English at home.
22.2% of residents speak Spanish at home 65 100.0% Speak English very well11.6% of residents speak other language at home 34 100.0% Speak English very well
English speakers - Foreign-born 35.7% of residents of Riverton speak English at home.
36.8% of residents speak Spanish at home 212 20.8% Speak English very well805 79.2% Speak English less than very well28.7% of residents speak other language at home 651 82.1% Speak English very well142 17.9% Speak English less than very well
White (Caucasian) - Speak only English Native:
96.9% (33,603)Foreign-born:
58.9% (203)
White (Caucasian) - Speak another language Native:
3.4% (1,166)Foreign-born:
47.1% (163)
American Indian / Alaska Native - Speak only English Native:
44.3% (102)Foreign-born:
21.9% (50)
American Indian / Alaska Native - Speak another language Native:
64.3% (148)Foreign-born:
79.6% (181)
Asian - Speak only English Native:
50.1% (271)Foreign-born:
17.3% (127)
Asian - Speak another language Native:
50.4% (273)Foreign-born:
83.1% (610)
Native Hawaiian / Pacific Islander - Speak only English Native:
87.0% (73)Foreign-born:
25.5% (28)
Other race - Speak only English Native:
64.2% (388)Foreign-born:
67.7% (547)
Other race - Speak another language Native:
27.5% (166)Foreign-born:
58.5% (473)
Two or more races - Speak only English Native:
69.9% (1,174)Foreign-born:
28.6% (220)
Two or more races - Speak another language Native:
30.3% (508)Foreign-born:
56.4% (433)
White alone - Speak only English Native:
96.3% (32,551)Foreign-born:
60.0% (216)
White alone - Speak another language Native:
3.7% (1,239)Foreign-born:
37.3% (134)
Hispanic or Latino - Speak only English Native:
76.2% (2,198)Foreign-born:
43.5% (648)
Hispanic or Latino - Speak another language Native:
25.5% (735)Foreign-born:
64.8% (965)
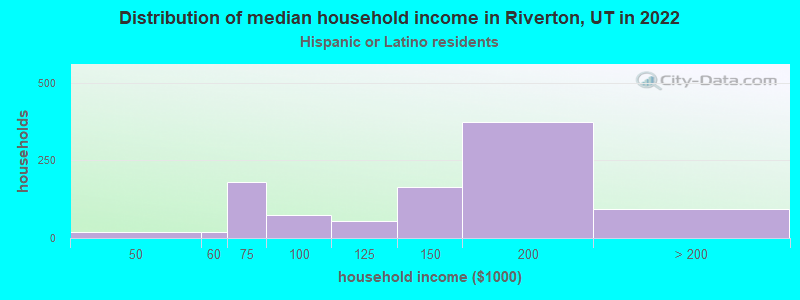
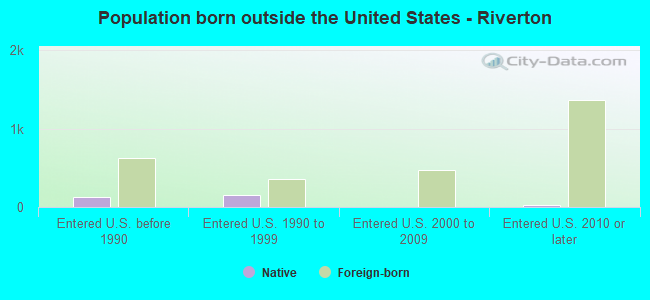
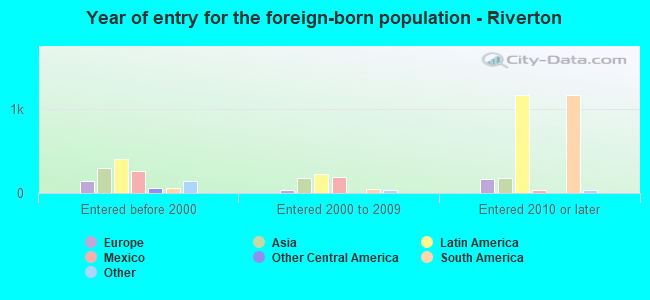
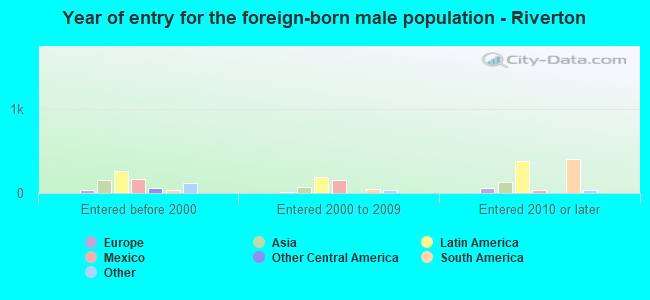
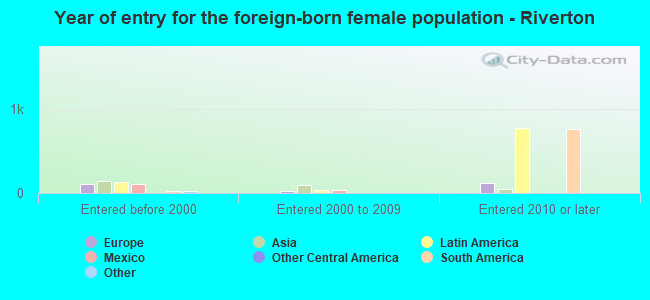
Foreign-born residents in Riverton 2,794 residents are foreign born (3.2% Latin America , 1.4% Asia , 0.8% Europe ).
Marital status for residents in Riverton Marital status - White (Caucasian) population 15 years and over
Males 29.1% Never married65.3% Now married0.4% Separated1.2% Widowed4.0% DivorcedFemales 21.1% Never married62.5% Now married0.6% Separated6.4% Widowed9.4% DivorcedWomen who gave birth in the past 12 months Now married:
95.4% (583)Unmarried:
4.6% (28)
Women who did not give birth in the past 12 months Now married:
57.3% (4,699)Unmarried:
42.7% (3,507)
Marital status - Black or African American population 15 years and over
Males 100.0% Never married0.0% Now married0.0% Separated0.0% Widowed0.0% DivorcedFemales 75.0% Never married25.0% Now married0.0% Separated0.0% Widowed0.0% DivorcedWomen who did not give birth in the past 12 months Now married:
0.0% (0)Unmarried:
100.0% (17)
Marital status - American Indian / Alaska Native population 15 years and over
Males 65.9% Never married34.1% Now married0.0% Separated0.0% Widowed0.0% DivorcedFemales 34.7% Never married27.3% Now married38.1% Separated0.0% Widowed0.0% DivorcedWomen who did not give birth in the past 12 months Now married:
60.9% (128)Unmarried:
39.1% (82)
Marital status - Asian population 15 years and over
Males 44.9% Never married47.5% Now married0.0% Separated0.0% Widowed7.6% DivorcedFemales 3.2% Never married79.7% Now married0.0% Separated11.6% Widowed5.4% DivorcedWomen who gave birth in the past 12 months Now married:
100.0% (22)Unmarried:
0.0% (0)
Women who did not give birth in the past 12 months Now married:
88.0% (243)Unmarried:
12.0% (33)
Marital status - Other race population 15 years and over
Males 48.0% Never married48.8% Now married0.0% Separated0.0% Widowed3.2% DivorcedFemales 25.4% Never married50.2% Now married0.0% Separated1.2% Widowed23.1% DivorcedWomen who did not give birth in the past 12 months Now married:
50.3% (150)Unmarried:
49.7% (148)
Marital status - Two or more races population 15 years and over
Males 53.0% Never married36.2% Now married8.6% Separated2.3% Widowed0.0% DivorcedFemales 24.3% Never married69.0% Now married0.0% Separated1.3% Widowed5.4% DivorcedWomen who gave birth in the past 12 months Now married:
100.0% (12)Unmarried:
0.0% (0)
Women who did not give birth in the past 12 months Now married:
57.7% (246)Unmarried:
42.3% (180)
Marital status - White alone, not Hispanic / Latino population 15 years and over
Males 28.4% Never married65.8% Now married0.5% Separated1.3% Widowed4.0% DivorcedFemales 20.2% Never married63.2% Now married0.6% Separated6.6% Widowed9.4% DivorcedWomen who gave birth in the past 12 months Now married:
95.4% (595)Unmarried:
4.6% (29)
Women who did not give birth in the past 12 months Now married:
58.2% (4,684)Unmarried:
41.8% (3,365)
Marital status - Hispanic or Latino population 15 years and over
Males 46.8% Never married46.5% Now married3.2% Separated0.8% Widowed2.7% DivorcedFemales 32.6% Never married53.4% Now married0.7% Separated1.0% Widowed12.2% DivorcedWomen who gave birth in the past 12 months Now married:
100.0% (11)Unmarried:
0.0% (0)
Women who did not give birth in the past 12 months Now married:
45.1% (400)Unmarried:
54.9% (488)
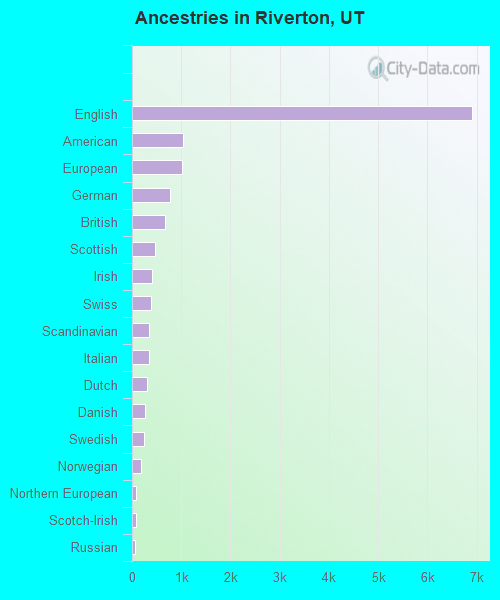
Ancestries in Riverton
6,905 34.9% English1,026 5.2% American1,006 5.1% European775 3.9% German677 3.4% British473 2.4% Scottish400 2.0% Irish386 2.0% Swiss354 1.8% Scandinavian344 1.7% Italian310 1.6% Dutch258 1.3% Danish240 1.2% Swedish176 0.9% Norwegian85 0.4% Northern European76 0.4% Scotch-Irish71 0.4% Russian61 0.3% Polish55 0.3% Canadian43 0.2% Welsh40 0.2% Portuguese39 0.2% Hungarian36 0.2% Iranian26 0.1% Czech20 0.1% French19 0.10% Lebanese16 0.08% Austrian13 0.07% Australian12 0.06% Belgian11 0.06% Romanian10 0.05% Brazilian8 0.04% Arab6 0.03% Greek4 0.02% Eastern European
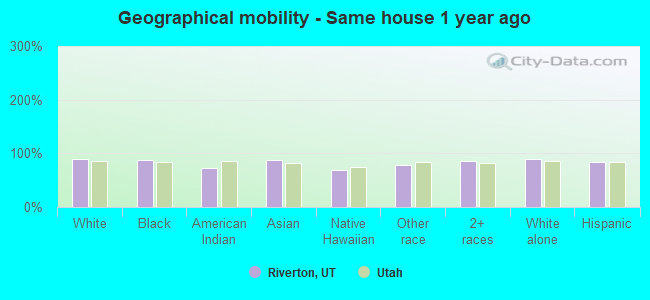
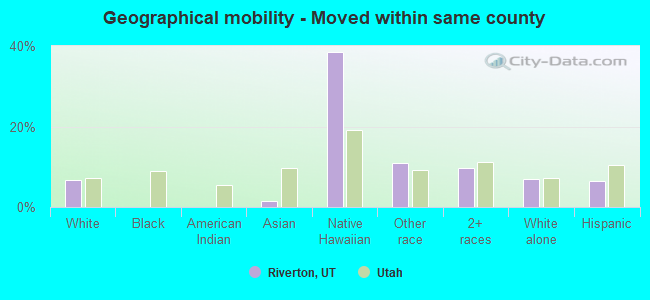
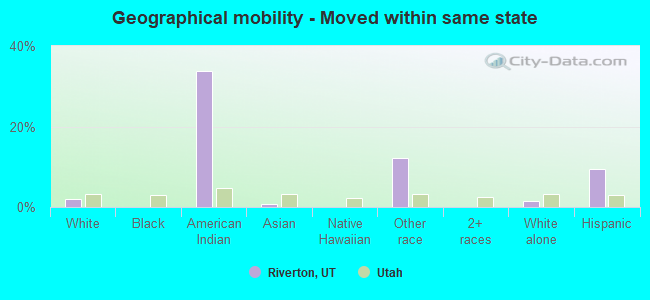
Geographical mobility in Riverton Same house 1 year ago 33,222 89.6% White (Caucasian)62 87.3% Black or African American362 73.7% American Indian / Alaska Native1,105 88.0% Asian133 68.5% Native Hawaiian / Pacific Islander1,354 78.0% Other race2,195 86.5% Two or more races32,657 89.8% White alone, not Hispanic / Latino4,014 83.9% Hispanic or LatinoMoved within same county 2,451 6.6% White / Caucasian20 1.6% Asian74 38.4% Native Hawaiian / Pacific Islander191 11.0% Other race247 9.7% Two or more races2,494 6.9% White alone, not Hispanic / Latino313 6.5% Hispanic or LatinoMoved within same state 747 2.0% White / Caucasian167 33.9% American Indian / Alaska Native8 0.6% Asian210 12.1% Other race566 1.6% White alone, not Hispanic / Latino449 9.4% Hispanic or LatinoMoved from different state 613 1.7% White / Caucasian12 16.8% Black or African American142 11.3% Asian617 1.7% White alone, not Hispanic / Latino8 0.2% Hispanic or LatinoMoved from abroad 75 0.2% White110 4.3% Two or more races70 0.2% White alone, not Hispanic / Latino100 2.1% Hispanic or Latino
Children Nativity (place of birth) in Riverton
Children under 6 years - Living with two parents Both parents native 3,356 99.9% Native4 0.1% Foreign-bornBoth parents foreign-born 47 100.0% NativeOne native, one foreign-born parent 130 100.0% NativeChildren under 6 years - Living with one parent Native parent 215 100.0% NativeForeign-born parent 56 100.0% NativeChildren 6 to 17 years - Living with two parents Both parents native 6,983 100.0% NativeBoth parents foreign-born 376 87.8% Native52 12.2% Foreign-bornOne native, one foreign-born parent 425 100.0% NativeChildren 6 to 17 years - Living with one parent Native parent 1,047 100.0% NativeForeign-born parent 133 51.5% Native125 48.5% Foreign-born
Grandparents responsible for own grandchildren in Riverton
Grandparents (30 to 59 years) White / Caucasian 93 49.6% Responsible for grandchildren95 50.4% Not responsible for grandchildrenNative Hawaiian / Pacific Islander 89 100.0% Not responsible for grandchildrenOther race 66 100.0% Not responsible for grandchildrenTwo or more races 11 100.0% Not responsible for grandchildrenWhite alone, not Hispanic / Latino 113 52.4% Responsible for grandchildren103 47.6% Not responsible for grandchildrenHispanic or Latino 71 100.0% Not responsible for grandchildrenGrandparents (60 years and over) White / Caucasian 178 26.7% Responsible for grandchildren489 73.3% Not responsible for grandchildrenWhite alone, not Hispanic / Latino 180 26.8% Responsible for grandchildren490 73.2% Not responsible for grandchildrenHispanic or Latino 61 100.0% Not responsible for grandchildren