Races in Riverland Village, Florida (FL) Detailed Stats
Ancestries, Foreign-born residents, place of birth

Recent posts about races in Riverland Village, Florida on our local forum with over 2,400,000 registered users:
 | Very detailed map of Miami-Dade neighborhoods - please give your feedback! (111 replies) |
27.1% of Riverland Village, FL residents are foreign-born (19.8% born in Latin America, 3.7% born in Europe), which is 22.5% greater than the foreign-born rate of 21.0% across the entire state of Florida.
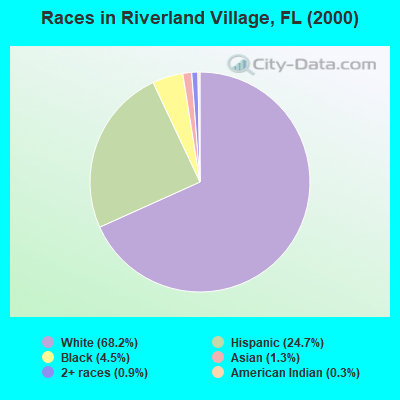
Race distribution in Riverland Village

- 1,43868.2%White alone
- 52124.7%Hispanic
- 944.5%Black alone
- 281.3%Asian alone
- 180.9%Two or more races
- 60.3%American Indian alone
- 20.09%Native Hawaiian and Other
Pacific Islander alone - 10.05%Other race alone
2000
2022
-
- 10,458,50965.4%White alone
- 2,682,71516.8%Hispanic
- 2,264,26814.2%Black alone
- 261,6931.6%Asian alone
- 236,9541.5%Two or more races
- 42,3580.3%American Indian alone
- 28,9940.2%Other race alone
- 6,8870.04%Native Hawaiian and Other
Pacific Islander alone

-
- 11,309,40350.8%White alone
- 6,025,03927.1%Hispanic
- 3,241,01514.6%Black alone
- 861,6303.9%Two or more races
- 623,6922.8%Asian alone
- 152,0540.7%Other race alone
- 22,5040.1%American Indian alone
- 9,4860.04%Native Hawaiian and Other
Pacific Islander alone

Income and house value in Riverland Village
- Median household income in 2022
- $93,495White non-Hispanic householders
- $84,170Black householders
- $118,270Some other race householders
- $52,078Two or more races householders
- $80,528Hispanic or Latino race householders
- Median 2022 house value
- $366,311White Non-Hispanic householders
- $419,189Black or African American householders
- $431,067Some other race householders
- $375,507Two or more races householders
- $419,572Hispanic or Latino householders
Household income for White non-Hispanic householders

Household income for Black householders

Household income for Two or more races householders

Household income for Hispanic or Latino race householders

Foreign-born residents in Riverland Village
571 residents are foreign born (19.8% Latin America, 3.7% Europe).
| This city: | 27.1% |
| Florida: | 16.7% |
Ancestries in Riverland Village

- 96646.1%Other
- 1969.4%Irish
- 1708.1%English
- 1597.6%Italian
- 1386.6%German
- 1195.7%United States
- 542.6%Polish
- 532.5%Scottish
- 432.1%French
- 381.8%Russian
- 351.7%Scotch-Irish
- 271.3%Welsh
- 201.0%Norwegian
- 201.0%West Indian
- 110.5%Czech
- 90.4%Greek
- 90.4%Swedish
- 90.4%Swiss
- 70.3%Hungarian
- 70.3%Subsaharan African
- 60.3%Dutch

Zip codes: 33312.