Races in Richfield, Minnesota (MN) Detailed Stats
Data:
Races - White alone (%)
Races - White alone (% change since 2000)
Races - Black alone (%)
Races - Black alone (% change since 2000)
Races - American Indian alone (%)
Races - American Indian alone (% change since 2000)
Races - Asian alone (%)
Races - Asian alone (% change since 2000)
Races - Hispanic (%)
Races - Hispanic (% change since 2000)
Races - Native Hawaiian and Other Pacific Islander alone (%)
Races - Native Hawaiian and Other Pacific Islander alone (% change since 2000)
Races - Two or more races(%)
Races - Two or more races(% change since 2000)
Races - Other race alone (%)
Races - Other race alone (% change since 2000)
Racial diversity
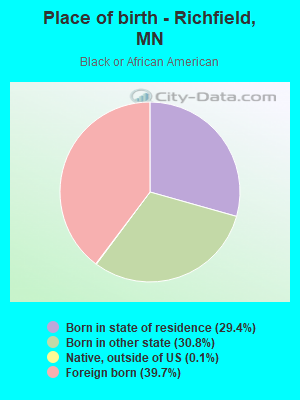
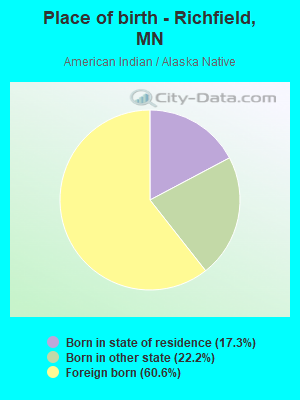
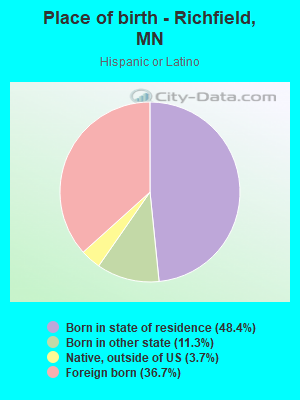
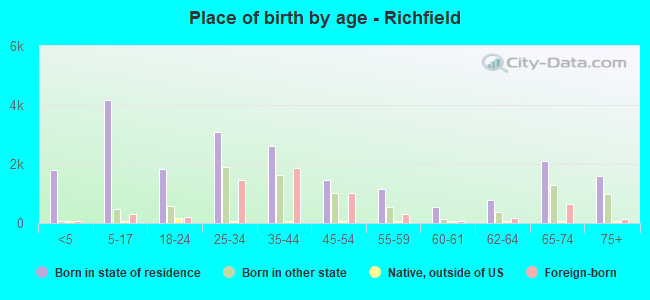
Place of birth - Born in state of residence (%)
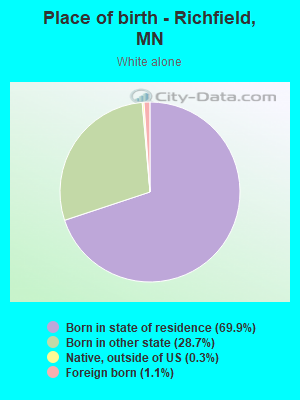
Place of birth - Born in state of residence (%) - White
Place of birth - Born in state of residence (%) - Black or African American
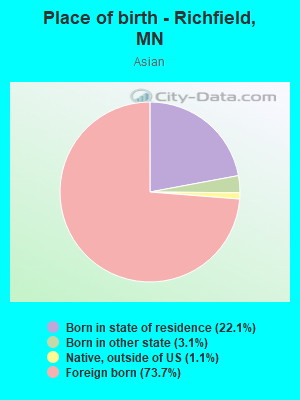
Place of birth - Born in state of residence (%) - Asian
Place of birth - Born in state of residence (%) - Hispanic or Latino
Place of birth - Born in state of residence (%) - American Indian and Alaska Native
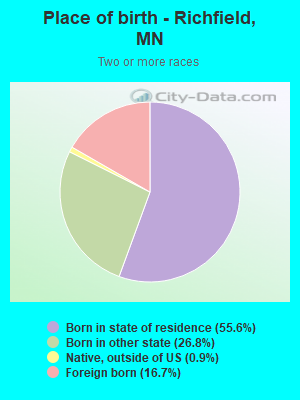
Place of birth - Born in state of residence (%) - Multirace
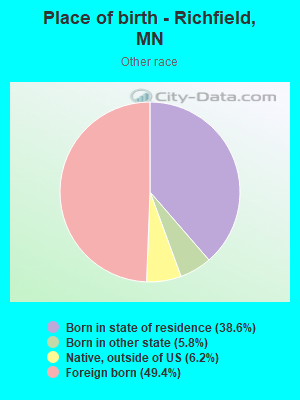
Place of birth - Born in state of residence (%) - Other Race
Place of birth - Born in other state (%)
Place of birth - Born in other state (%) - White
Place of birth - Born in other state (%) - Black or African American
Place of birth - Born in other state (%) - Asian
Place of birth - Born in other state (%) - Hispanic or Latino
Place of birth - Born in other state (%) - American Indian and Alaska Native
Place of birth - Born in other state (%) - Multirace
Place of birth - Born in other state (%) - Other Race
Place of birth - Native, outside of US (%)
Place of birth - Native, outside of US (%) - White
Place of birth - Native, outside of US (%) - Black or African American
Place of birth - Native, outside of US (%) - Asian
Place of birth - Native, outside of US (%) - Hispanic or Latino
Place of birth - Native, outside of US (%) - American Indian and Alaska Native
Place of birth - Native, outside of US (%) - Multirace
Place of birth - Native, outside of US (%) - Other Race
Place of birth - Foreign born (%)
Place of birth - Foreign born (%) - White
Place of birth - Foreign born (%) - Black or African American
Place of birth - Foreign born (%) - Asian
Place of birth - Foreign born (%) - Hispanic or Latino
Place of birth - Foreign born (%) - American Indian and Alaska Native
Place of birth - Foreign born (%) - Multirace
Place of birth - Foreign born (%) - Other Race
Residents speaking English at home (%)
Residents speaking English at home - Born in the United States (%)
Residents speaking English at home - Native, born elsewhere (%)
Residents speaking English at home - Foreign born (%)
Residents speaking Spanish at home (%)
Residents speaking Spanish at home - Born in the United States (%)
Residents speaking Spanish at home - Native, born elsewhere (%)
Residents speaking Spanish at home - Foreign born (%)
Residents speaking other language at home (%)
Residents speaking other language at home - Born in the United States (%)
Residents speaking other language at home - Native, born elsewhere (%)
Residents speaking other language at home - Foreign born (%)
Marital status - Never married (%)
Marital status - Now married (%)
Marital status - Separated (%)
Marital status - Widowed (%)
Marital status - Divorced (%)
Ancestries Reported - Arab (%)
Ancestries Reported - Czech (%)
Ancestries Reported - Danish (%)
Ancestries Reported - Dutch (%)
Ancestries Reported - English (%)
Ancestries Reported - French (%)
Ancestries Reported - French Canadian (%)
Ancestries Reported - German (%)
Ancestries Reported - Greek (%)
Ancestries Reported - Hungarian (%)
Ancestries Reported - Irish (%)
Ancestries Reported - Italian (%)
Ancestries Reported - Lithuanian (%)
Ancestries Reported - Norwegian (%)
Ancestries Reported - Polish (%)
Ancestries Reported - Portuguese (%)
Ancestries Reported - Russian (%)
Ancestries Reported - Scotch-Irish (%)
Ancestries Reported - Scottish (%)
Ancestries Reported - Slovak (%)
Ancestries Reported - Subsaharan African (%)
Ancestries Reported - Swedish (%)
Ancestries Reported - Swiss (%)
Ancestries Reported - Ukrainian (%)
Ancestries Reported - United States (%)
Ancestries Reported - Welsh (%)
Ancestries Reported - West Indian (%)
Ancestries Reported - Other (%)
Geographical mobility - Same house 1 year ago (%)
Geographical mobility - Same house 1 year ago (%) - White
Geographical mobility - Same house 1 year ago (%) - Black or African American
Geographical mobility - Same house 1 year ago (%) - Asian
Geographical mobility - Same house 1 year ago (%) - Hispanic or Latino
Geographical mobility - Same house 1 year ago (%) - American Indian and Alaska Native
Geographical mobility - Same house 1 year ago (%) - Multirace
Geographical mobility - Same house 1 year ago (%) - Other Race
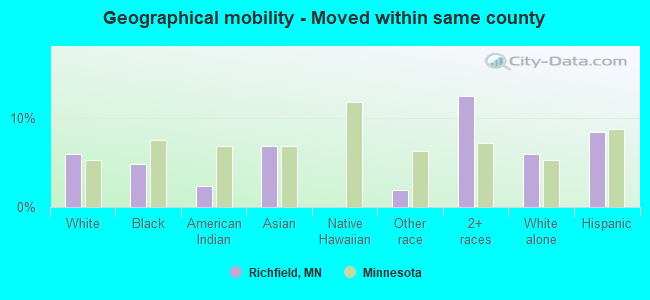
Geographical mobility - Moved within same county (%)
Geographical mobility - Moved within same county (%) - White
Geographical mobility - Moved within same county (%) - Black or African American
Geographical mobility - Moved within same county (%) - Asian
Geographical mobility - Moved within same county (%) - Hispanic or Latino
Geographical mobility - Moved within same county (%) - American Indian and Alaska Native
Geographical mobility - Moved within same county (%) - Multirace
Geographical mobility - Moved within same county (%) - Other Race
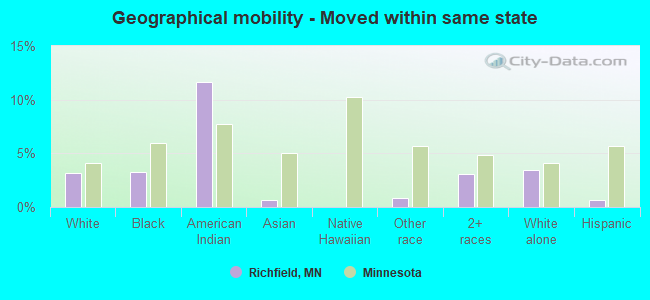
Geographical mobility - Moved from different county within same state (%)
Geographical mobility - Moved from different county within same state (%) - White
Geographical mobility - Moved from different county within same state (%) - Black or African American
Geographical mobility - Moved from different county within same state (%) - Asian
Geographical mobility - Moved from different county within same state (%) - Hispanic or Latino
Geographical mobility - Moved from different county within same state (%) - American Indian and Alaska Native
Geographical mobility - Moved from different county within same state (%) - Multirace
Geographical mobility - Moved from different county within same state (%) - Other Race
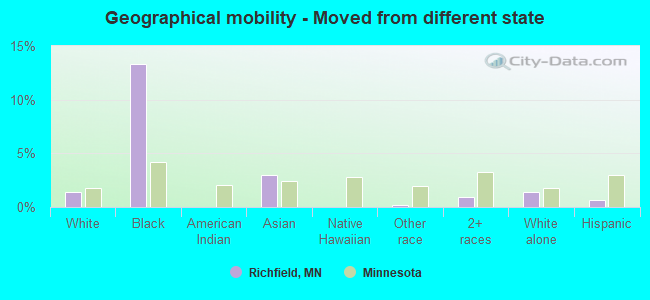
Geographical mobility - Moved from different state (%)
Geographical mobility - Moved from different state (%) - White
Geographical mobility - Moved from different state (%) - Black or African American
Geographical mobility - Moved from different state (%) - Asian
Geographical mobility - Moved from different state (%) - Hispanic or Latino
Geographical mobility - Moved from different state (%) - American Indian and Alaska Native
Geographical mobility - Moved from different state (%) - Multirace
Geographical mobility - Moved from different state (%) - Other Race
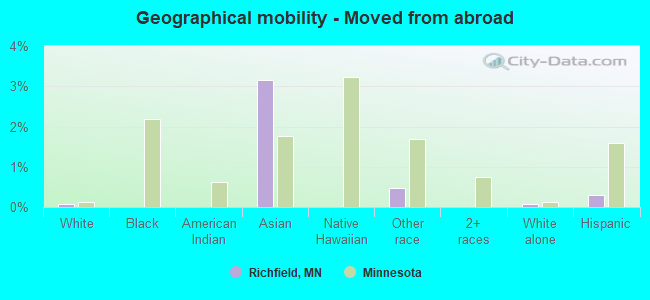
Geographical mobility - Moved from abroad (%)
Geographical mobility - Moved from abroad (%) - White
Geographical mobility - Moved from abroad (%) - Black or African American
Geographical mobility - Moved from abroad (%) - Asian
Geographical mobility - Moved from abroad (%) - Hispanic or Latino
Geographical mobility - Moved from abroad (%) - American Indian and Alaska Native
Geographical mobility - Moved from abroad (%) - Multirace
Geographical mobility - Moved from abroad (%) - Other Race
Place of birth for the foreign-born population - Ireland (%)
Place of birth for the foreign-born population - Denmark (%)
Place of birth for the foreign-born population - Norway (%)
Place of birth for the foreign-born population - Sweden (%)
Place of birth for the foreign-born population - United Kingdom (%)
Place of birth for the foreign-born population - England (%)
Place of birth for the foreign-born population - Scotland (%)
Place of birth for the foreign-born population - Other Northern Europe (%)
Place of birth for the foreign-born population - Austria (%)
Place of birth for the foreign-born population - Belgium (%)
Place of birth for the foreign-born population - France (%)
Place of birth for the foreign-born population - Germany (%)
Place of birth for the foreign-born population - Netherlands (%)
Place of birth for the foreign-born population - Switzerland (%)
Place of birth for the foreign-born population - Other Western Europe (%)
Place of birth for the foreign-born population - Greece (%)
Place of birth for the foreign-born population - Italy (%)
Place of birth for the foreign-born population - Portugal (%)
Place of birth for the foreign-born population - Spain (%)
Place of birth for the foreign-born population - Other Southern Europe (%)
Place of birth for the foreign-born population - Albania (%)
Place of birth for the foreign-born population - Belarus (%)
Place of birth for the foreign-born population - Bosnia and Herzegovina (%)
Place of birth for the foreign-born population - Bulgaria (%)
Place of birth for the foreign-born population - Croatia (%)
Place of birth for the foreign-born population - Czechoslovakia (%)
Place of birth for the foreign-born population - Hungary (%)
Place of birth for the foreign-born population - Latvia (%)
Place of birth for the foreign-born population - Lithuania (%)
Place of birth for the foreign-born population - North Macedonia (Macedonia) (%)
Place of birth for the foreign-born population - Moldova (%)
Place of birth for the foreign-born population - Poland (%)
Place of birth for the foreign-born population - Romania (%)
Place of birth for the foreign-born population - Russia (%)
Place of birth for the foreign-born population - Serbia (%)
Place of birth for the foreign-born population - Ukraine (%)
Place of birth for the foreign-born population - Other Eastern Europe (%)
Place of birth for the foreign-born population - China (%)
Place of birth for the foreign-born population - Hong Kong (%)
Place of birth for the foreign-born population - Taiwan (%)
Place of birth for the foreign-born population - Japan (%)
Place of birth for the foreign-born population - Korea (%)
Place of birth for the foreign-born population - Other Eastern Asia (%)
Place of birth for the foreign-born population - Afghanistan (%)
Place of birth for the foreign-born population - Bangladesh (%)
Place of birth for the foreign-born population - India (%)
Place of birth for the foreign-born population - Iran (%)
Place of birth for the foreign-born population - Kazakhstan (%)
Place of birth for the foreign-born population - Nepal (%)
Place of birth for the foreign-born population - Pakistan (%)
Place of birth for the foreign-born population - Sri Lanka (%)
Place of birth for the foreign-born population - Uzbekistan (%)
Place of birth for the foreign-born population - Other South Central Asia (%)
Place of birth for the foreign-born population - Burma (%)
Place of birth for the foreign-born population - Cambodia (%)
Place of birth for the foreign-born population - Indonesia (%)
Place of birth for the foreign-born population - Laos (%)
Place of birth for the foreign-born population - Malaysia (%)
Place of birth for the foreign-born population - Philippines (%)
Place of birth for the foreign-born population - Singapore (%)
Place of birth for the foreign-born population - Thailand (%)
Place of birth for the foreign-born population - Vietnam (%)
Place of birth for the foreign-born population - Other South Eastern Asia (%)
Place of birth for the foreign-born population - Armenia (%)
Place of birth for the foreign-born population - Iraq (%)
Place of birth for the foreign-born population - Israel (%)
Place of birth for the foreign-born population - Jordan (%)
Place of birth for the foreign-born population - Kuwait (%)
Place of birth for the foreign-born population - Lebanon (%)
Place of birth for the foreign-born population - Saudi Arabia (%)
Place of birth for the foreign-born population - Syria (%)
Place of birth for the foreign-born population - Turkey (%)
Place of birth for the foreign-born population - Yemen (%)
Place of birth for the foreign-born population - Other Western Asia (%)
Place of birth for the foreign-born population - Eritrea (%)
Place of birth for the foreign-born population - Ethiopia (%)
Place of birth for the foreign-born population - Kenya (%)
Place of birth for the foreign-born population - Somalia (%)
Place of birth for the foreign-born population - Uganda (%)
Place of birth for the foreign-born population - Zimbabwe (%)
Place of birth for the foreign-born population - Other Eastern Africa (%)
Place of birth for the foreign-born population - Cameroon (%)
Place of birth for the foreign-born population - Congo (%)
Place of birth for the foreign-born population - Democratic Republic of Congo (Zaire) (%)
Place of birth for the foreign-born population - Other Middle Africa (%)
Place of birth for the foreign-born population - Egypt (%)
Place of birth for the foreign-born population - Morocco (%)
Place of birth for the foreign-born population - Sudan (%)
Place of birth for the foreign-born population - Other Northern Africa (%)
Place of birth for the foreign-born population - South Africa (%)
Place of birth for the foreign-born population - Other Southern Africa (%)
Place of birth for the foreign-born population - Cabo Verde (%)
Place of birth for the foreign-born population - Ghana (%)
Place of birth for the foreign-born population - Liberia (%)
Place of birth for the foreign-born population - Nigeria (%)
Place of birth for the foreign-born population - Senegal (%)
Place of birth for the foreign-born population - Sierra Leone (%)
Place of birth for the foreign-born population - Other Western Africa (%)
Place of birth for the foreign-born population - Australia (%)
Place of birth for the foreign-born population - New Zealand (%)
Place of birth for the foreign-born population - Fiji (%)
Place of birth for the foreign-born population - Micronesia (%)
Place of birth for the foreign-born population - Bahamas (%)
Place of birth for the foreign-born population - Barbados (%)
Place of birth for the foreign-born population - Cuba (%)
Place of birth for the foreign-born population - Dominica (%)
Place of birth for the foreign-born population - Dominican Republic (%)
Place of birth for the foreign-born population - Grenada (%)
Place of birth for the foreign-born population - Haiti (%)
Place of birth for the foreign-born population - Jamaica (%)
Place of birth for the foreign-born population - St. Vincent and the Grenadines (%)
Place of birth for the foreign-born population - Trinidad and Tobago (%)
Place of birth for the foreign-born population - West Indies (%)
Place of birth for the foreign-born population - Other Caribbean (%)
Place of birth for the foreign-born population - Belize (%)
Place of birth for the foreign-born population - Costa Rica (%)
Place of birth for the foreign-born population - El Salvador (%)
Place of birth for the foreign-born population - Guatemala (%)
Place of birth for the foreign-born population - Honduras (%)
Place of birth for the foreign-born population - Mexico (%)
Place of birth for the foreign-born population - Nicaragua (%)
Place of birth for the foreign-born population - Panama (%)
Place of birth for the foreign-born population - Other Central America (%)
Place of birth for the foreign-born population - Argentina (%)
Place of birth for the foreign-born population - Bolivia (%)
Place of birth for the foreign-born population - Brazil (%)
Place of birth for the foreign-born population - Chile (%)
Place of birth for the foreign-born population - Colombia (%)
Place of birth for the foreign-born population - Ecuador (%)
Place of birth for the foreign-born population - Guyana (%)
Place of birth for the foreign-born population - Peru (%)
Place of birth for the foreign-born population - Uruguay (%)
Place of birth for the foreign-born population - Venezuela (%)
Place of birth for the foreign-born population - Other South America (%)
Place of birth for the foreign-born population - Canada (%)
Place of birth for the foreign-born population - Other Northern America (%)
Place of birth for the foreign-born population - Other (%)
Latest news about races in Richfield, MN collected exclusively by city-data.com from local newspapers, TV, and radio stations
According to 2022 data, the most numerous races in Richfield, MN are White alone (21,502 residents), Black alone (3,910 residents), and Hispanic (6,907 residents). 75.8% of Richfield residents speak English at home. 18.0% of Richfield, MN residents are foreign-born (8.0% born in Latin America, 4.6% born in Asia, 3.8% born in Africa), which is 55.5% greater than the foreign-born rate of 8.0% across the entire state of Minnesota.
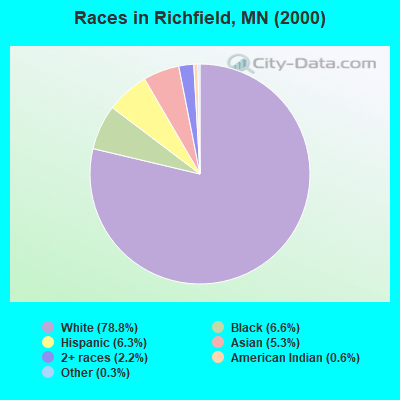
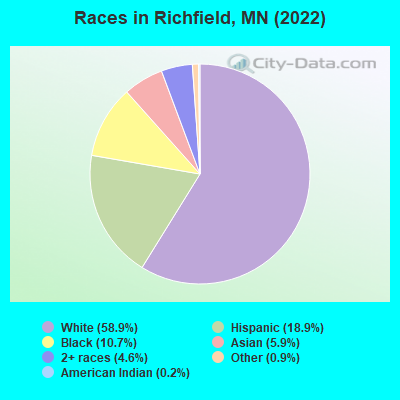
Race distribution in Richfield
2000 2022
4,337,143 88.2% White alone 168,813 3.4% Black alone 143,382 2.9% Hispanic 141,083 2.9% Asian alone 70,304 1.4% Two or more races 52,009 1.1% American Indian alone 5,031 0.1% Other race alone 1,714 0.03% Native Hawaiian and Other
4,356,347 76.2% White alone 395,179 6.9% Black alone 333,830 5.8% Hispanic 294,800 5.2% Asian alone 259,649 4.5% Two or more races 42,125 0.7% American Indian alone 32,976 0.6% Other race alone 2,278 0.04% Native Hawaiian and Other
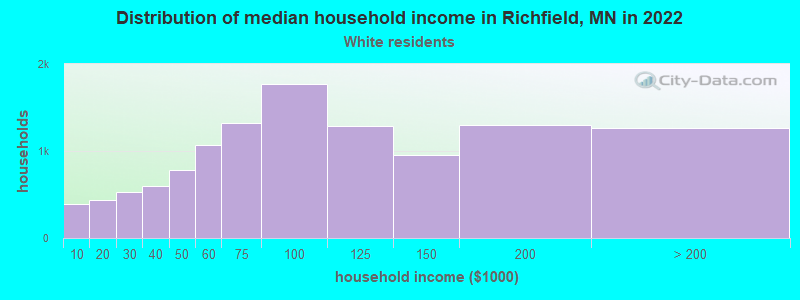
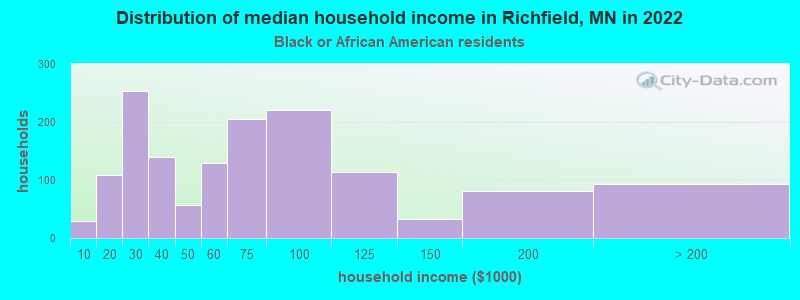
Income and house value in Richfield Median household income in 2022 $84,133 White non-Hispanic householders$61,220 Black householders$77,213 American Indian and Alaska Native householders$82,683 Asian householders$67,199 Some other race householders$73,002 Two or more races householders$66,933 Hispanic or Latino race householdersMedian 2022 house value $312,604 White Non-Hispanic householders$321,605 Black or African American householders$204,105 American Indian or Alaska Native householders $313,821 Asian householders$321,362 Some other race householders$282,195 Two or more races householders$318,443 Hispanic or Latino householders
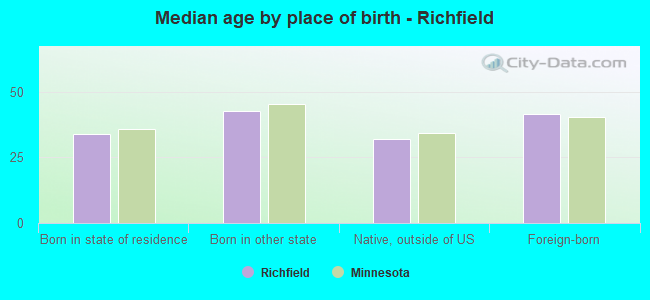
Median age by race in Richfield
43.0 Median age for White residents42.0 44.3 34.5 Median age for Black or African American residents36.6 33.0 32.1 Median age for American Indian / Alaska Native residents27.0 33.2 32.9 Median age for Asian residents32.6 33.1 -790,303,029.5 Median age for Native Hawaiian / Pacific Islander residents-856,799,036.4 -365,948,037.2 34.3 Median age for Other race residents40.0 26.0 24.9 Median age for Two or more races residents21.4 30.1 44.2 Median age for White alone residents42.9 46.9 27.1 Median age for Hispanic or Latino residents27.9 23.8
Owner/renter occupied households by race in Richfield
House owners and renters - White residents 8,448 72.1% Owner occupied3,268 27.9% Renter occupiedHouse owners and renters - Black or African American residents 339 23.4% Owner occupied1,111 76.6% Renter occupiedHouse owners and renters - American Indian / Alaska Native residents 7 16.5% Owner occupied34 83.5% Renter occupiedHouse owners and renters - Asian residents 341 38.9% Owner occupied535 61.1% Renter occupiedHouse owners and renters - Other race residents 509 42.3% Owner occupied695 57.7% Renter occupiedHouse owners and renters - Two or more races residents 324 26.8% Owner occupied882 73.2% Renter occupiedHouse owners and renters - White alone residents 8,375 72.8% Owner occupied3,126 27.2% Renter occupiedHouse owners and renters - Hispanic or Latino residents 559 33.7% Owner occupied1,099 66.3% Renter occupied
Language usage in Richfield
English speakers - Total 75.8% of residents of Richfield speak English at home.
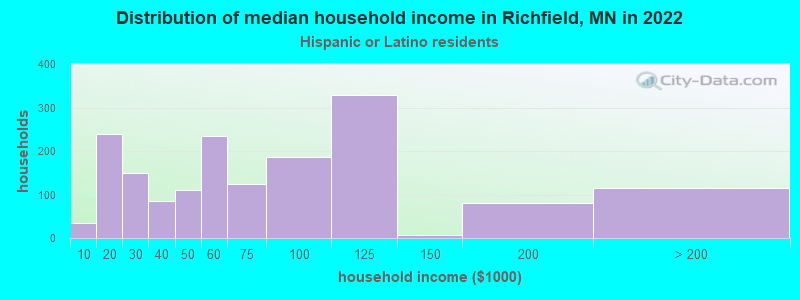
13.3% of residents speak Spanish at home 2,598 56.4% Speak English very well2,012 43.6% Speak English less than very well10.3% of residents speak other language at home 2,259 63.2% Speak English very well1,316 36.8% Speak English less than very well
English speakers - Born in the United States 90.8% of residents of Richfield speak English at home.
5.3% of residents speak Spanish at home 468 100.0% Speak English very well3.5% of residents speak other language at home 250 80.9% Speak English very well59 19.1% Speak English less than very well
English speakers - Native, born elsewhere 29.4% of residents of Richfield speak English at home.
69.0% of residents speak Spanish at home 142 67.3% Speak English very well69 32.7% Speak English less than very well8.2% of residents speak other language at home 25 100.0% Speak English very well
English speakers - Foreign-born 17.0% of residents of Richfield speak English at home.
36.3% of residents speak Spanish at home 598 26.8% Speak English very well1,633 73.2% Speak English less than very well44.8% of residents speak other language at home 1,589 57.7% Speak English very well1,167 42.3% Speak English less than very well
White (Caucasian) - Speak only English Native:
96.2% (20,311)Foreign-born:
37.4% (167)
White (Caucasian) - Speak another language Native:
3.7% (782)Foreign-born:
60.8% (272)
Black or African American - Speak only English Native:
83.7% (1,867)Foreign-born:
20.9% (336)
Black or African American - Speak another language Native:
15.5% (346)Foreign-born:
78.1% (1,253)
American Indian / Alaska Native - Speak only English Native:
81.8% (67)Foreign-born:
20.3% (27)
Asian - Speak only English Native:
40.7% (233)Foreign-born:
13.4% (208)
Asian - Speak another language Native:
58.7% (337)Foreign-born:
86.3% (1,336)
Other race - Speak only English Native:
45.3% (842)Foreign-born:
11.5% (236)
Other race - Speak another language Native:
53.3% (990)Foreign-born:
88.6% (1,817)
Two or more races - Speak only English Native:
69.9% (2,004)Foreign-born:
14.1% (94)
Two or more races - Speak another language Native:
27.1% (776)Foreign-born:
85.2% (571)
White alone - Speak only English Native:
98.1% (20,070)Foreign-born:
65.4% (149)
White alone - Speak another language Native:
1.9% (391)Foreign-born:
38.4% (87)
Hispanic or Latino - Speak only English Native:
39.4% (1,400)Foreign-born:
11.4% (291)
Hispanic or Latino - Speak another language Native:
58.0% (2,059)Foreign-born:
87.9% (2,247)
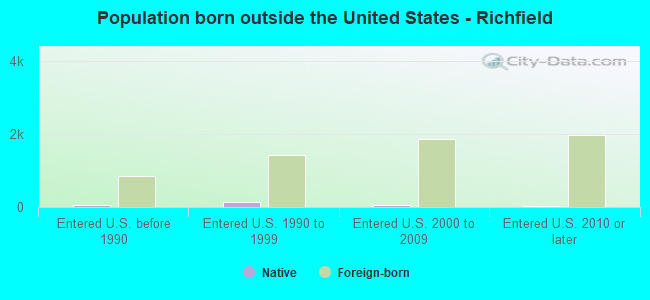
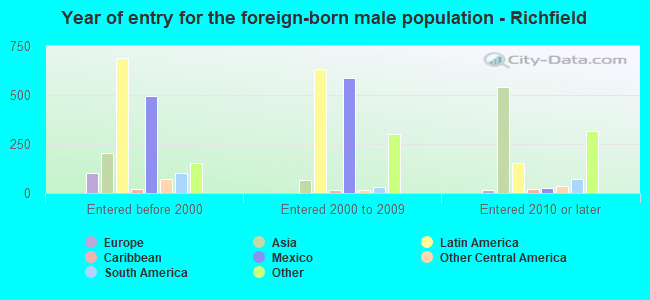
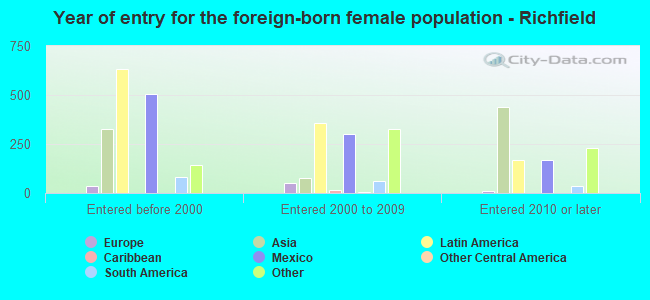
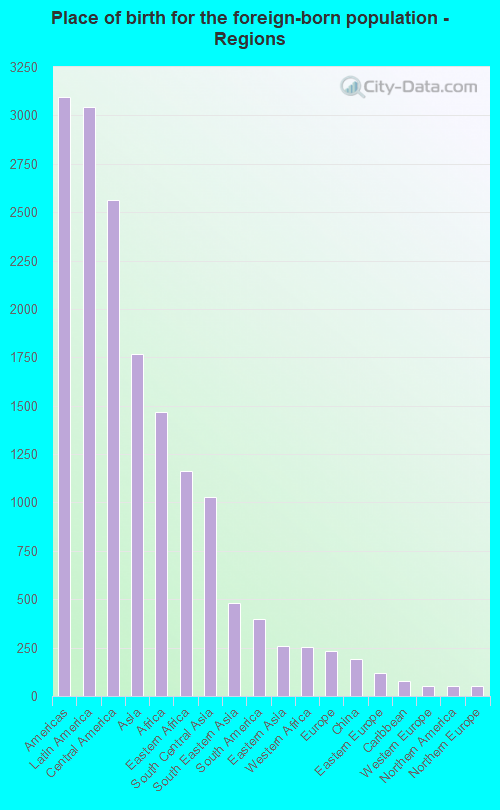
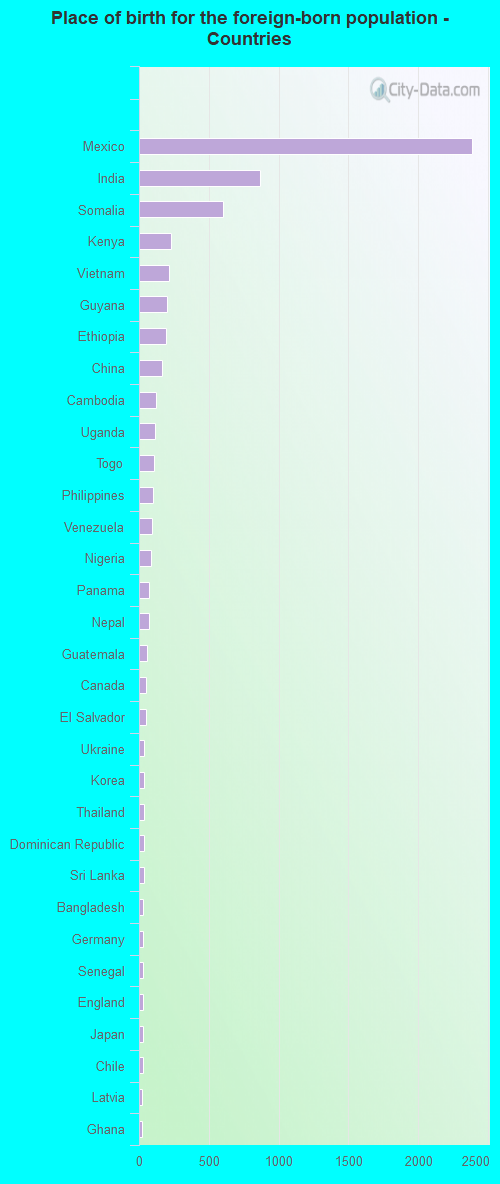
Foreign-born residents in Richfield 6,568 residents are foreign born (8.0% Latin America , 4.6% Asia , 3.8% Africa ).
This city:
18.0%Minnesota:
8.5%
Marital status for residents in Richfield Marital status - White (Caucasian) population 15 years and over
Males 35.7% Never married53.5% Now married0.4% Separated3.0% Widowed7.4% DivorcedFemales 29.1% Never married49.8% Now married0.4% Separated7.6% Widowed13.0% DivorcedWomen who gave birth in the past 12 months Now married:
85.1% (223)Unmarried:
14.9% (39)
Women who did not give birth in the past 12 months Now married:
48.0% (2,395)Unmarried:
52.0% (2,594)
Marital status - Black or African American population 15 years and over
Males 45.4% Never married40.0% Now married1.5% Separated1.9% Widowed11.2% DivorcedFemales 42.9% Never married41.9% Now married1.8% Separated2.4% Widowed10.9% DivorcedWomen who did not give birth in the past 12 months Now married:
49.7% (563)Unmarried:
50.3% (570)
Marital status - American Indian / Alaska Native population 15 years and over
Males 36.0% Never married64.0% Now married0.0% Separated0.0% Widowed0.0% DivorcedFemales 20.0% Never married60.0% Now married0.0% Separated0.0% Widowed20.0% DivorcedWomen who did not give birth in the past 12 months Now married:
63.6% (30)Unmarried:
36.4% (17)
Marital status - Asian population 15 years and over
Males 35.7% Never married60.4% Now married0.0% Separated1.9% Widowed2.0% DivorcedFemales 32.9% Never married56.2% Now married1.6% Separated2.0% Widowed7.3% DivorcedWomen who gave birth in the past 12 months Now married:
100.0% (22)Unmarried:
0.0% (0)
Women who did not give birth in the past 12 months Now married:
53.3% (420)Unmarried:
46.7% (368)
Marital status - Other race population 15 years and over
Males 33.3% Never married59.2% Now married2.0% Separated1.3% Widowed4.2% DivorcedFemales 38.5% Never married53.6% Now married0.7% Separated4.5% Widowed2.8% DivorcedWomen who gave birth in the past 12 months Now married:
0.0% (0)Unmarried:
100.0% (23)
Women who did not give birth in the past 12 months Now married:
37.2% (348)Unmarried:
62.8% (586)
Marital status - Two or more races population 15 years and over
Males 53.5% Never married45.1% Now married0.0% Separated0.0% Widowed1.4% DivorcedFemales 47.7% Never married44.1% Now married1.6% Separated2.2% Widowed4.5% DivorcedWomen who gave birth in the past 12 months Now married:
100.0% (15)Unmarried:
0.0% (0)
Women who did not give birth in the past 12 months Now married:
41.7% (517)Unmarried:
58.3% (724)
Marital status - White alone, not Hispanic / Latino population 15 years and over
Males 34.6% Never married54.5% Now married0.4% Separated3.1% Widowed7.5% DivorcedFemales 28.0% Never married50.6% Now married0.4% Separated8.0% Widowed13.0% DivorcedWomen who gave birth in the past 12 months Now married:
88.2% (211)Unmarried:
11.8% (28)
Women who did not give birth in the past 12 months Now married:
49.3% (2,310)Unmarried:
50.7% (2,374)
Marital status - Hispanic or Latino population 15 years and over
Males 37.2% Never married57.3% Now married1.2% Separated0.8% Widowed3.4% DivorcedFemales 40.5% Never married50.6% Now married0.4% Separated2.6% Widowed5.8% DivorcedWomen who gave birth in the past 12 months Now married:
45.2% (29)Unmarried:
54.8% (35)
Women who did not give birth in the past 12 months Now married:
41.8% (790)Unmarried:
58.2% (1,099)
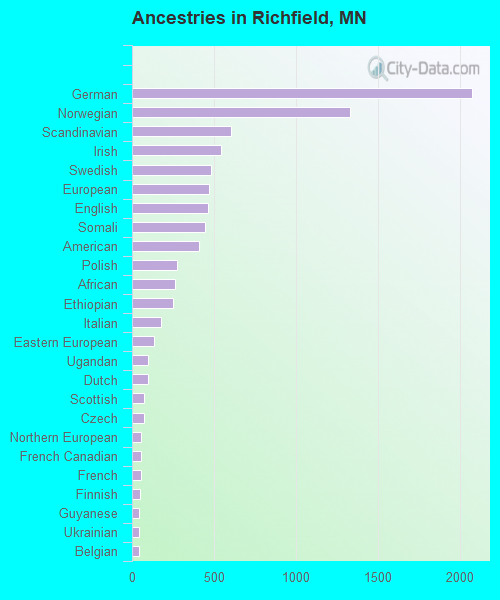
Ancestries in Richfield
2,076 12.8% German1,332 8.2% Norwegian603 3.7% Scandinavian544 3.3% Irish482 3.0% Swedish470 2.9% European465 2.9% English444 2.7% Somali412 2.5% American277 1.7% Polish262 1.6% African251 1.5% Ethiopian179 1.1% Italian134 0.8% Eastern European99 0.6% Ugandan98 0.6% Dutch75 0.5% Scottish71 0.4% Czech57 0.4% Northern European54 0.3% French Canadian52 0.3% French47 0.3% Finnish45 0.3% Guyanese44 0.3% Ukrainian42 0.3% Belgian41 0.3% Latvian35 0.2% Yugoslavian35 0.2% Sudanese31 0.2% Kenyan27 0.2% Portuguese26 0.2% Slovak24 0.1% Russian22 0.1% Danish20 0.1% Hungarian18 0.1% Bulgarian17 0.1% Iranian17 0.1% Liberian16 0.10% Haitian15 0.09% Luxembourger14 0.09% Ghanaian13 0.08% British12 0.07% Scotch-Irish12 0.07% Canadian10 0.06% Croatian8 0.05% Senegalese8 0.05% Brazilian4 0.02% Czechoslovakian4 0.02% Lithuanian4 0.02% Austrian4 0.02% Moroccan3 0.02% Romanian1 0.01% Welsh
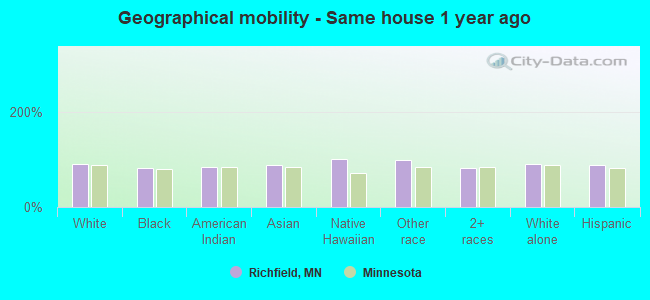
Geographical mobility in Richfield Same house 1 year ago 19,956 89.7% White (Caucasian)3,260 82.0% Black or African American147 84.5% American Indian / Alaska Native1,884 86.7% Asian16 100.0% Native Hawaiian / Pacific Islander4,079 98.0% Other race3,261 82.0% Two or more races19,037 89.5% White alone, not Hispanic / Latino6,118 89.3% Hispanic or LatinoMoved within same county 1,314 5.9% White / Caucasian191 4.8% Black or African American4 2.4% American Indian / Alaska Native149 6.9% Asian80 1.9% Other race491 12.4% Two or more races1,253 5.9% White alone, not Hispanic / Latino578 8.4% Hispanic or LatinoMoved within same state 714 3.2% White / Caucasian129 3.2% Black or African American20 11.6% American Indian / Alaska Native15 0.7% Asian33 0.8% Other race124 3.1% Two or more races724 3.4% White alone, not Hispanic / Latino46 0.7% Hispanic or LatinoMoved from different state 311 1.4% White / Caucasian528 13.3% Black or African American64 3.0% Asian10 0.2% Other race35 0.9% Two or more races303 1.4% White alone, not Hispanic / Latino46 0.7% Hispanic or LatinoMoved from abroad 16 0.1% White69 3.2% Asian20 0.5% Other race17 0.1% White alone, not Hispanic / Latino21 0.3% Hispanic or Latino
Children Nativity (place of birth) in Richfield
Children under 6 years - Living with two parents Both parents native 1,161 100.0% NativeBoth parents foreign-born 392 90.9% Native39 9.1% Foreign-bornOne native, one foreign-born parent 345 100.0% NativeChildren under 6 years - Living with one parent Native parent 191 100.0% NativeForeign-born parent 65 100.0% NativeChildren 6 to 17 years - Living with two parents Both parents native 1,889 97.6% Native47 2.4% Foreign-bornBoth parents foreign-born 878 89.4% Native105 10.6% Foreign-bornOne native, one foreign-born parent 389 100.0% NativeChildren 6 to 17 years - Living with one parent Native parent 684 100.0% NativeForeign-born parent 398 56.0% Native313 44.0% Foreign-born
Grandparents responsible for own grandchildren in Richfield
Grandparents (30 to 59 years) White / Caucasian 3 9.7% Responsible for grandchildren29 90.3% Not responsible for grandchildrenBlack or African American 53 77.9% Responsible for grandchildren15 22.1% Not responsible for grandchildrenAmerican Indian / Alaska Native 1 48.3% Responsible for grandchildren1 51.7% Not responsible for grandchildrenAsian 21 100.0% Not responsible for grandchildrenOther race 25 70.1% Responsible for grandchildren11 29.9% Not responsible for grandchildrenTwo or more races 4 100.0% Not responsible for grandchildrenWhite alone, not Hispanic / Latino 2 6.0% Responsible for grandchildren32 94.0% Not responsible for grandchildrenHispanic or Latino 15 62.6% Responsible for grandchildren9 37.4% Not responsible for grandchildrenGrandparents (60 years and over) White / Caucasian 25 21.9% Responsible for grandchildren89 78.1% Not responsible for grandchildrenBlack or African American 9 100.0% Not responsible for grandchildrenAsian 26 100.0% Not responsible for grandchildrenOther race 30 100.0% Not responsible for grandchildrenWhite alone, not Hispanic / Latino 25 21.4% Responsible for grandchildren93 78.6% Not responsible for grandchildrenHispanic or Latino 27 100.0% Not responsible for grandchildren