Races in Redmond, Oregon (OR) Detailed Stats
Data:
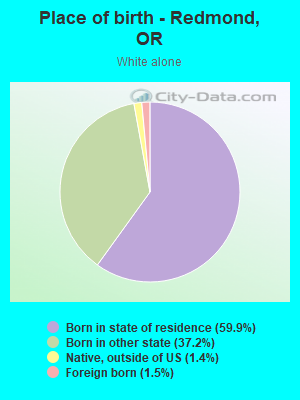
Races - White alone (%)
Races - White alone (% change since 2000)
Races - Black alone (%)
Races - Black alone (% change since 2000)
Races - American Indian alone (%)
Races - American Indian alone (% change since 2000)
Races - Asian alone (%)
Races - Asian alone (% change since 2000)
Races - Hispanic (%)
Races - Hispanic (% change since 2000)
Races - Native Hawaiian and Other Pacific Islander alone (%)
Races - Native Hawaiian and Other Pacific Islander alone (% change since 2000)
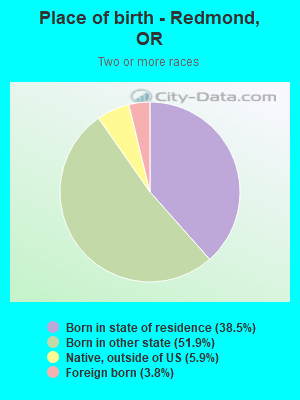
Races - Two or more races(%)
Races - Two or more races(% change since 2000)
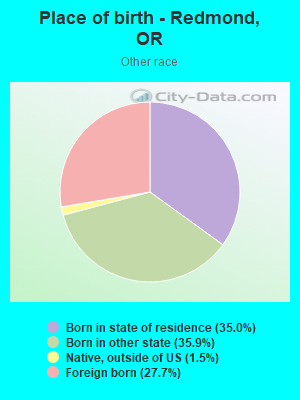
Races - Other race alone (%)
Races - Other race alone (% change since 2000)
Racial diversity
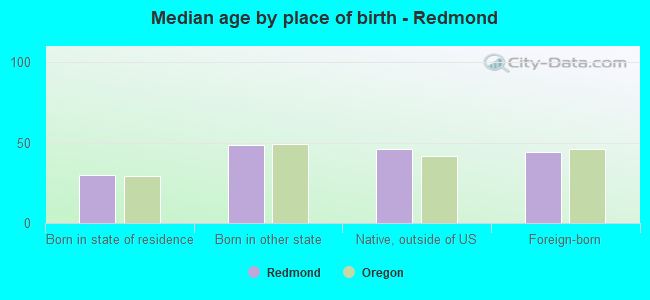
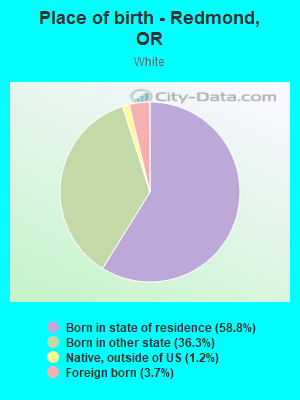
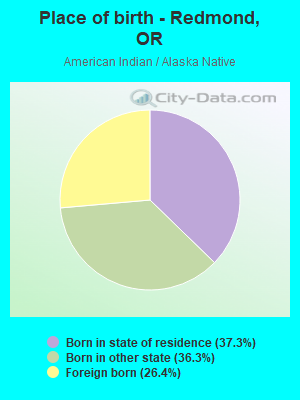
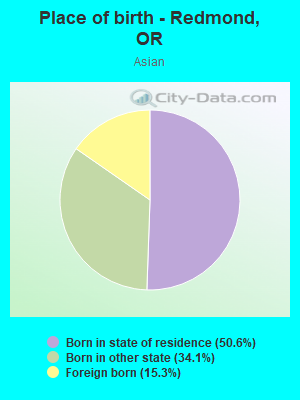
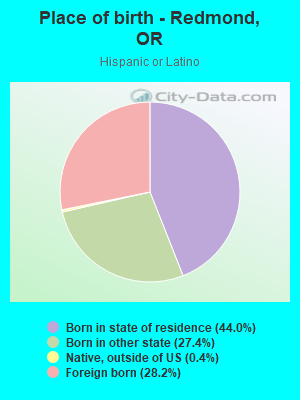
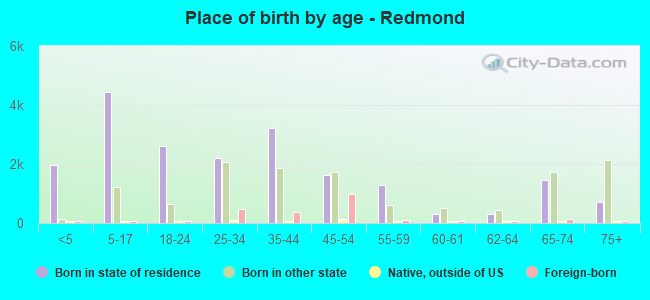
Place of birth - Born in state of residence (%)
Place of birth - Born in state of residence (%) - White
Place of birth - Born in state of residence (%) - Black or African American
Place of birth - Born in state of residence (%) - Asian
Place of birth - Born in state of residence (%) - Hispanic or Latino
Place of birth - Born in state of residence (%) - American Indian and Alaska Native
Place of birth - Born in state of residence (%) - Multirace
Place of birth - Born in state of residence (%) - Other Race
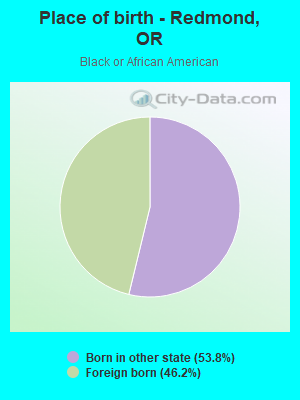
Place of birth - Born in other state (%)
Place of birth - Born in other state (%) - White
Place of birth - Born in other state (%) - Black or African American
Place of birth - Born in other state (%) - Asian
Place of birth - Born in other state (%) - Hispanic or Latino
Place of birth - Born in other state (%) - American Indian and Alaska Native
Place of birth - Born in other state (%) - Multirace
Place of birth - Born in other state (%) - Other Race
Place of birth - Native, outside of US (%)
Place of birth - Native, outside of US (%) - White
Place of birth - Native, outside of US (%) - Black or African American
Place of birth - Native, outside of US (%) - Asian
Place of birth - Native, outside of US (%) - Hispanic or Latino
Place of birth - Native, outside of US (%) - American Indian and Alaska Native
Place of birth - Native, outside of US (%) - Multirace
Place of birth - Native, outside of US (%) - Other Race
Place of birth - Foreign born (%)
Place of birth - Foreign born (%) - White
Place of birth - Foreign born (%) - Black or African American
Place of birth - Foreign born (%) - Asian
Place of birth - Foreign born (%) - Hispanic or Latino
Place of birth - Foreign born (%) - American Indian and Alaska Native
Place of birth - Foreign born (%) - Multirace
Place of birth - Foreign born (%) - Other Race
Residents speaking English at home (%)
Residents speaking English at home - Born in the United States (%)
Residents speaking English at home - Native, born elsewhere (%)
Residents speaking English at home - Foreign born (%)
Residents speaking Spanish at home (%)
Residents speaking Spanish at home - Born in the United States (%)
Residents speaking Spanish at home - Native, born elsewhere (%)
Residents speaking Spanish at home - Foreign born (%)
Residents speaking other language at home (%)
Residents speaking other language at home - Born in the United States (%)
Residents speaking other language at home - Native, born elsewhere (%)
Residents speaking other language at home - Foreign born (%)
Marital status - Never married (%)
Marital status - Now married (%)
Marital status - Separated (%)
Marital status - Widowed (%)
Marital status - Divorced (%)
Ancestries Reported - Arab (%)
Ancestries Reported - Czech (%)
Ancestries Reported - Danish (%)
Ancestries Reported - Dutch (%)
Ancestries Reported - English (%)
Ancestries Reported - French (%)
Ancestries Reported - French Canadian (%)
Ancestries Reported - German (%)
Ancestries Reported - Greek (%)
Ancestries Reported - Hungarian (%)
Ancestries Reported - Irish (%)
Ancestries Reported - Italian (%)
Ancestries Reported - Lithuanian (%)
Ancestries Reported - Norwegian (%)
Ancestries Reported - Polish (%)
Ancestries Reported - Portuguese (%)
Ancestries Reported - Russian (%)
Ancestries Reported - Scotch-Irish (%)
Ancestries Reported - Scottish (%)
Ancestries Reported - Slovak (%)
Ancestries Reported - Subsaharan African (%)
Ancestries Reported - Swedish (%)
Ancestries Reported - Swiss (%)
Ancestries Reported - Ukrainian (%)
Ancestries Reported - United States (%)
Ancestries Reported - Welsh (%)
Ancestries Reported - West Indian (%)
Ancestries Reported - Other (%)
Geographical mobility - Same house 1 year ago (%)
Geographical mobility - Same house 1 year ago (%) - White
Geographical mobility - Same house 1 year ago (%) - Black or African American
Geographical mobility - Same house 1 year ago (%) - Asian
Geographical mobility - Same house 1 year ago (%) - Hispanic or Latino
Geographical mobility - Same house 1 year ago (%) - American Indian and Alaska Native
Geographical mobility - Same house 1 year ago (%) - Multirace
Geographical mobility - Same house 1 year ago (%) - Other Race
Geographical mobility - Moved within same county (%)
Geographical mobility - Moved within same county (%) - White
Geographical mobility - Moved within same county (%) - Black or African American
Geographical mobility - Moved within same county (%) - Asian
Geographical mobility - Moved within same county (%) - Hispanic or Latino
Geographical mobility - Moved within same county (%) - American Indian and Alaska Native
Geographical mobility - Moved within same county (%) - Multirace
Geographical mobility - Moved within same county (%) - Other Race
Geographical mobility - Moved from different county within same state (%)
Geographical mobility - Moved from different county within same state (%) - White
Geographical mobility - Moved from different county within same state (%) - Black or African American
Geographical mobility - Moved from different county within same state (%) - Asian
Geographical mobility - Moved from different county within same state (%) - Hispanic or Latino
Geographical mobility - Moved from different county within same state (%) - American Indian and Alaska Native
Geographical mobility - Moved from different county within same state (%) - Multirace
Geographical mobility - Moved from different county within same state (%) - Other Race
Geographical mobility - Moved from different state (%)
Geographical mobility - Moved from different state (%) - White
Geographical mobility - Moved from different state (%) - Black or African American
Geographical mobility - Moved from different state (%) - Asian
Geographical mobility - Moved from different state (%) - Hispanic or Latino
Geographical mobility - Moved from different state (%) - American Indian and Alaska Native
Geographical mobility - Moved from different state (%) - Multirace
Geographical mobility - Moved from different state (%) - Other Race
Geographical mobility - Moved from abroad (%)
Geographical mobility - Moved from abroad (%) - White
Geographical mobility - Moved from abroad (%) - Black or African American
Geographical mobility - Moved from abroad (%) - Asian
Geographical mobility - Moved from abroad (%) - Hispanic or Latino
Geographical mobility - Moved from abroad (%) - American Indian and Alaska Native
Geographical mobility - Moved from abroad (%) - Multirace
Geographical mobility - Moved from abroad (%) - Other Race
Place of birth for the foreign-born population - Ireland (%)
Place of birth for the foreign-born population - Denmark (%)
Place of birth for the foreign-born population - Norway (%)
Place of birth for the foreign-born population - Sweden (%)
Place of birth for the foreign-born population - United Kingdom (%)
Place of birth for the foreign-born population - England (%)
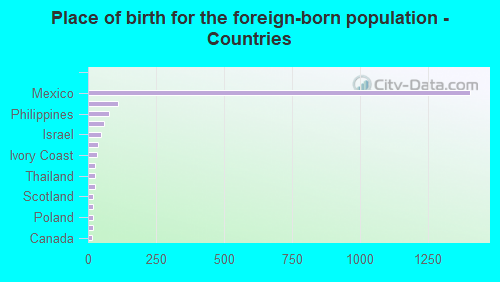
Place of birth for the foreign-born population - Scotland (%)
Place of birth for the foreign-born population - Other Northern Europe (%)
Place of birth for the foreign-born population - Austria (%)
Place of birth for the foreign-born population - Belgium (%)
Place of birth for the foreign-born population - France (%)
Place of birth for the foreign-born population - Germany (%)
Place of birth for the foreign-born population - Netherlands (%)
Place of birth for the foreign-born population - Switzerland (%)
Place of birth for the foreign-born population - Other Western Europe (%)
Place of birth for the foreign-born population - Greece (%)
Place of birth for the foreign-born population - Italy (%)
Place of birth for the foreign-born population - Portugal (%)
Place of birth for the foreign-born population - Spain (%)
Place of birth for the foreign-born population - Other Southern Europe (%)
Place of birth for the foreign-born population - Albania (%)
Place of birth for the foreign-born population - Belarus (%)
Place of birth for the foreign-born population - Bosnia and Herzegovina (%)
Place of birth for the foreign-born population - Bulgaria (%)
Place of birth for the foreign-born population - Croatia (%)
Place of birth for the foreign-born population - Czechoslovakia (%)
Place of birth for the foreign-born population - Hungary (%)
Place of birth for the foreign-born population - Latvia (%)
Place of birth for the foreign-born population - Lithuania (%)
Place of birth for the foreign-born population - North Macedonia (Macedonia) (%)
Place of birth for the foreign-born population - Moldova (%)
Place of birth for the foreign-born population - Poland (%)
Place of birth for the foreign-born population - Romania (%)
Place of birth for the foreign-born population - Russia (%)
Place of birth for the foreign-born population - Serbia (%)
Place of birth for the foreign-born population - Ukraine (%)
Place of birth for the foreign-born population - Other Eastern Europe (%)
Place of birth for the foreign-born population - China (%)
Place of birth for the foreign-born population - Hong Kong (%)
Place of birth for the foreign-born population - Taiwan (%)
Place of birth for the foreign-born population - Japan (%)
Place of birth for the foreign-born population - Korea (%)
Place of birth for the foreign-born population - Other Eastern Asia (%)
Place of birth for the foreign-born population - Afghanistan (%)
Place of birth for the foreign-born population - Bangladesh (%)
Place of birth for the foreign-born population - India (%)
Place of birth for the foreign-born population - Iran (%)
Place of birth for the foreign-born population - Kazakhstan (%)
Place of birth for the foreign-born population - Nepal (%)
Place of birth for the foreign-born population - Pakistan (%)
Place of birth for the foreign-born population - Sri Lanka (%)
Place of birth for the foreign-born population - Uzbekistan (%)
Place of birth for the foreign-born population - Other South Central Asia (%)
Place of birth for the foreign-born population - Burma (%)
Place of birth for the foreign-born population - Cambodia (%)
Place of birth for the foreign-born population - Indonesia (%)
Place of birth for the foreign-born population - Laos (%)
Place of birth for the foreign-born population - Malaysia (%)
Place of birth for the foreign-born population - Philippines (%)
Place of birth for the foreign-born population - Singapore (%)
Place of birth for the foreign-born population - Thailand (%)
Place of birth for the foreign-born population - Vietnam (%)
Place of birth for the foreign-born population - Other South Eastern Asia (%)
Place of birth for the foreign-born population - Armenia (%)
Place of birth for the foreign-born population - Iraq (%)
Place of birth for the foreign-born population - Israel (%)
Place of birth for the foreign-born population - Jordan (%)
Place of birth for the foreign-born population - Kuwait (%)
Place of birth for the foreign-born population - Lebanon (%)
Place of birth for the foreign-born population - Saudi Arabia (%)
Place of birth for the foreign-born population - Syria (%)
Place of birth for the foreign-born population - Turkey (%)
Place of birth for the foreign-born population - Yemen (%)
Place of birth for the foreign-born population - Other Western Asia (%)
Place of birth for the foreign-born population - Eritrea (%)
Place of birth for the foreign-born population - Ethiopia (%)
Place of birth for the foreign-born population - Kenya (%)
Place of birth for the foreign-born population - Somalia (%)
Place of birth for the foreign-born population - Uganda (%)
Place of birth for the foreign-born population - Zimbabwe (%)
Place of birth for the foreign-born population - Other Eastern Africa (%)
Place of birth for the foreign-born population - Cameroon (%)
Place of birth for the foreign-born population - Congo (%)
Place of birth for the foreign-born population - Democratic Republic of Congo (Zaire) (%)
Place of birth for the foreign-born population - Other Middle Africa (%)
Place of birth for the foreign-born population - Egypt (%)
Place of birth for the foreign-born population - Morocco (%)
Place of birth for the foreign-born population - Sudan (%)
Place of birth for the foreign-born population - Other Northern Africa (%)
Place of birth for the foreign-born population - South Africa (%)
Place of birth for the foreign-born population - Other Southern Africa (%)
Place of birth for the foreign-born population - Cabo Verde (%)
Place of birth for the foreign-born population - Ghana (%)
Place of birth for the foreign-born population - Liberia (%)
Place of birth for the foreign-born population - Nigeria (%)
Place of birth for the foreign-born population - Senegal (%)
Place of birth for the foreign-born population - Sierra Leone (%)
Place of birth for the foreign-born population - Other Western Africa (%)
Place of birth for the foreign-born population - Australia (%)
Place of birth for the foreign-born population - New Zealand (%)
Place of birth for the foreign-born population - Fiji (%)
Place of birth for the foreign-born population - Micronesia (%)
Place of birth for the foreign-born population - Bahamas (%)
Place of birth for the foreign-born population - Barbados (%)
Place of birth for the foreign-born population - Cuba (%)
Place of birth for the foreign-born population - Dominica (%)
Place of birth for the foreign-born population - Dominican Republic (%)
Place of birth for the foreign-born population - Grenada (%)
Place of birth for the foreign-born population - Haiti (%)
Place of birth for the foreign-born population - Jamaica (%)
Place of birth for the foreign-born population - St. Vincent and the Grenadines (%)
Place of birth for the foreign-born population - Trinidad and Tobago (%)
Place of birth for the foreign-born population - West Indies (%)
Place of birth for the foreign-born population - Other Caribbean (%)
Place of birth for the foreign-born population - Belize (%)
Place of birth for the foreign-born population - Costa Rica (%)
Place of birth for the foreign-born population - El Salvador (%)
Place of birth for the foreign-born population - Guatemala (%)
Place of birth for the foreign-born population - Honduras (%)
Place of birth for the foreign-born population - Mexico (%)
Place of birth for the foreign-born population - Nicaragua (%)
Place of birth for the foreign-born population - Panama (%)
Place of birth for the foreign-born population - Other Central America (%)
Place of birth for the foreign-born population - Argentina (%)
Place of birth for the foreign-born population - Bolivia (%)
Place of birth for the foreign-born population - Brazil (%)
Place of birth for the foreign-born population - Chile (%)
Place of birth for the foreign-born population - Colombia (%)
Place of birth for the foreign-born population - Ecuador (%)
Place of birth for the foreign-born population - Guyana (%)
Place of birth for the foreign-born population - Peru (%)
Place of birth for the foreign-born population - Uruguay (%)
Place of birth for the foreign-born population - Venezuela (%)
Place of birth for the foreign-born population - Other South America (%)
Place of birth for the foreign-born population - Canada (%)
Place of birth for the foreign-born population - Other Northern America (%)
Place of birth for the foreign-born population - Other (%)
Latest news about races in Redmond, OR collected exclusively by city-data.com from local newspapers, TV, and radio stations
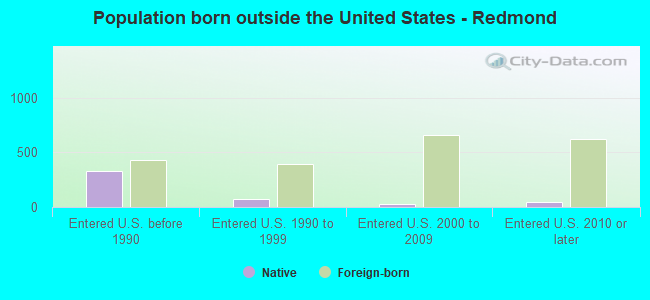
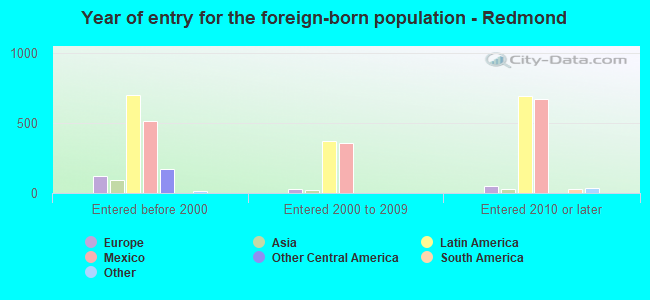
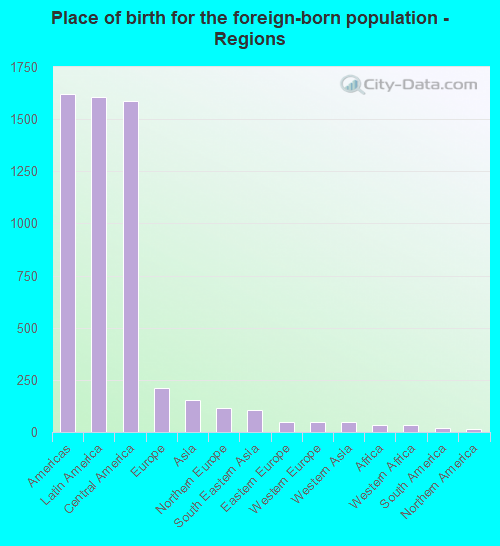
According to 2022 data, the most numerous races in Redmond, OR are White alone (28,520 residents), Hispanic (4,950 residents), and Two or more races (942 residents). 88.5% of Redmond residents speak English at home. 5.7% of Redmond, OR residents are foreign-born (4.6% born in Latin America, 0.6% born in Europe), which is 57.8% less than the foreign-born rate of 9.0% across the entire state of Oregon.
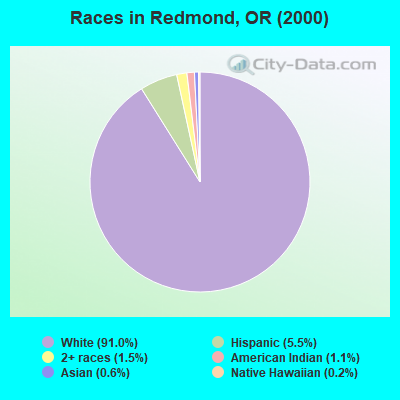
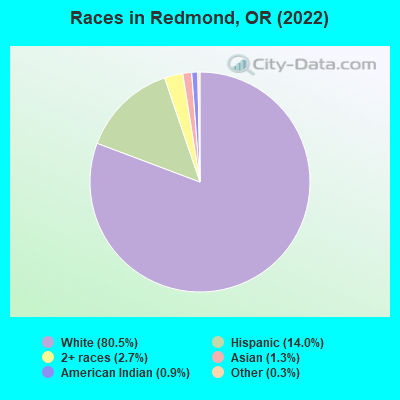
Race distribution in Redmond
2000 2022
2,857,616 83.5% White alone 275,314 8.0% Hispanic 100,333 2.9% Asian alone 82,733 2.4% Two or more races 53,325 1.6% Black alone 40,130 1.2% American Indian alone 7,398 0.2% Native Hawaiian and Other 4,550 0.1% Other race alone
3,037,571 71.6% White alone 609,538 14.4% Hispanic 252,744 6.0% Two or more races 191,283 4.5% Asian alone 78,228 1.8% Black alone 29,399 0.7% American Indian alone 25,731 0.6% Other race alone 15,643 0.4% Native Hawaiian and Other
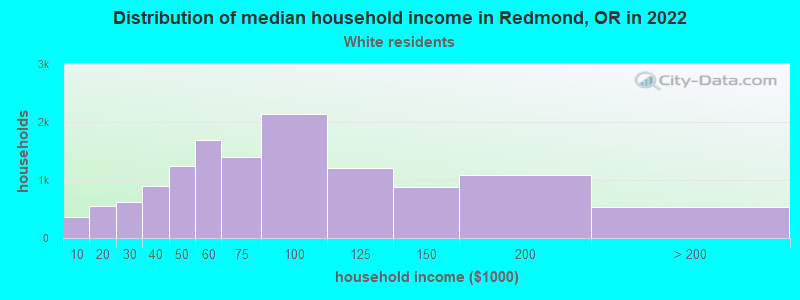
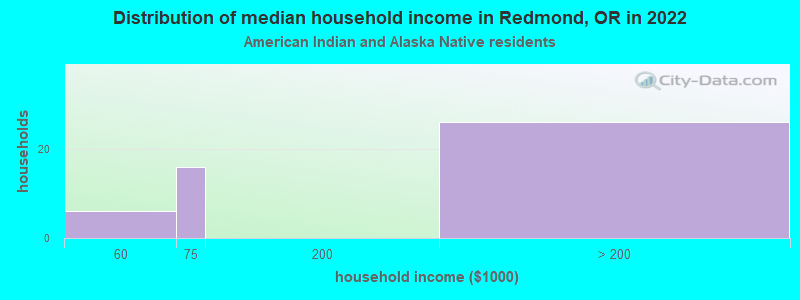
Income and house value in Redmond Median household income in 2022 $72,076 White non-Hispanic householders$78,088 Some other race householders$86,226 Two or more races householders$74,151 Hispanic or Latino race householdersMedian 2022 house value $496,484 White Non-Hispanic householders$440,024 American Indian or Alaska Native householders $487,522 Asian householders$728,147 Some other race householders$532,331 Two or more races householders$672,135 Hispanic or Latino householders
Median age by race in Redmond
37.3 Median age for White residents37.4 37.0 7.9 Median age for Black or African American residents-692,929,292.2 7.4 36.2 Median age for American Indian / Alaska Native residents34.0 42.6 16.9 Median age for Asian residents12.4 38.9 -764,705,881.6 Median age for Native Hawaiian / Pacific Islander residents-764,119,600.6 -774,891,774.1 35.6 Median age for Other race residents25.1 44.1 37.6 Median age for Two or more races residents29.8 43.4 38.0 Median age for White alone residents38.7 37.3 26.0 Median age for Hispanic or Latino residents30.7 24.8
Owner/renter occupied households by race in Redmond
House owners and renters - White residents 7,990 61.7% Owner occupied4,967 38.3% Renter occupiedHouse owners and renters - Black or African American residents 36 100.0% Renter occupiedHouse owners and renters - American Indian / Alaska Native residents 48 86.3% Owner occupied8 13.7% Renter occupiedHouse owners and renters - Asian residents 40 100.0% Owner occupiedHouse owners and renters - Other race residents 63 40.6% Owner occupied93 59.4% Renter occupiedHouse owners and renters - Two or more races residents 436 92.3% Owner occupied36 7.7% Renter occupiedHouse owners and renters - White alone residents 7,654 62.2% Owner occupied4,653 37.8% Renter occupiedHouse owners and renters - Hispanic or Latino residents 607 58.6% Owner occupied429 41.4% Renter occupied
Language usage in Redmond
English speakers - Total 88.5% of residents of Redmond speak English at home.
10.1% of residents speak Spanish at home 2,058 61.2% Speak English very well1,302 38.8% Speak English less than very well1.4% of residents speak other language at home 413 85.7% Speak English very well69 14.3% Speak English less than very well
English speakers - Born in the United States 93.9% of residents of Redmond speak English at home.
4.4% of residents speak Spanish at home 499 88.3% Speak English very well66 11.7% Speak English less than very well0.9% of residents speak other language at home 120 100.0% Speak English very well
All residents speak only English at home
English speakers - Foreign-born 11.8% of residents of Redmond speak English at home.
71.2% of residents speak Spanish at home 393 26.8% Speak English very well1,071 73.2% Speak English less than very well12.3% of residents speak other language at home 175 69.4% Speak English very well77 30.6% Speak English less than very well
White (Caucasian) - Speak only English Native:
94.9% (26,892)Foreign-born:
18.7% (219)
White (Caucasian) - Speak another language Native:
5.2% (1,473)Foreign-born:
80.0% (937)
American Indian / Alaska Native - Speak another language Native:
16.5% (71)Foreign-born:
100.0% (170)
Asian - Speak only English Native:
89.4% (448)Foreign-born:
20.7% (22)
Asian - Speak another language Native:
7.2% (36)Foreign-born:
82.4% (85)
Other race - Speak another language Native:
56.6% (561)Foreign-born:
100.0% (831)
Two or more races - Speak another language Native:
9.1% (116)Foreign-born:
100.0% (55)
White alone - Speak only English Native:
98.4% (26,193)Foreign-born:
51.6% (215)
White alone - Speak another language Native:
1.6% (418)Foreign-born:
49.5% (206)
Hispanic or Latino - Speak another language Native:
61.4% (1,838)Foreign-born:
99.9% (1,385)
Foreign-born residents in Redmond 2,020 residents are foreign born (4.6% Latin America , 0.6% Europe ).
This city:
5.7%Oregon:
9.8%
Marital status for residents in Redmond Marital status - White (Caucasian) population 15 years and over
Males 28.1% Never married55.6% Now married0.2% Separated2.4% Widowed13.8% DivorcedFemales 26.1% Never married46.3% Now married1.2% Separated9.7% Widowed16.7% DivorcedWomen who gave birth in the past 12 months Now married:
77.4% (380)Unmarried:
22.6% (111)
Women who did not give birth in the past 12 months Now married:
43.8% (3,133)Unmarried:
56.2% (4,018)
Marital status - American Indian / Alaska Native population 15 years and over
Males 33.7% Never married56.7% Now married9.6% Separated0.0% Widowed0.0% DivorcedFemales 20.3% Never married24.6% Now married0.0% Separated0.0% Widowed55.2% DivorcedWomen who gave birth in the past 12 months Now married:
100.0% (33)Unmarried:
0.0% (0)
Women who did not give birth in the past 12 months Now married:
0.0% (0)Unmarried:
100.0% (59)
Marital status - Asian population 15 years and over
Males 0.0% Never married100.0% Now married0.0% Separated0.0% Widowed0.0% DivorcedFemales 13.0% Never married60.3% Now married0.0% Separated0.0% Widowed26.7% DivorcedWomen who did not give birth in the past 12 months Now married:
75.0% (53)Unmarried:
25.0% (18)
Marital status - Other race population 15 years and over
Males 47.1% Never married50.8% Now married0.0% Separated0.0% Widowed2.1% DivorcedFemales 19.8% Never married58.0% Now married0.0% Separated9.6% Widowed12.6% DivorcedWomen who gave birth in the past 12 months Now married:
39.1% (25)Unmarried:
60.9% (38)
Women who did not give birth in the past 12 months Now married:
57.5% (292)Unmarried:
42.5% (216)
Marital status - Two or more races population 15 years and over
Males 15.3% Never married84.7% Now married0.0% Separated0.0% Widowed0.0% DivorcedFemales 21.8% Never married59.3% Now married0.0% Separated2.7% Widowed16.1% DivorcedWomen who did not give birth in the past 12 months Now married:
53.7% (290)Unmarried:
46.3% (250)
Marital status - White alone, not Hispanic / Latino population 15 years and over
Males 26.9% Never married55.5% Now married0.2% Separated2.6% Widowed14.8% DivorcedFemales 26.3% Never married45.2% Now married1.3% Separated9.9% Widowed17.3% DivorcedWomen who gave birth in the past 12 months Now married:
75.4% (334)Unmarried:
24.6% (109)
Women who did not give birth in the past 12 months Now married:
42.4% (2,774)Unmarried:
57.6% (3,772)
Marital status - Hispanic or Latino population 15 years and over
Males 44.3% Never married55.7% Now married0.0% Separated0.0% Widowed0.0% DivorcedFemales 19.5% Never married61.0% Now married0.0% Separated6.6% Widowed12.8% DivorcedWomen who gave birth in the past 12 months Now married:
75.4% (87)Unmarried:
24.6% (28)
Women who did not give birth in the past 12 months Now married:
58.2% (567)Unmarried:
41.8% (407)
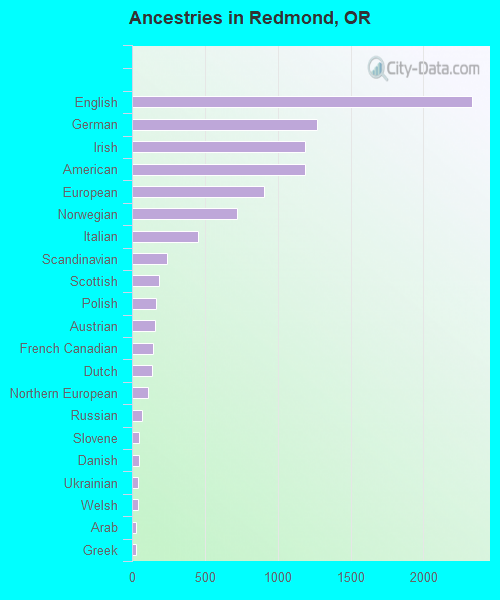
Ancestries in Redmond
2,333 15.7% English1,266 8.5% German1,187 8.0% Irish1,184 8.0% American905 6.1% European719 4.9% Norwegian456 3.1% Italian242 1.6% Scandinavian183 1.2% Scottish168 1.1% Polish157 1.1% Austrian142 1.0% French Canadian137 0.9% Dutch108 0.7% Northern European71 0.5% Russian48 0.3% Slovene45 0.3% Danish41 0.3% Ukrainian39 0.3% Welsh28 0.2% Arab28 0.2% Greek21 0.1% Romanian17 0.1% French15 0.1% African15 0.1% Swedish13 0.09% British11 0.07% Bulgarian11 0.07% Scotch-Irish10 0.07% Czechoslovakian
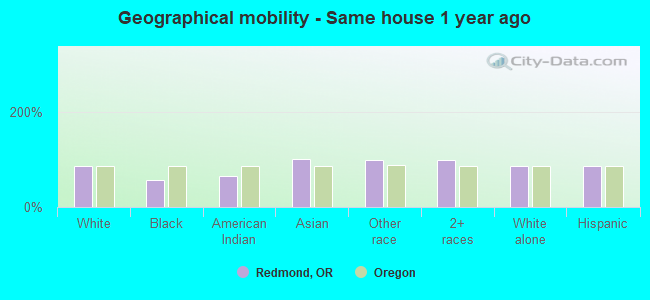
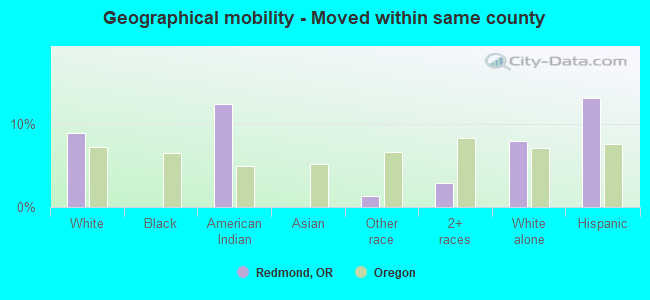
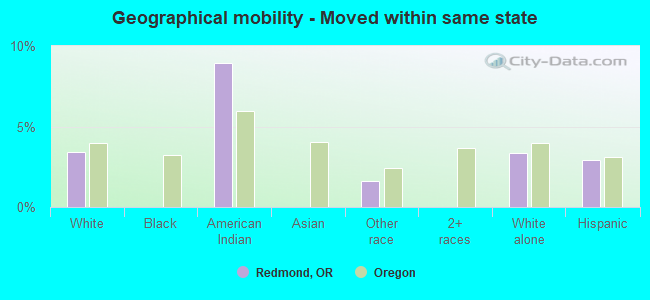
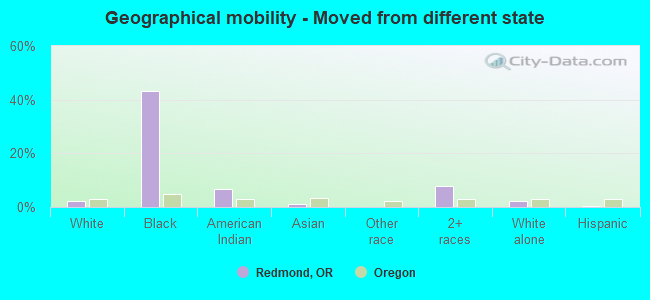
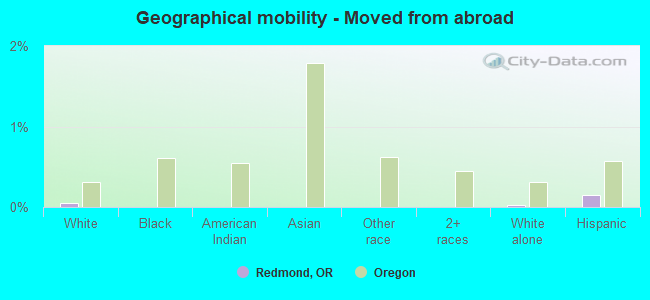
Geographical mobility in Redmond Same house 1 year ago 26,265 85.2% White (Caucasian)40 56.3% Black or African American372 66.0% American Indian / Alaska Native343 100.0% Asian1,997 99.3% Other race1,330 98.5% Two or more races24,242 86.0% White alone, not Hispanic / Latino4,113 86.2% Hispanic or LatinoMoved within same county 2,778 9.0% White / Caucasian71 12.5% American Indian / Alaska Native28 1.4% Other race39 2.9% Two or more races2,270 8.1% White alone, not Hispanic / Latino630 13.2% Hispanic or LatinoMoved within same state 1,048 3.4% White / Caucasian51 9.0% American Indian / Alaska Native32 1.6% Other race953 3.4% White alone, not Hispanic / Latino139 2.9% Hispanic or LatinoMoved from different state 636 2.1% White / Caucasian31 43.4% Black or African American38 6.7% American Indian / Alaska Native4 1.2% Asian108 8.0% Two or more races634 2.2% White alone, not Hispanic / Latino22 0.5% Hispanic or LatinoMoved from abroad 14 0.0% White6 0.0% White alone, not Hispanic / Latino7 0.1% Hispanic or Latino
Children Nativity (place of birth) in Redmond
Children under 6 years - Living with two parents Both parents native 1,092 100.0% NativeBoth parents foreign-born 63 100.0% NativeOne native, one foreign-born parent 128 100.0% NativeChildren under 6 years - Living with one parent Native parent 781 100.0% NativeForeign-born parent 27 100.0% NativeChildren 6 to 17 years - Living with two parents Both parents native 3,154 100.0% NativeBoth parents foreign-born 462 100.0% NativeOne native, one foreign-born parent 32 100.0% NativeChildren 6 to 17 years - Living with one parent Native parent 1,006 100.0% NativeForeign-born parent 190 64.7% Native104 35.3% Foreign-born
Grandparents responsible for own grandchildren in Redmond
Grandparents (30 to 59 years) White / Caucasian 240 37.7% Responsible for grandchildren397 62.3% Not responsible for grandchildrenAmerican Indian / Alaska Native 5 5.3% Responsible for grandchildren93 94.7% Not responsible for grandchildrenOther race 36 100.0% Responsible for grandchildrenWhite alone, not Hispanic / Latino 77 17.7% Responsible for grandchildren361 82.3% Not responsible for grandchildrenHispanic or Latino 62 41.5% Responsible for grandchildren88 58.5% Not responsible for grandchildren
Grandparents (60 years and over) White / Caucasian 32 100.0% Not responsible for grandchildrenAmerican Indian / Alaska Native 46 100.0% Responsible for grandchildrenOther race 45 100.0% Not responsible for grandchildrenWhite alone, not Hispanic / Latino 33 100.0% Not responsible for grandchildrenHispanic or Latino 40 100.0% Not responsible for grandchildren