Races in Red Wing, Minnesota (MN) Detailed Stats
Data:
Races - White alone (%)
Races - White alone (% change since 2000)
Races - Black alone (%)
Races - Black alone (% change since 2000)
Races - American Indian alone (%)
Races - American Indian alone (% change since 2000)
Races - Asian alone (%)
Races - Asian alone (% change since 2000)
Races - Hispanic (%)
Races - Hispanic (% change since 2000)
Races - Native Hawaiian and Other Pacific Islander alone (%)
Races - Native Hawaiian and Other Pacific Islander alone (% change since 2000)
Races - Two or more races(%)
Races - Two or more races(% change since 2000)
Races - Other race alone (%)
Races - Other race alone (% change since 2000)
Racial diversity
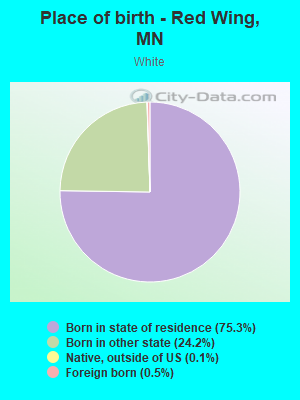
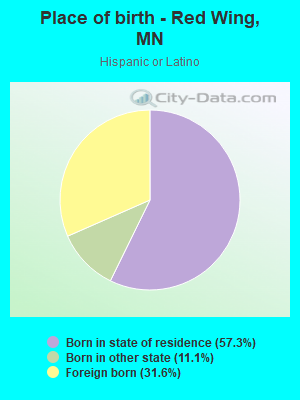
Place of birth - Born in state of residence (%)
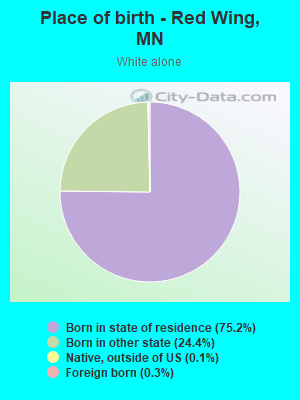
Place of birth - Born in state of residence (%) - White
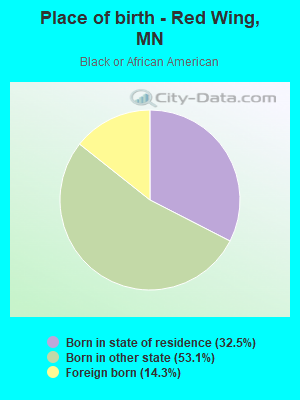
Place of birth - Born in state of residence (%) - Black or African American
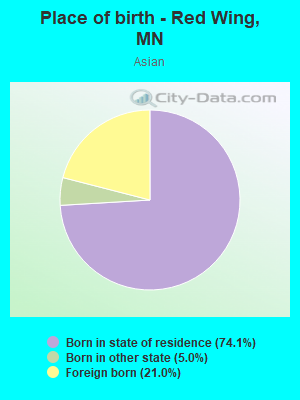
Place of birth - Born in state of residence (%) - Asian
Place of birth - Born in state of residence (%) - Hispanic or Latino
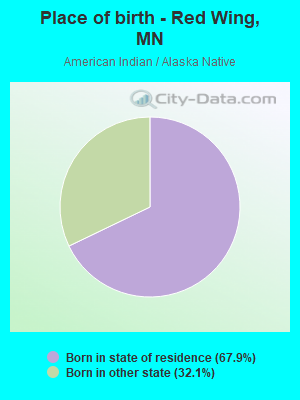
Place of birth - Born in state of residence (%) - American Indian and Alaska Native
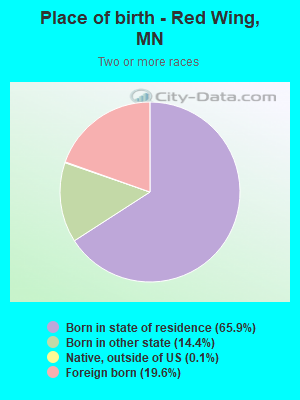
Place of birth - Born in state of residence (%) - Multirace
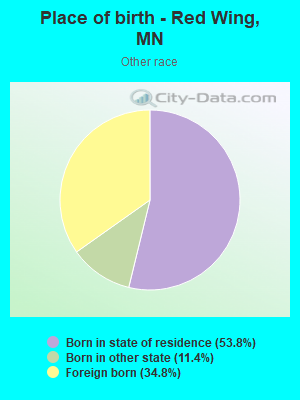
Place of birth - Born in state of residence (%) - Other Race
Place of birth - Born in other state (%)
Place of birth - Born in other state (%) - White
Place of birth - Born in other state (%) - Black or African American
Place of birth - Born in other state (%) - Asian
Place of birth - Born in other state (%) - Hispanic or Latino
Place of birth - Born in other state (%) - American Indian and Alaska Native
Place of birth - Born in other state (%) - Multirace
Place of birth - Born in other state (%) - Other Race
Place of birth - Native, outside of US (%)
Place of birth - Native, outside of US (%) - White
Place of birth - Native, outside of US (%) - Black or African American
Place of birth - Native, outside of US (%) - Asian
Place of birth - Native, outside of US (%) - Hispanic or Latino
Place of birth - Native, outside of US (%) - American Indian and Alaska Native
Place of birth - Native, outside of US (%) - Multirace
Place of birth - Native, outside of US (%) - Other Race
Place of birth - Foreign born (%)
Place of birth - Foreign born (%) - White
Place of birth - Foreign born (%) - Black or African American
Place of birth - Foreign born (%) - Asian
Place of birth - Foreign born (%) - Hispanic or Latino
Place of birth - Foreign born (%) - American Indian and Alaska Native
Place of birth - Foreign born (%) - Multirace
Place of birth - Foreign born (%) - Other Race
Residents speaking English at home (%)
Residents speaking English at home - Born in the United States (%)
Residents speaking English at home - Native, born elsewhere (%)
Residents speaking English at home - Foreign born (%)
Residents speaking Spanish at home (%)
Residents speaking Spanish at home - Born in the United States (%)
Residents speaking Spanish at home - Native, born elsewhere (%)
Residents speaking Spanish at home - Foreign born (%)
Residents speaking other language at home (%)
Residents speaking other language at home - Born in the United States (%)
Residents speaking other language at home - Native, born elsewhere (%)
Residents speaking other language at home - Foreign born (%)
Marital status - Never married (%)
Marital status - Now married (%)
Marital status - Separated (%)
Marital status - Widowed (%)
Marital status - Divorced (%)
Ancestries Reported - Arab (%)
Ancestries Reported - Czech (%)
Ancestries Reported - Danish (%)
Ancestries Reported - Dutch (%)
Ancestries Reported - English (%)
Ancestries Reported - French (%)
Ancestries Reported - French Canadian (%)
Ancestries Reported - German (%)
Ancestries Reported - Greek (%)
Ancestries Reported - Hungarian (%)
Ancestries Reported - Irish (%)
Ancestries Reported - Italian (%)
Ancestries Reported - Lithuanian (%)
Ancestries Reported - Norwegian (%)
Ancestries Reported - Polish (%)
Ancestries Reported - Portuguese (%)
Ancestries Reported - Russian (%)
Ancestries Reported - Scotch-Irish (%)
Ancestries Reported - Scottish (%)
Ancestries Reported - Slovak (%)
Ancestries Reported - Subsaharan African (%)
Ancestries Reported - Swedish (%)
Ancestries Reported - Swiss (%)
Ancestries Reported - Ukrainian (%)
Ancestries Reported - United States (%)
Ancestries Reported - Welsh (%)
Ancestries Reported - West Indian (%)
Ancestries Reported - Other (%)
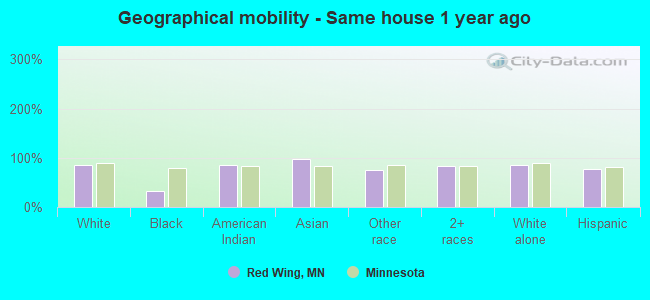
Geographical mobility - Same house 1 year ago (%)
Geographical mobility - Same house 1 year ago (%) - White
Geographical mobility - Same house 1 year ago (%) - Black or African American
Geographical mobility - Same house 1 year ago (%) - Asian
Geographical mobility - Same house 1 year ago (%) - Hispanic or Latino
Geographical mobility - Same house 1 year ago (%) - American Indian and Alaska Native
Geographical mobility - Same house 1 year ago (%) - Multirace
Geographical mobility - Same house 1 year ago (%) - Other Race
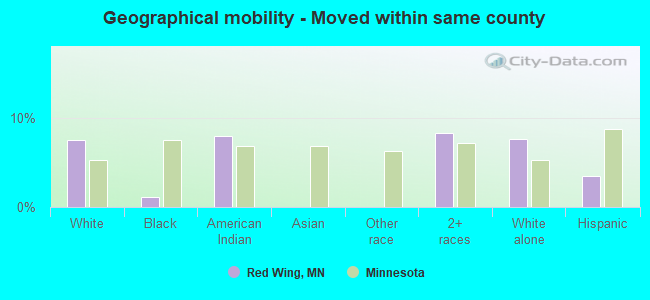
Geographical mobility - Moved within same county (%)
Geographical mobility - Moved within same county (%) - White
Geographical mobility - Moved within same county (%) - Black or African American
Geographical mobility - Moved within same county (%) - Asian
Geographical mobility - Moved within same county (%) - Hispanic or Latino
Geographical mobility - Moved within same county (%) - American Indian and Alaska Native
Geographical mobility - Moved within same county (%) - Multirace
Geographical mobility - Moved within same county (%) - Other Race
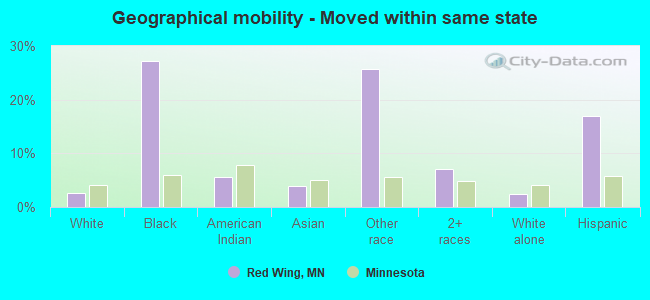
Geographical mobility - Moved from different county within same state (%)
Geographical mobility - Moved from different county within same state (%) - White
Geographical mobility - Moved from different county within same state (%) - Black or African American
Geographical mobility - Moved from different county within same state (%) - Asian
Geographical mobility - Moved from different county within same state (%) - Hispanic or Latino
Geographical mobility - Moved from different county within same state (%) - American Indian and Alaska Native
Geographical mobility - Moved from different county within same state (%) - Multirace
Geographical mobility - Moved from different county within same state (%) - Other Race
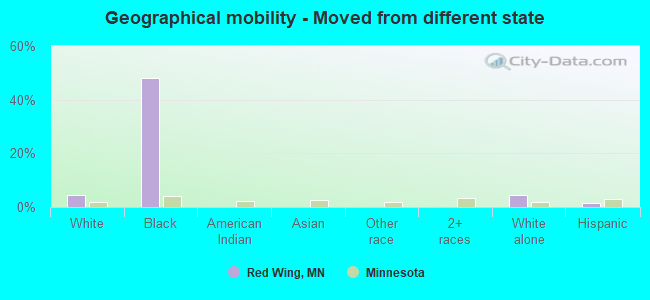
Geographical mobility - Moved from different state (%)
Geographical mobility - Moved from different state (%) - White
Geographical mobility - Moved from different state (%) - Black or African American
Geographical mobility - Moved from different state (%) - Asian
Geographical mobility - Moved from different state (%) - Hispanic or Latino
Geographical mobility - Moved from different state (%) - American Indian and Alaska Native
Geographical mobility - Moved from different state (%) - Multirace
Geographical mobility - Moved from different state (%) - Other Race
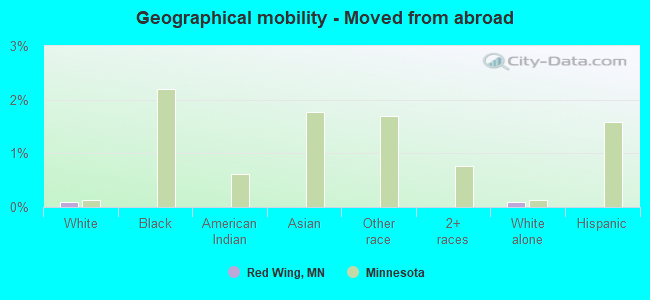
Geographical mobility - Moved from abroad (%)
Geographical mobility - Moved from abroad (%) - White
Geographical mobility - Moved from abroad (%) - Black or African American
Geographical mobility - Moved from abroad (%) - Asian
Geographical mobility - Moved from abroad (%) - Hispanic or Latino
Geographical mobility - Moved from abroad (%) - American Indian and Alaska Native
Geographical mobility - Moved from abroad (%) - Multirace
Geographical mobility - Moved from abroad (%) - Other Race
Place of birth for the foreign-born population - Ireland (%)
Place of birth for the foreign-born population - Denmark (%)
Place of birth for the foreign-born population - Norway (%)
Place of birth for the foreign-born population - Sweden (%)
Place of birth for the foreign-born population - United Kingdom (%)
Place of birth for the foreign-born population - England (%)
Place of birth for the foreign-born population - Scotland (%)
Place of birth for the foreign-born population - Other Northern Europe (%)
Place of birth for the foreign-born population - Austria (%)
Place of birth for the foreign-born population - Belgium (%)
Place of birth for the foreign-born population - France (%)
Place of birth for the foreign-born population - Germany (%)
Place of birth for the foreign-born population - Netherlands (%)
Place of birth for the foreign-born population - Switzerland (%)
Place of birth for the foreign-born population - Other Western Europe (%)
Place of birth for the foreign-born population - Greece (%)
Place of birth for the foreign-born population - Italy (%)
Place of birth for the foreign-born population - Portugal (%)
Place of birth for the foreign-born population - Spain (%)
Place of birth for the foreign-born population - Other Southern Europe (%)
Place of birth for the foreign-born population - Albania (%)
Place of birth for the foreign-born population - Belarus (%)
Place of birth for the foreign-born population - Bosnia and Herzegovina (%)
Place of birth for the foreign-born population - Bulgaria (%)
Place of birth for the foreign-born population - Croatia (%)
Place of birth for the foreign-born population - Czechoslovakia (%)
Place of birth for the foreign-born population - Hungary (%)
Place of birth for the foreign-born population - Latvia (%)
Place of birth for the foreign-born population - Lithuania (%)
Place of birth for the foreign-born population - North Macedonia (Macedonia) (%)
Place of birth for the foreign-born population - Moldova (%)
Place of birth for the foreign-born population - Poland (%)
Place of birth for the foreign-born population - Romania (%)
Place of birth for the foreign-born population - Russia (%)
Place of birth for the foreign-born population - Serbia (%)
Place of birth for the foreign-born population - Ukraine (%)
Place of birth for the foreign-born population - Other Eastern Europe (%)
Place of birth for the foreign-born population - China (%)
Place of birth for the foreign-born population - Hong Kong (%)
Place of birth for the foreign-born population - Taiwan (%)
Place of birth for the foreign-born population - Japan (%)
Place of birth for the foreign-born population - Korea (%)
Place of birth for the foreign-born population - Other Eastern Asia (%)
Place of birth for the foreign-born population - Afghanistan (%)
Place of birth for the foreign-born population - Bangladesh (%)
Place of birth for the foreign-born population - India (%)
Place of birth for the foreign-born population - Iran (%)
Place of birth for the foreign-born population - Kazakhstan (%)
Place of birth for the foreign-born population - Nepal (%)
Place of birth for the foreign-born population - Pakistan (%)
Place of birth for the foreign-born population - Sri Lanka (%)
Place of birth for the foreign-born population - Uzbekistan (%)
Place of birth for the foreign-born population - Other South Central Asia (%)
Place of birth for the foreign-born population - Burma (%)
Place of birth for the foreign-born population - Cambodia (%)
Place of birth for the foreign-born population - Indonesia (%)
Place of birth for the foreign-born population - Laos (%)
Place of birth for the foreign-born population - Malaysia (%)
Place of birth for the foreign-born population - Philippines (%)
Place of birth for the foreign-born population - Singapore (%)
Place of birth for the foreign-born population - Thailand (%)
Place of birth for the foreign-born population - Vietnam (%)
Place of birth for the foreign-born population - Other South Eastern Asia (%)
Place of birth for the foreign-born population - Armenia (%)
Place of birth for the foreign-born population - Iraq (%)
Place of birth for the foreign-born population - Israel (%)
Place of birth for the foreign-born population - Jordan (%)
Place of birth for the foreign-born population - Kuwait (%)
Place of birth for the foreign-born population - Lebanon (%)
Place of birth for the foreign-born population - Saudi Arabia (%)
Place of birth for the foreign-born population - Syria (%)
Place of birth for the foreign-born population - Turkey (%)
Place of birth for the foreign-born population - Yemen (%)
Place of birth for the foreign-born population - Other Western Asia (%)
Place of birth for the foreign-born population - Eritrea (%)
Place of birth for the foreign-born population - Ethiopia (%)
Place of birth for the foreign-born population - Kenya (%)
Place of birth for the foreign-born population - Somalia (%)
Place of birth for the foreign-born population - Uganda (%)
Place of birth for the foreign-born population - Zimbabwe (%)
Place of birth for the foreign-born population - Other Eastern Africa (%)
Place of birth for the foreign-born population - Cameroon (%)
Place of birth for the foreign-born population - Congo (%)
Place of birth for the foreign-born population - Democratic Republic of Congo (Zaire) (%)
Place of birth for the foreign-born population - Other Middle Africa (%)
Place of birth for the foreign-born population - Egypt (%)
Place of birth for the foreign-born population - Morocco (%)
Place of birth for the foreign-born population - Sudan (%)
Place of birth for the foreign-born population - Other Northern Africa (%)
Place of birth for the foreign-born population - South Africa (%)
Place of birth for the foreign-born population - Other Southern Africa (%)
Place of birth for the foreign-born population - Cabo Verde (%)
Place of birth for the foreign-born population - Ghana (%)
Place of birth for the foreign-born population - Liberia (%)
Place of birth for the foreign-born population - Nigeria (%)
Place of birth for the foreign-born population - Senegal (%)
Place of birth for the foreign-born population - Sierra Leone (%)
Place of birth for the foreign-born population - Other Western Africa (%)
Place of birth for the foreign-born population - Australia (%)
Place of birth for the foreign-born population - New Zealand (%)
Place of birth for the foreign-born population - Fiji (%)
Place of birth for the foreign-born population - Micronesia (%)
Place of birth for the foreign-born population - Bahamas (%)
Place of birth for the foreign-born population - Barbados (%)
Place of birth for the foreign-born population - Cuba (%)
Place of birth for the foreign-born population - Dominica (%)
Place of birth for the foreign-born population - Dominican Republic (%)
Place of birth for the foreign-born population - Grenada (%)
Place of birth for the foreign-born population - Haiti (%)
Place of birth for the foreign-born population - Jamaica (%)
Place of birth for the foreign-born population - St. Vincent and the Grenadines (%)
Place of birth for the foreign-born population - Trinidad and Tobago (%)
Place of birth for the foreign-born population - West Indies (%)
Place of birth for the foreign-born population - Other Caribbean (%)
Place of birth for the foreign-born population - Belize (%)
Place of birth for the foreign-born population - Costa Rica (%)
Place of birth for the foreign-born population - El Salvador (%)
Place of birth for the foreign-born population - Guatemala (%)
Place of birth for the foreign-born population - Honduras (%)
Place of birth for the foreign-born population - Mexico (%)
Place of birth for the foreign-born population - Nicaragua (%)
Place of birth for the foreign-born population - Panama (%)
Place of birth for the foreign-born population - Other Central America (%)
Place of birth for the foreign-born population - Argentina (%)
Place of birth for the foreign-born population - Bolivia (%)
Place of birth for the foreign-born population - Brazil (%)
Place of birth for the foreign-born population - Chile (%)
Place of birth for the foreign-born population - Colombia (%)
Place of birth for the foreign-born population - Ecuador (%)
Place of birth for the foreign-born population - Guyana (%)
Place of birth for the foreign-born population - Peru (%)
Place of birth for the foreign-born population - Uruguay (%)
Place of birth for the foreign-born population - Venezuela (%)
Place of birth for the foreign-born population - Other South America (%)
Place of birth for the foreign-born population - Canada (%)
Place of birth for the foreign-born population - Other Northern America (%)
Place of birth for the foreign-born population - Other (%)
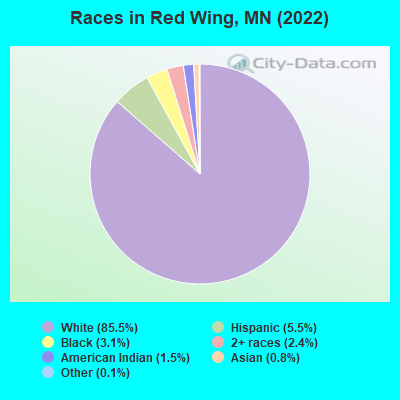
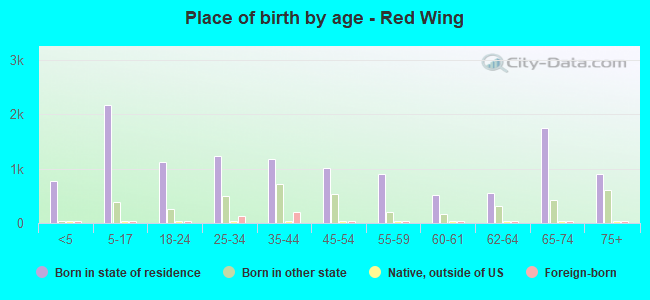
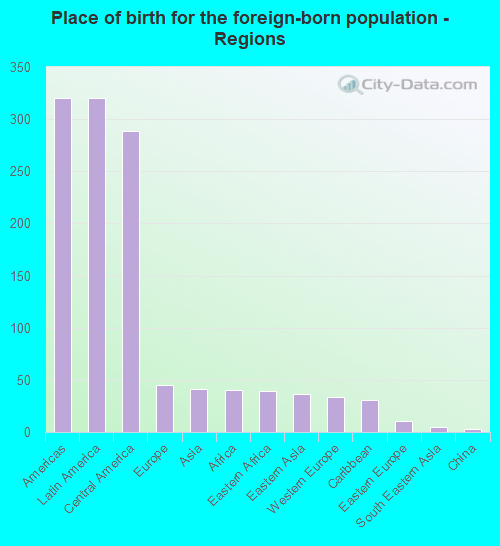
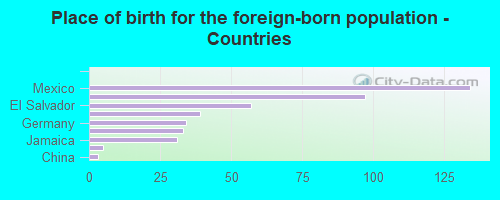
According to 2022 data, the most numerous races in Red Wing, MN are White alone (14,271 residents), Black alone (520 residents), and Hispanic (915 residents). 95.0% of Red Wing residents speak English at home. 2.7% of Red Wing, MN residents are foreign-born (1.9% born in Latin America), which is 198.1% less than the foreign-born rate of 8.0% across the entire state of Minnesota.
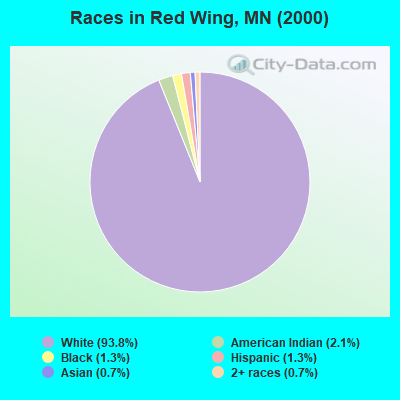
Race distribution in Red Wing
2000 2022
4,337,143 88.2% White alone 168,813 3.4% Black alone 143,382 2.9% Hispanic 141,083 2.9% Asian alone 70,304 1.4% Two or more races 52,009 1.1% American Indian alone 5,031 0.1% Other race alone 1,714 0.03% Native Hawaiian and Other
4,356,347 76.2% White alone 395,179 6.9% Black alone 333,830 5.8% Hispanic 294,800 5.2% Asian alone 259,649 4.5% Two or more races 42,125 0.7% American Indian alone 32,976 0.6% Other race alone 2,278 0.04% Native Hawaiian and Other
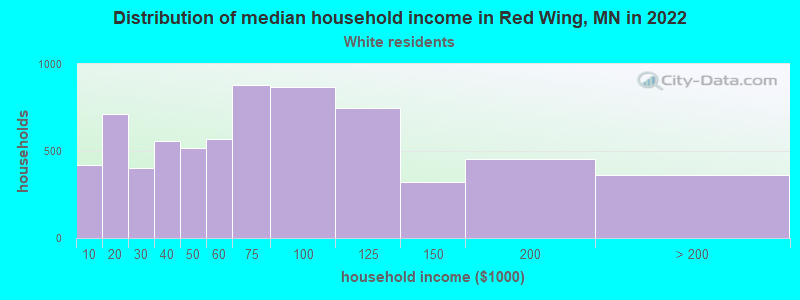
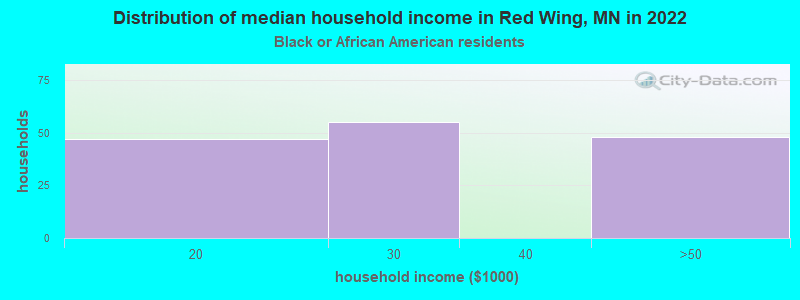
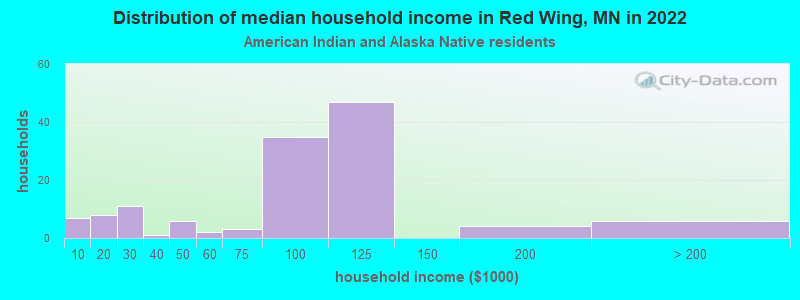
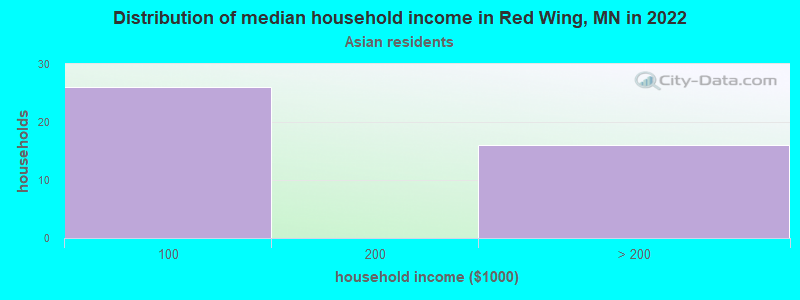
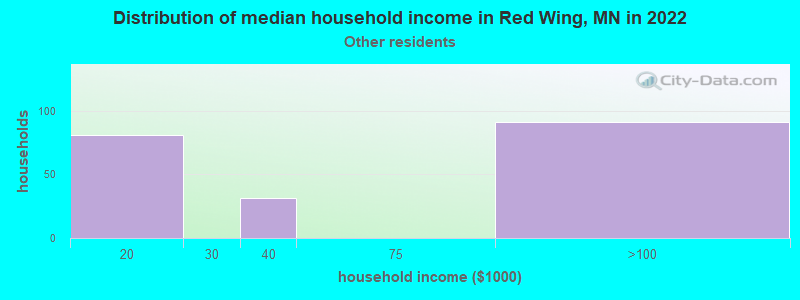
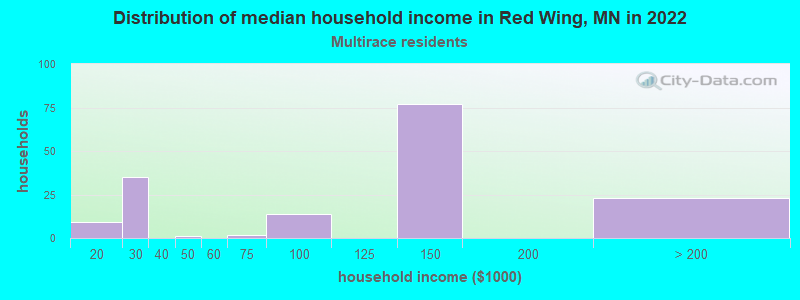
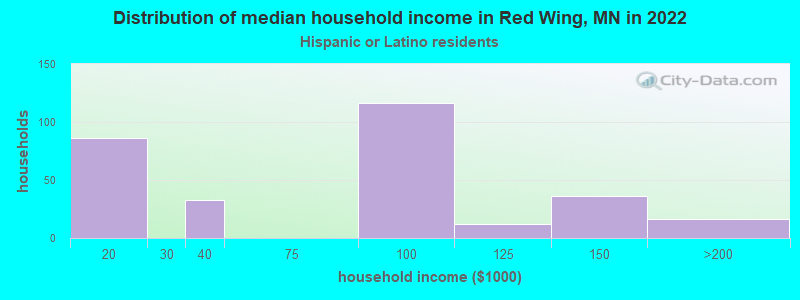
Income and house value in Red Wing Median household income in 2022 $63,818 White non-Hispanic householders$76,602 American Indian and Alaska Native householders$139,303 Two or more races householders$70,929 Hispanic or Latino race householdersMedian 2022 house value $244,746 White Non-Hispanic householders$147,710 American Indian or Alaska Native householders $970,358 Asian householders$164,098 Two or more races householders$242,589 Hispanic or Latino householders
Median age by race in Red Wing
47.3 Median age for White residents45.6 48.5 17.6 Median age for Black or African American residents11.8 28.9 27.7 Median age for American Indian / Alaska Native residents22.7 28.8 11.9 Median age for Asian residents11.8 35.3 -744,336,568.8 Median age for Native Hawaiian / Pacific Islander residents-856,799,036.4 -534,959,349.1 24.2 Median age for Other race residents23.7 34.6 25.0 Median age for Two or more races residents41.9 19.2 47.1 Median age for White alone residents46.0 48.9 24.1 Median age for Hispanic or Latino residents23.8 22.3
Owner/renter occupied households by race in Red Wing
House owners and renters - White residents 4,905 72.6% Owner occupied1,847 27.4% Renter occupiedHouse owners and renters - Black or African American residents 34 21.2% Owner occupied126 78.8% Renter occupiedHouse owners and renters - American Indian / Alaska Native residents 88 73.3% Owner occupied32 26.7% Renter occupiedHouse owners and renters - Asian residents 40 100.0% Owner occupiedHouse owners and renters - Other race residents 117 48.7% Owner occupied123 51.3% Renter occupiedHouse owners and renters - Two or more races residents 143 88.1% Owner occupied19 11.9% Renter occupiedHouse owners and renters - White alone residents 4,909 72.7% Owner occupied1,845 27.3% Renter occupiedHouse owners and renters - Hispanic or Latino residents 185 57.8% Owner occupied135 42.2% Renter occupied
Language usage in Red Wing
English speakers - Total 95.0% of residents of Red Wing speak English at home.
3.4% of residents speak Spanish at home 302 55.6% Speak English very well241 44.4% Speak English less than very well1.4% of residents speak other language at home 206 94.1% Speak English very well13 5.9% Speak English less than very well
English speakers - Born in the United States 98.0% of residents of Red Wing speak English at home.
1.0% of residents speak Spanish at home 40 100.0% Speak English very well0.8% of residents speak other language at home 34 100.0% Speak English very well
All residents speak only English at home
English speakers - Foreign-born 10.0% of residents of Red Wing speak English at home.
60.3% of residents speak Spanish at home 38 14.1% Speak English very well232 85.9% Speak English less than very well29.0% of residents speak other language at home 117 90.0% Speak English very well13 10.0% Speak English less than very well
White (Caucasian) - Speak only English Native:
99.6% (13,605)Foreign-born:
34.9% (23)
White (Caucasian) - Speak another language Native:
0.7% (93)Foreign-born:
63.4% (42)
Asian - Speak only English Native:
100.0% (107)Foreign-born:
27.5% (8)
Other race - Speak another language Native:
41.5% (150)Foreign-born:
97.5% (183)
Two or more races - Speak only English Native:
74.6% (411)Foreign-born:
10.9% (15)
Two or more races - Speak another language Native:
24.7% (136)Foreign-born:
90.5% (128)
White alone - Speak only English Native:
99.4% (13,562)Foreign-born:
19.3% (8)
White alone - Speak another language Native:
0.7% (91)Foreign-born:
78.4% (33)
Hispanic or Latino - Speak only English Native:
55.7% (315)Foreign-born:
7.2% (21)
Hispanic or Latino - Speak another language Native:
44.1% (250)Foreign-born:
91.3% (262)
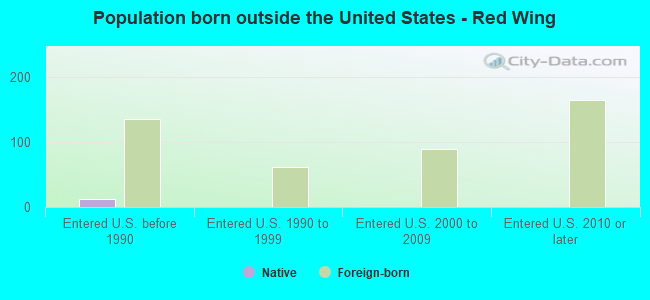
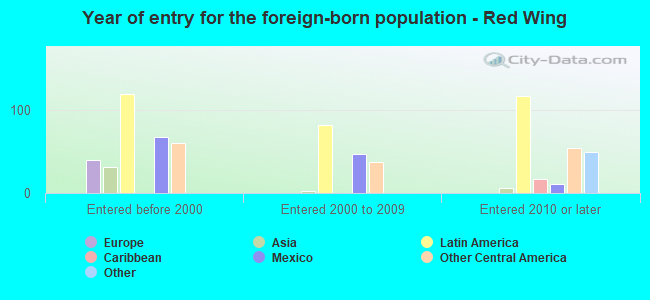
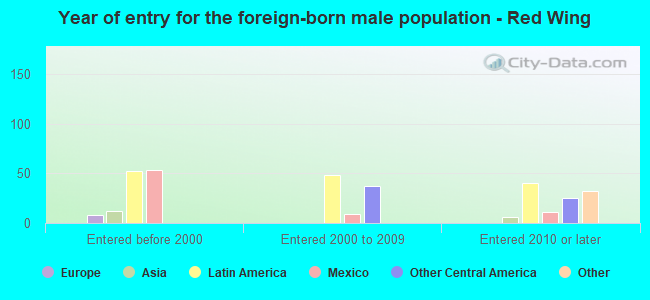
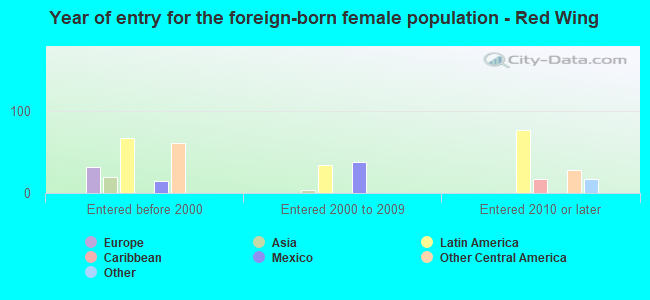
Foreign-born residents in Red Wing 448 residents are foreign born (1.9% Latin America ).
This city:
2.7%Minnesota:
8.5%
Marital status for residents in Red Wing Marital status - White (Caucasian) population 15 years and over
Males 32.0% Never married47.6% Now married0.6% Separated3.6% Widowed16.2% DivorcedFemales 22.6% Never married50.0% Now married1.2% Separated11.0% Widowed15.2% DivorcedWomen who gave birth in the past 12 months Now married:
57.4% (113)Unmarried:
42.6% (84)
Women who did not give birth in the past 12 months Now married:
45.1% (1,064)Unmarried:
54.9% (1,295)
Marital status - Black or African American population 15 years and over
Males 72.8% Never married12.6% Now married3.9% Separated1.0% Widowed9.7% DivorcedFemales 68.8% Never married14.2% Now married0.0% Separated0.0% Widowed17.0% DivorcedWomen who gave birth in the past 12 months Now married:
16.1% (5)Unmarried:
83.9% (27)
Women who did not give birth in the past 12 months Now married:
10.1% (14)Unmarried:
89.9% (129)
Marital status - American Indian / Alaska Native population 15 years and over
Males 75.0% Never married17.7% Now married3.1% Separated0.0% Widowed4.2% DivorcedFemales 32.1% Never married33.3% Now married23.8% Separated3.6% Widowed7.1% DivorcedWomen who did not give birth in the past 12 months Now married:
56.3% (74)Unmarried:
43.7% (57)
Marital status - Asian population 15 years and over
Males 0.0% Never married100.0% Now married0.0% Separated0.0% Widowed0.0% DivorcedFemales 59.0% Never married41.0% Now married0.0% Separated0.0% Widowed0.0% DivorcedWomen who did not give birth in the past 12 months Now married:
84.2% (16)Unmarried:
15.8% (3)
Marital status - Other race population 15 years and over
Males 45.3% Never married50.7% Now married0.0% Separated0.0% Widowed3.9% DivorcedFemales 16.0% Never married75.2% Now married0.0% Separated0.0% Widowed8.8% DivorcedWomen who gave birth in the past 12 months Now married:
100.0% (5)Unmarried:
0.0% (0)
Women who did not give birth in the past 12 months Now married:
70.5% (97)Unmarried:
29.5% (41)
Marital status - Two or more races population 15 years and over
Males 46.9% Never married49.5% Now married0.0% Separated0.0% Widowed3.6% DivorcedFemales 53.5% Never married34.2% Now married0.0% Separated8.9% Widowed3.5% DivorcedWomen who gave birth in the past 12 months Now married:
100.0% (21)Unmarried:
0.0% (0)
Women who did not give birth in the past 12 months Now married:
29.7% (60)Unmarried:
70.3% (142)
Marital status - White alone, not Hispanic / Latino population 15 years and over
Males 31.9% Never married47.5% Now married0.6% Separated3.6% Widowed16.4% DivorcedFemales 22.6% Never married50.0% Now married1.2% Separated11.0% Widowed15.2% DivorcedWomen who gave birth in the past 12 months Now married:
59.1% (115)Unmarried:
40.9% (79)
Women who did not give birth in the past 12 months Now married:
45.1% (1,079)Unmarried:
54.9% (1,314)
Marital status - Hispanic or Latino population 15 years and over
Males 41.4% Never married56.0% Now married0.0% Separated0.0% Widowed2.6% DivorcedFemales 33.9% Never married62.2% Now married0.0% Separated0.0% Widowed3.8% DivorcedWomen who gave birth in the past 12 months Now married:
40.0% (4)Unmarried:
60.0% (6)
Women who did not give birth in the past 12 months Now married:
58.5% (154)Unmarried:
41.5% (109)
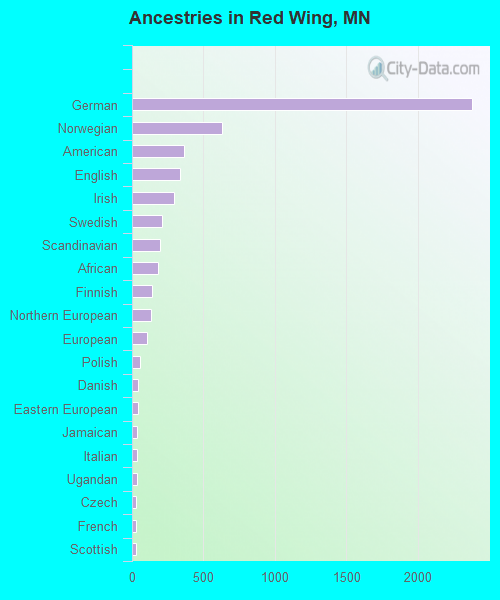
Ancestries in Red Wing
2,378 33.1% German628 8.7% Norwegian362 5.0% American336 4.7% English292 4.1% Irish212 3.0% Swedish194 2.7% Scandinavian184 2.6% African139 1.9% Finnish135 1.9% Northern European107 1.5% European55 0.8% Polish43 0.6% Danish42 0.6% Eastern European34 0.5% Jamaican33 0.5% Italian33 0.5% Ugandan27 0.4% Czech26 0.4% French26 0.4% Scottish21 0.3% Croatian21 0.3% French Canadian11 0.2% Romanian6 0.08% Dutch6 0.08% Greek5 0.07% British
Children Nativity (place of birth) in Red Wing
Children under 6 years - Living with two parents Both parents native 499 100.0% NativeChildren under 6 years - Living with one parent Native parent 297 100.0% NativeForeign-born parent 35 100.0% NativeChildren 6 to 17 years - Living with two parents Both parents native 1,380 99.8% Native3 0.2% Foreign-bornBoth parents foreign-born 75 100.0% NativeOne native, one foreign-born parent 13 100.0% NativeChildren 6 to 17 years - Living with one parent Native parent 712 100.0% NativeForeign-born parent 123 50.4% Native121 49.6% Foreign-born
Grandparents responsible for own grandchildren in Red Wing
Grandparents (30 to 59 years) White / Caucasian 2 100.0% Responsible for grandchildrenBlack or African American 32 100.0% Responsible for grandchildrenAmerican Indian / Alaska Native 12 69.6% Responsible for grandchildren5 30.4% Not responsible for grandchildrenTwo or more races 12 100.0% Responsible for grandchildrenWhite alone, not Hispanic / Latino 2 100.0% Responsible for grandchildrenGrandparents (60 years and over) White / Caucasian 53 42.1% Responsible for grandchildren73 57.9% Not responsible for grandchildrenAmerican Indian / Alaska Native 3 100.0% Responsible for grandchildrenWhite alone, not Hispanic / Latino 55 42.4% Responsible for grandchildren74 57.6% Not responsible for grandchildren