Races in Red Lion, Delaware (DE) Detailed Stats
Ancestries, Foreign-born residents, place of birth
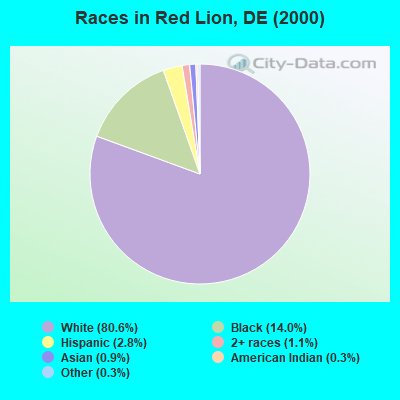
Race distribution in Red Lion

- 4,50680.6%White alone
- 78414.0%Black alone
- 1562.8%Hispanic
- 591.1%Two or more races
- 500.9%Asian alone
- 140.3%Other race alone
- 190.3%American Indian alone
- 10.02%Native Hawaiian and Other
Pacific Islander alone
2000
2022
-
- 567,97372.5%White alone
- 148,43518.9%Black alone
- 37,2774.8%Hispanic
- 16,1102.1%Asian alone
- 10,2221.3%Two or more races
- 2,3240.3%American Indian alone
- 1,0250.1%Other race alone
- 2340.03%Native Hawaiian and Other
Pacific Islander alone

-
- 599,34758.9%White alone
- 220,01021.6%Black alone
- 105,30010.3%Hispanic
- 46,0164.5%Two or more races
- 41,3504.1%Asian alone
- 5,0970.5%Other race alone
- 1,2760.1%American Indian alone

Income and house value in Red Lion
- Median household income in 2022
- $99,444White non-Hispanic householders
- $132,846Black householders
- $47,487American Indian and Alaska Native householders
- $84,983Asian householders
- $72,268Some other race householders
- $20,958Two or more races householders
- $163,656Hispanic or Latino race householders
- Median 2022 house value
- $408,334White Non-Hispanic householders
- $531,830Black or African American householders
- $228,816American Indian or Alaska Native householders
- $342,353Asian householders
- $342,353Some other race householders
- $194,207Two or more races householders
- $524,609Hispanic or Latino householders
Household income for White non-Hispanic householders

Household income for Black householders

Household income for American Indian and Alaska Native householders

Household income for Asian householders

Household income for Two or more races householders

Household income for Hispanic or Latino race householders

Zip code: 19720