Races in Ravenswood Estates, Florida (FL) Detailed Stats
Ancestries, Foreign-born residents, place of birth

Discuss Ravenswood Estates, Florida races on our local forum with over 2,400,000 registered users
18.0% of Ravenswood Estates, FL residents are foreign-born (13.8% born in North America, 3.6% born in Latin America), which is 16.5% less than the foreign-born rate of 21.0% across the entire state of Florida.
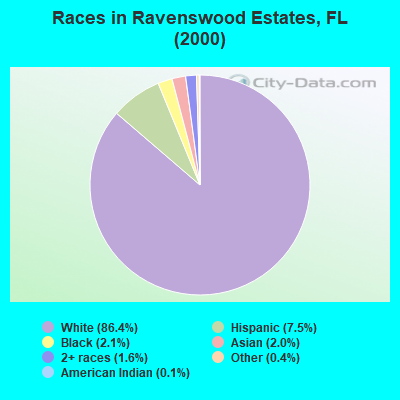
Race distribution in Ravenswood Estates

- 82986.4%White alone
- 727.5%Hispanic
- 202.1%Black alone
- 192.0%Asian alone
- 151.6%Two or more races
- 40.4%Other race alone
- 10.1%American Indian alone
2000
2022
-
- 10,458,50965.4%White alone
- 2,682,71516.8%Hispanic
- 2,264,26814.2%Black alone
- 261,6931.6%Asian alone
- 236,9541.5%Two or more races
- 42,3580.3%American Indian alone
- 28,9940.2%Other race alone
- 6,8870.04%Native Hawaiian and Other
Pacific Islander alone

-
- 11,309,40350.8%White alone
- 6,025,03927.1%Hispanic
- 3,241,01514.6%Black alone
- 861,6303.9%Two or more races
- 623,6922.8%Asian alone
- 152,0540.7%Other race alone
- 22,5040.1%American Indian alone
- 9,4860.04%Native Hawaiian and Other
Pacific Islander alone

Income and house value in Ravenswood Estates
- Median household income in 2022
- $72,252White non-Hispanic householders
- $67,746Black householders
- $198,039American Indian and Alaska Native householders
- $34,116Some other race householders
- $5,305Two or more races householders
- $37,706Hispanic or Latino race householders
- Median 2022 house value
- $332,209White Non-Hispanic householders
- $526,860Black or African American householders
- $249,061American Indian or Alaska Native householders
- $325,695Two or more races householders
Household income for White non-Hispanic householders

Household income for Black householders

Household income for American Indian and Alaska Native householders

Household income for Two or more races householders

Household income for Hispanic or Latino race householders

Foreign-born residents in Ravenswood Estates
173 residents are foreign born (13.8% North America, 3.6% Latin America).
| This city: | 18.0% |
| Florida: | 16.7% |
Ancestries in Ravenswood Estates

- 21519.7%Other
- 15914.5%Italian
- 14112.9%German
- 14112.9%Irish
- 989.0%French
- 918.3%English
- 878.0%United States
- 383.5%French Canadian
- 211.9%Portuguese
- 201.8%Polish
- 141.3%Greek
- 131.2%Scotch-Irish
- 121.1%Danish
- 111.0%Swedish
- 80.7%Czech
- 80.7%Hungarian
- 60.5%Dutch
- 60.5%Lithuanian
- 50.5%West Indian

Zip codes: 33312.