Races in Ralston, Nebraska (NE) Detailed Stats
Data:
Races - White alone (%)
Races - White alone (% change since 2000)
Races - Black alone (%)
Races - Black alone (% change since 2000)
Races - American Indian alone (%)
Races - American Indian alone (% change since 2000)
Races - Asian alone (%)
Races - Asian alone (% change since 2000)
Races - Hispanic (%)
Races - Hispanic (% change since 2000)
Races - Native Hawaiian and Other Pacific Islander alone (%)
Races - Native Hawaiian and Other Pacific Islander alone (% change since 2000)
Races - Two or more races(%)
Races - Two or more races(% change since 2000)
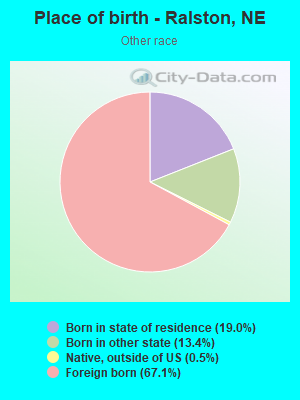
Races - Other race alone (%)
Races - Other race alone (% change since 2000)
Racial diversity
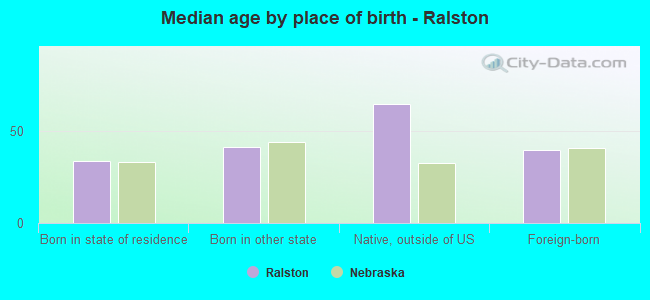
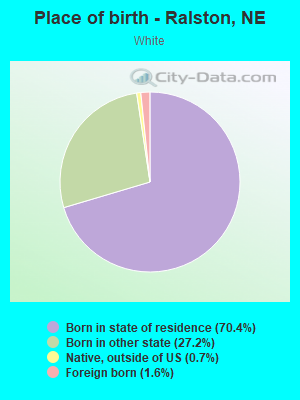
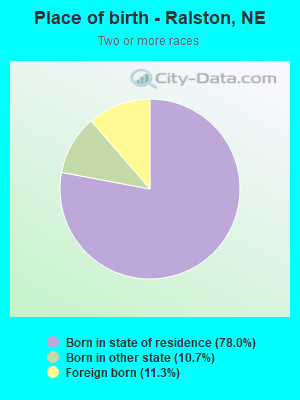
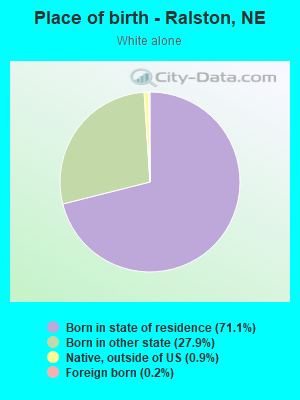
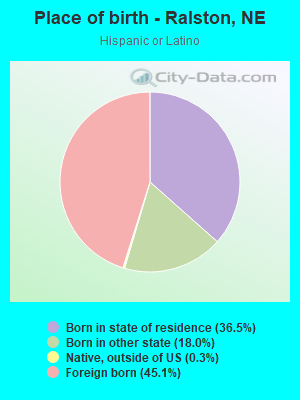
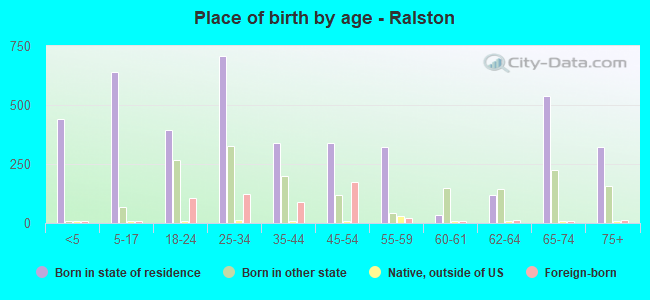
Place of birth - Born in state of residence (%)
Place of birth - Born in state of residence (%) - White
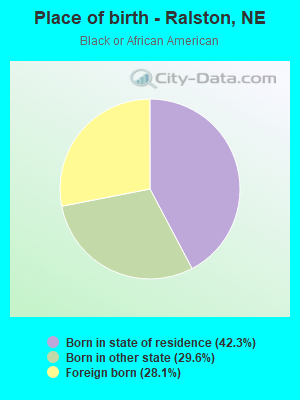
Place of birth - Born in state of residence (%) - Black or African American
Place of birth - Born in state of residence (%) - Asian
Place of birth - Born in state of residence (%) - Hispanic or Latino
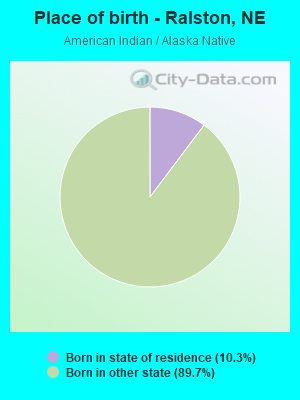
Place of birth - Born in state of residence (%) - American Indian and Alaska Native
Place of birth - Born in state of residence (%) - Multirace
Place of birth - Born in state of residence (%) - Other Race
Place of birth - Born in other state (%)
Place of birth - Born in other state (%) - White
Place of birth - Born in other state (%) - Black or African American
Place of birth - Born in other state (%) - Asian
Place of birth - Born in other state (%) - Hispanic or Latino
Place of birth - Born in other state (%) - American Indian and Alaska Native
Place of birth - Born in other state (%) - Multirace
Place of birth - Born in other state (%) - Other Race
Place of birth - Native, outside of US (%)
Place of birth - Native, outside of US (%) - White
Place of birth - Native, outside of US (%) - Black or African American
Place of birth - Native, outside of US (%) - Asian
Place of birth - Native, outside of US (%) - Hispanic or Latino
Place of birth - Native, outside of US (%) - American Indian and Alaska Native
Place of birth - Native, outside of US (%) - Multirace
Place of birth - Native, outside of US (%) - Other Race
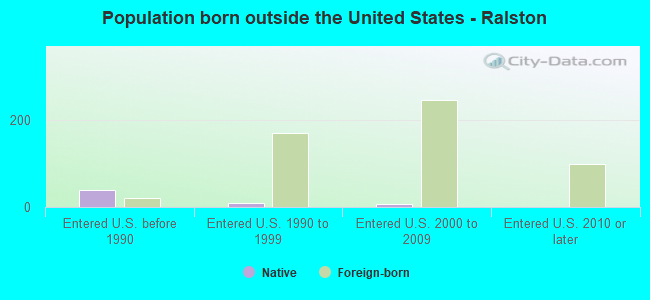
Place of birth - Foreign born (%)
Place of birth - Foreign born (%) - White
Place of birth - Foreign born (%) - Black or African American
Place of birth - Foreign born (%) - Asian
Place of birth - Foreign born (%) - Hispanic or Latino
Place of birth - Foreign born (%) - American Indian and Alaska Native
Place of birth - Foreign born (%) - Multirace
Place of birth - Foreign born (%) - Other Race
Residents speaking English at home (%)
Residents speaking English at home - Born in the United States (%)
Residents speaking English at home - Native, born elsewhere (%)
Residents speaking English at home - Foreign born (%)
Residents speaking Spanish at home (%)
Residents speaking Spanish at home - Born in the United States (%)
Residents speaking Spanish at home - Native, born elsewhere (%)
Residents speaking Spanish at home - Foreign born (%)
Residents speaking other language at home (%)
Residents speaking other language at home - Born in the United States (%)
Residents speaking other language at home - Native, born elsewhere (%)
Residents speaking other language at home - Foreign born (%)
Marital status - Never married (%)
Marital status - Now married (%)
Marital status - Separated (%)
Marital status - Widowed (%)
Marital status - Divorced (%)
Ancestries Reported - Arab (%)
Ancestries Reported - Czech (%)
Ancestries Reported - Danish (%)
Ancestries Reported - Dutch (%)
Ancestries Reported - English (%)
Ancestries Reported - French (%)
Ancestries Reported - French Canadian (%)
Ancestries Reported - German (%)
Ancestries Reported - Greek (%)
Ancestries Reported - Hungarian (%)
Ancestries Reported - Irish (%)
Ancestries Reported - Italian (%)
Ancestries Reported - Lithuanian (%)
Ancestries Reported - Norwegian (%)
Ancestries Reported - Polish (%)
Ancestries Reported - Portuguese (%)
Ancestries Reported - Russian (%)
Ancestries Reported - Scotch-Irish (%)
Ancestries Reported - Scottish (%)
Ancestries Reported - Slovak (%)
Ancestries Reported - Subsaharan African (%)
Ancestries Reported - Swedish (%)
Ancestries Reported - Swiss (%)
Ancestries Reported - Ukrainian (%)
Ancestries Reported - United States (%)
Ancestries Reported - Welsh (%)
Ancestries Reported - West Indian (%)
Ancestries Reported - Other (%)
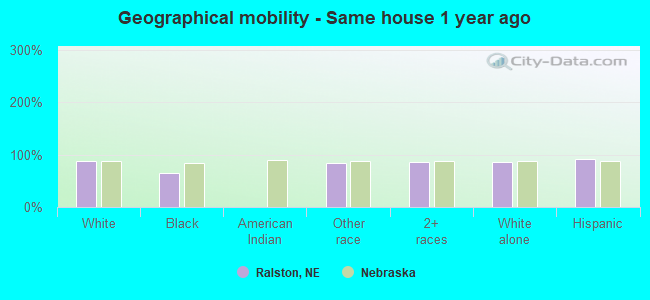
Geographical mobility - Same house 1 year ago (%)
Geographical mobility - Same house 1 year ago (%) - White
Geographical mobility - Same house 1 year ago (%) - Black or African American
Geographical mobility - Same house 1 year ago (%) - Asian
Geographical mobility - Same house 1 year ago (%) - Hispanic or Latino
Geographical mobility - Same house 1 year ago (%) - American Indian and Alaska Native
Geographical mobility - Same house 1 year ago (%) - Multirace
Geographical mobility - Same house 1 year ago (%) - Other Race
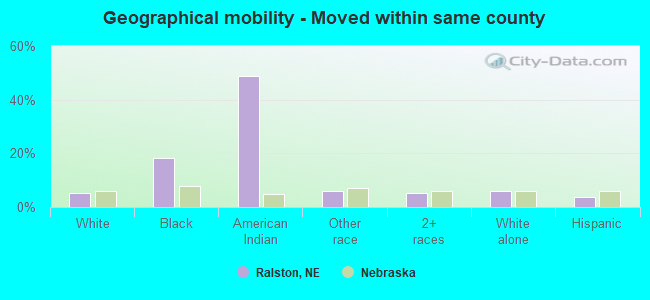
Geographical mobility - Moved within same county (%)
Geographical mobility - Moved within same county (%) - White
Geographical mobility - Moved within same county (%) - Black or African American
Geographical mobility - Moved within same county (%) - Asian
Geographical mobility - Moved within same county (%) - Hispanic or Latino
Geographical mobility - Moved within same county (%) - American Indian and Alaska Native
Geographical mobility - Moved within same county (%) - Multirace
Geographical mobility - Moved within same county (%) - Other Race
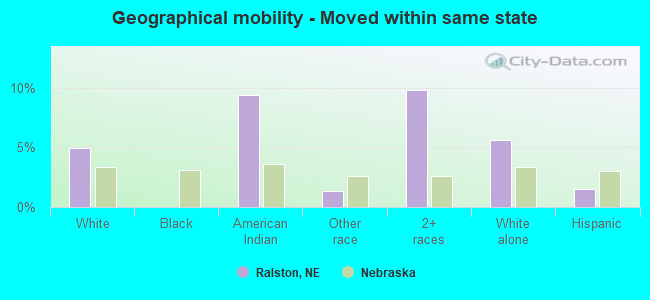
Geographical mobility - Moved from different county within same state (%)
Geographical mobility - Moved from different county within same state (%) - White
Geographical mobility - Moved from different county within same state (%) - Black or African American
Geographical mobility - Moved from different county within same state (%) - Asian
Geographical mobility - Moved from different county within same state (%) - Hispanic or Latino
Geographical mobility - Moved from different county within same state (%) - American Indian and Alaska Native
Geographical mobility - Moved from different county within same state (%) - Multirace
Geographical mobility - Moved from different county within same state (%) - Other Race
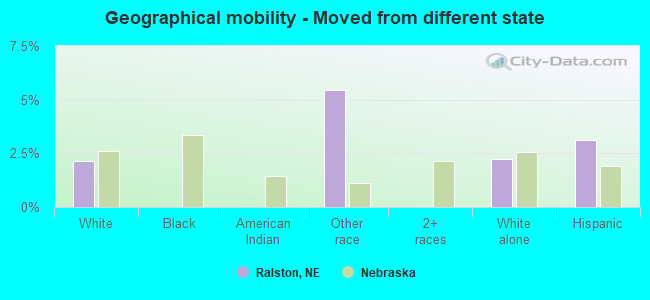
Geographical mobility - Moved from different state (%)
Geographical mobility - Moved from different state (%) - White
Geographical mobility - Moved from different state (%) - Black or African American
Geographical mobility - Moved from different state (%) - Asian
Geographical mobility - Moved from different state (%) - Hispanic or Latino
Geographical mobility - Moved from different state (%) - American Indian and Alaska Native
Geographical mobility - Moved from different state (%) - Multirace
Geographical mobility - Moved from different state (%) - Other Race
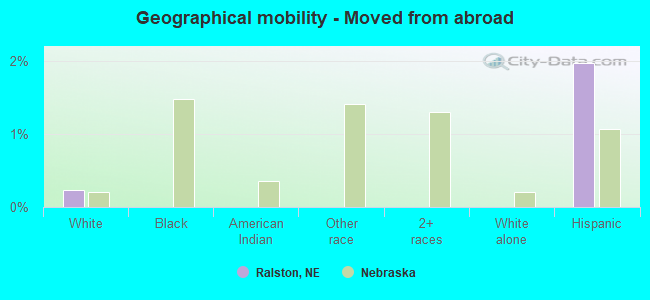
Geographical mobility - Moved from abroad (%)
Geographical mobility - Moved from abroad (%) - White
Geographical mobility - Moved from abroad (%) - Black or African American
Geographical mobility - Moved from abroad (%) - Asian
Geographical mobility - Moved from abroad (%) - Hispanic or Latino
Geographical mobility - Moved from abroad (%) - American Indian and Alaska Native
Geographical mobility - Moved from abroad (%) - Multirace
Geographical mobility - Moved from abroad (%) - Other Race
Place of birth for the foreign-born population - Ireland (%)
Place of birth for the foreign-born population - Denmark (%)
Place of birth for the foreign-born population - Norway (%)
Place of birth for the foreign-born population - Sweden (%)
Place of birth for the foreign-born population - United Kingdom (%)
Place of birth for the foreign-born population - England (%)
Place of birth for the foreign-born population - Scotland (%)
Place of birth for the foreign-born population - Other Northern Europe (%)
Place of birth for the foreign-born population - Austria (%)
Place of birth for the foreign-born population - Belgium (%)
Place of birth for the foreign-born population - France (%)
Place of birth for the foreign-born population - Germany (%)
Place of birth for the foreign-born population - Netherlands (%)
Place of birth for the foreign-born population - Switzerland (%)
Place of birth for the foreign-born population - Other Western Europe (%)
Place of birth for the foreign-born population - Greece (%)
Place of birth for the foreign-born population - Italy (%)
Place of birth for the foreign-born population - Portugal (%)
Place of birth for the foreign-born population - Spain (%)
Place of birth for the foreign-born population - Other Southern Europe (%)
Place of birth for the foreign-born population - Albania (%)
Place of birth for the foreign-born population - Belarus (%)
Place of birth for the foreign-born population - Bosnia and Herzegovina (%)
Place of birth for the foreign-born population - Bulgaria (%)
Place of birth for the foreign-born population - Croatia (%)
Place of birth for the foreign-born population - Czechoslovakia (%)
Place of birth for the foreign-born population - Hungary (%)
Place of birth for the foreign-born population - Latvia (%)
Place of birth for the foreign-born population - Lithuania (%)
Place of birth for the foreign-born population - North Macedonia (Macedonia) (%)
Place of birth for the foreign-born population - Moldova (%)
Place of birth for the foreign-born population - Poland (%)
Place of birth for the foreign-born population - Romania (%)
Place of birth for the foreign-born population - Russia (%)
Place of birth for the foreign-born population - Serbia (%)
Place of birth for the foreign-born population - Ukraine (%)
Place of birth for the foreign-born population - Other Eastern Europe (%)
Place of birth for the foreign-born population - China (%)
Place of birth for the foreign-born population - Hong Kong (%)
Place of birth for the foreign-born population - Taiwan (%)
Place of birth for the foreign-born population - Japan (%)
Place of birth for the foreign-born population - Korea (%)
Place of birth for the foreign-born population - Other Eastern Asia (%)
Place of birth for the foreign-born population - Afghanistan (%)
Place of birth for the foreign-born population - Bangladesh (%)
Place of birth for the foreign-born population - India (%)
Place of birth for the foreign-born population - Iran (%)
Place of birth for the foreign-born population - Kazakhstan (%)
Place of birth for the foreign-born population - Nepal (%)
Place of birth for the foreign-born population - Pakistan (%)
Place of birth for the foreign-born population - Sri Lanka (%)
Place of birth for the foreign-born population - Uzbekistan (%)
Place of birth for the foreign-born population - Other South Central Asia (%)
Place of birth for the foreign-born population - Burma (%)
Place of birth for the foreign-born population - Cambodia (%)
Place of birth for the foreign-born population - Indonesia (%)
Place of birth for the foreign-born population - Laos (%)
Place of birth for the foreign-born population - Malaysia (%)
Place of birth for the foreign-born population - Philippines (%)
Place of birth for the foreign-born population - Singapore (%)
Place of birth for the foreign-born population - Thailand (%)
Place of birth for the foreign-born population - Vietnam (%)
Place of birth for the foreign-born population - Other South Eastern Asia (%)
Place of birth for the foreign-born population - Armenia (%)
Place of birth for the foreign-born population - Iraq (%)
Place of birth for the foreign-born population - Israel (%)
Place of birth for the foreign-born population - Jordan (%)
Place of birth for the foreign-born population - Kuwait (%)
Place of birth for the foreign-born population - Lebanon (%)
Place of birth for the foreign-born population - Saudi Arabia (%)
Place of birth for the foreign-born population - Syria (%)
Place of birth for the foreign-born population - Turkey (%)
Place of birth for the foreign-born population - Yemen (%)
Place of birth for the foreign-born population - Other Western Asia (%)
Place of birth for the foreign-born population - Eritrea (%)
Place of birth for the foreign-born population - Ethiopia (%)
Place of birth for the foreign-born population - Kenya (%)
Place of birth for the foreign-born population - Somalia (%)
Place of birth for the foreign-born population - Uganda (%)
Place of birth for the foreign-born population - Zimbabwe (%)
Place of birth for the foreign-born population - Other Eastern Africa (%)
Place of birth for the foreign-born population - Cameroon (%)
Place of birth for the foreign-born population - Congo (%)
Place of birth for the foreign-born population - Democratic Republic of Congo (Zaire) (%)
Place of birth for the foreign-born population - Other Middle Africa (%)
Place of birth for the foreign-born population - Egypt (%)
Place of birth for the foreign-born population - Morocco (%)
Place of birth for the foreign-born population - Sudan (%)
Place of birth for the foreign-born population - Other Northern Africa (%)
Place of birth for the foreign-born population - South Africa (%)
Place of birth for the foreign-born population - Other Southern Africa (%)
Place of birth for the foreign-born population - Cabo Verde (%)
Place of birth for the foreign-born population - Ghana (%)
Place of birth for the foreign-born population - Liberia (%)
Place of birth for the foreign-born population - Nigeria (%)
Place of birth for the foreign-born population - Senegal (%)
Place of birth for the foreign-born population - Sierra Leone (%)
Place of birth for the foreign-born population - Other Western Africa (%)
Place of birth for the foreign-born population - Australia (%)
Place of birth for the foreign-born population - New Zealand (%)
Place of birth for the foreign-born population - Fiji (%)
Place of birth for the foreign-born population - Micronesia (%)
Place of birth for the foreign-born population - Bahamas (%)
Place of birth for the foreign-born population - Barbados (%)
Place of birth for the foreign-born population - Cuba (%)
Place of birth for the foreign-born population - Dominica (%)
Place of birth for the foreign-born population - Dominican Republic (%)
Place of birth for the foreign-born population - Grenada (%)
Place of birth for the foreign-born population - Haiti (%)
Place of birth for the foreign-born population - Jamaica (%)
Place of birth for the foreign-born population - St. Vincent and the Grenadines (%)
Place of birth for the foreign-born population - Trinidad and Tobago (%)
Place of birth for the foreign-born population - West Indies (%)
Place of birth for the foreign-born population - Other Caribbean (%)
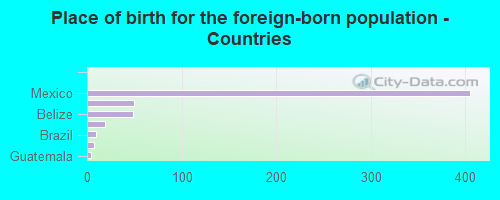
Place of birth for the foreign-born population - Belize (%)
Place of birth for the foreign-born population - Costa Rica (%)
Place of birth for the foreign-born population - El Salvador (%)
Place of birth for the foreign-born population - Guatemala (%)
Place of birth for the foreign-born population - Honduras (%)
Place of birth for the foreign-born population - Mexico (%)
Place of birth for the foreign-born population - Nicaragua (%)
Place of birth for the foreign-born population - Panama (%)
Place of birth for the foreign-born population - Other Central America (%)
Place of birth for the foreign-born population - Argentina (%)
Place of birth for the foreign-born population - Bolivia (%)
Place of birth for the foreign-born population - Brazil (%)
Place of birth for the foreign-born population - Chile (%)
Place of birth for the foreign-born population - Colombia (%)
Place of birth for the foreign-born population - Ecuador (%)
Place of birth for the foreign-born population - Guyana (%)
Place of birth for the foreign-born population - Peru (%)
Place of birth for the foreign-born population - Uruguay (%)
Place of birth for the foreign-born population - Venezuela (%)
Place of birth for the foreign-born population - Other South America (%)
Place of birth for the foreign-born population - Canada (%)
Place of birth for the foreign-born population - Other Northern America (%)
Place of birth for the foreign-born population - Other (%)
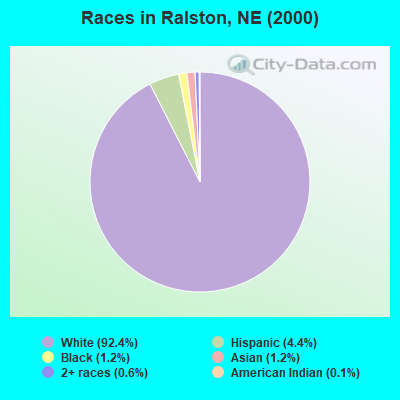
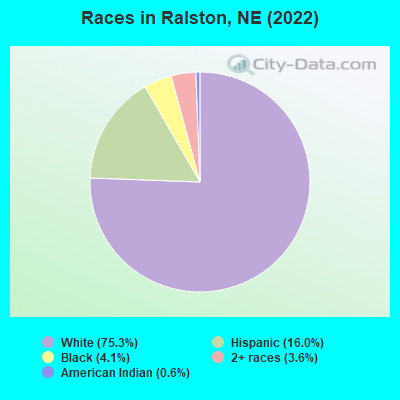
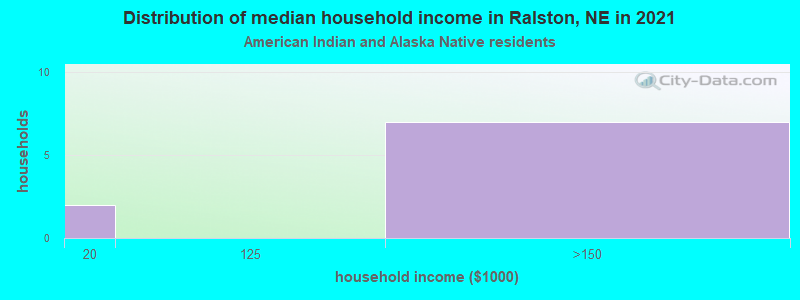
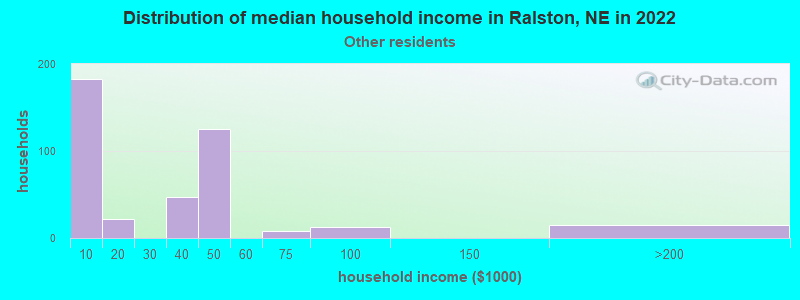
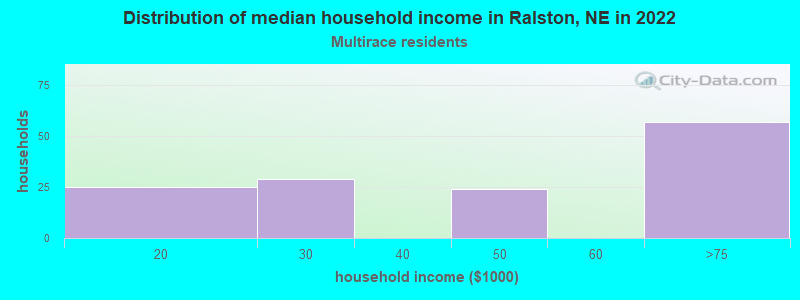
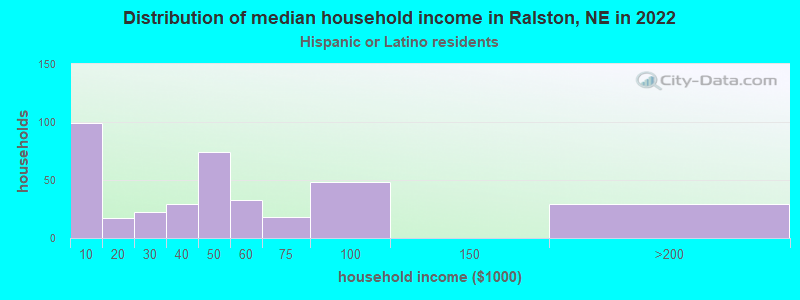
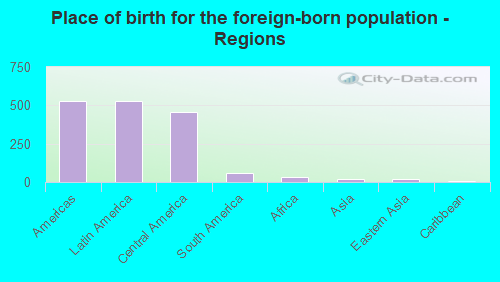
According to 2022 data, the most numerous races in Ralston, NE are White alone (4,897 residents), Hispanic (1,040 residents), and Black alone (268 residents). 86.7% of Ralston residents speak English at home. 8.9% of Ralston, NE residents are foreign-born (8.0% born in Latin America), which is 21.2% greater than the foreign-born rate of 7.0% across the entire state of Nebraska.
Race distribution in Ralston
2000 2022
1,494,494 87.3% White alone 94,425 5.5% Hispanic 67,537 3.9% Black alone 21,677 1.3% Asian alone 17,696 1.0% Two or more races 13,460 0.8% American Indian alone 1,327 0.08% Other race alone 647 0.04% Native Hawaiian and Other
1,492,005 75.8% White alone 241,898 12.3% Hispanic 89,520 4.5% Black alone 76,499 3.9% Two or more races 49,261 2.5% Asian alone 10,249 0.5% American Indian alone 7,425 0.4% Other race alone 1,066 0.05% Native Hawaiian and Other
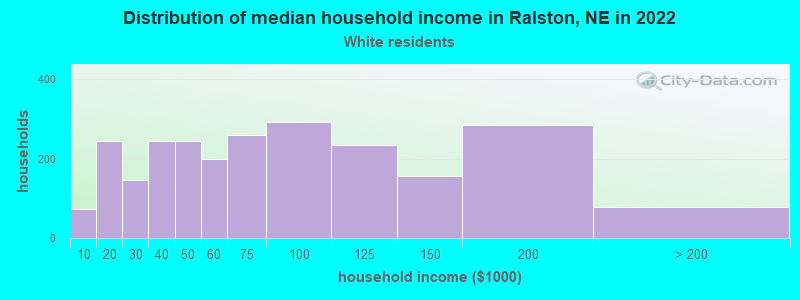
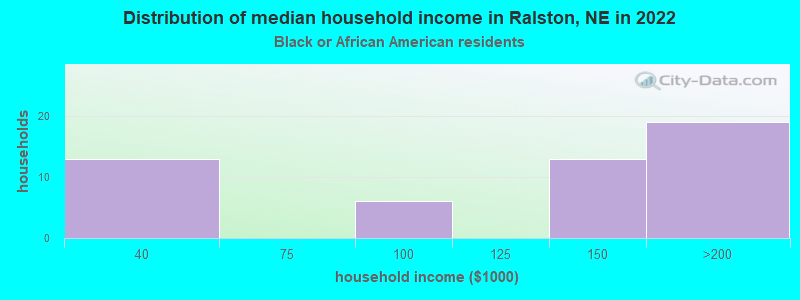
Income and house value in Ralston Median household income in 2022 $69,108 White non-Hispanic householders$130,143 Black householders$26,626 Some other race householders$49,722 Two or more races householders$42,447 Hispanic or Latino race householdersMedian 2022 house value $232,504 White Non-Hispanic householders$77,422 Some other race householders$273,955 Hispanic or Latino householders
Median age by race in Ralston
42.6 Median age for White residents43.8 41.5 23.2 Median age for Black or African American residents22.9 28.8 14.5 Median age for American Indian / Alaska Native residents14.6 6.7 -692,982,455.4 Median age for Asian residents-688,741,721.2 -701,639,343.6 -699,999,999.3 Median age for Native Hawaiian / Pacific Islander residents-672,108,842.9 -689,223,057.0 31.5 Median age for Other race residents40.1 25.1 11.1 Median age for Two or more races residents24.9 3.3 45.8 Median age for White alone residents46.2 44.5 25.0 Median age for Hispanic or Latino residents38.5 23.7
Owner/renter occupied households by race in Ralston
House owners and renters - White residents 1,536 62.2% Owner occupied934 37.8% Renter occupiedHouse owners and renters - Black or African American residents 45 85.3% Owner occupied8 14.7% Renter occupiedHouse owners and renters - American Indian / Alaska Native residents 12 100.0% Renter occupiedHouse owners and renters - Other race residents 10 2.5% Owner occupied398 97.5% Renter occupiedHouse owners and renters - Two or more races residents 59 36.6% Owner occupied102 63.4% Renter occupiedHouse owners and renters - White alone residents 1,552 63.2% Owner occupied905 36.8% Renter occupiedHouse owners and renters - Hispanic or Latino residents 34 7.9% Owner occupied393 92.1% Renter occupied
Language usage in Ralston
English speakers - Total 86.7% of residents of Ralston speak English at home.
11.6% of residents speak Spanish at home 321 45.7% Speak English very well382 54.3% Speak English less than very well1.7% of residents speak other language at home 103 100.0% Speak English very well
English speakers - Born in the United States 94.0% of residents of Ralston speak English at home.
5.6% of residents speak Spanish at home 76 80.0% Speak English very well19 20.0% Speak English less than very well
All residents speak only English at home
English speakers - Foreign-born 7.2% of residents of Ralston speak English at home.
79.7% of residents speak Spanish at home 88 19.8% Speak English very well357 80.2% Speak English less than very well15.1% of residents speak other language at home 84 100.0% Speak English very well
White (Caucasian) - Speak only English Native:
98.5% (4,657)Foreign-born:
8.6% (7)
White (Caucasian) - Speak another language Native:
1.9% (90)Foreign-born:
84.4% (70)
Other race - Speak only English Native:
24.8% (51)Foreign-born:
6.6% (31)
Other race - Speak another language Native:
76.1% (156)Foreign-born:
90.3% (430)
Two or more races - Speak another language Native:
5.5% (13)Foreign-born:
100.0% (45)
White alone - Speak only English Native:
98.9% (4,618)Foreign-born:
86.8% (8)
Hispanic or Latino - Speak only English Native:
53.2% (259)Foreign-born:
6.7% (31)
Hispanic or Latino - Speak another language Native:
46.9% (229)Foreign-born:
92.8% (432)
Foreign-born residents in Ralston 578 residents are foreign born (8.0% Latin America ).
This city:
8.9%Nebraska:
7.5%
Marital status for residents in Ralston Marital status - White (Caucasian) population 15 years and over
Males 31.8% Never married53.2% Now married0.7% Separated4.7% Widowed9.7% DivorcedFemales 34.1% Never married46.4% Now married0.0% Separated7.0% Widowed12.5% DivorcedWomen who gave birth in the past 12 months Now married:
65.1% (67)Unmarried:
34.9% (36)
Women who did not give birth in the past 12 months Now married:
35.0% (410)Unmarried:
65.0% (761)
Marital status - Black or African American population 15 years and over
Males 75.0% Never married18.1% Now married6.9% Separated0.0% Widowed0.0% DivorcedFemales 0.0% Never married100.0% Now married0.0% Separated0.0% Widowed0.0% DivorcedWomen who gave birth in the past 12 months Now married:
100.0% (31)Unmarried:
0.0% (0)
Marital status - American Indian / Alaska Native population 15 years and over
Males 0.0% Never married100.0% Now married0.0% Separated0.0% Widowed0.0% DivorcedFemales 22.2% Never married77.8% Now married0.0% Separated0.0% Widowed0.0% DivorcedWomen who did not give birth in the past 12 months Now married:
77.8% (8)Unmarried:
22.2% (2)
Marital status - Other race population 15 years and over
Males 32.9% Never married67.1% Now married0.0% Separated0.0% Widowed0.0% DivorcedFemales 49.7% Never married49.7% Now married0.0% Separated0.0% Widowed0.6% DivorcedWomen who gave birth in the past 12 months Now married:
100.0% (12)Unmarried:
0.0% (0)
Women who did not give birth in the past 12 months Now married:
47.6% (105)Unmarried:
52.4% (116)
Marital status - Two or more races population 15 years and over
Males 65.5% Never married14.9% Now married0.0% Separated0.0% Widowed19.5% DivorcedFemales 65.1% Never married7.0% Now married0.0% Separated0.0% Widowed27.9% DivorcedWomen who did not give birth in the past 12 months Now married:
9.7% (4)Unmarried:
90.3% (41)
Marital status - White alone, not Hispanic / Latino population 15 years and over
Males 32.8% Never married52.1% Now married0.7% Separated4.9% Widowed9.4% DivorcedFemales 33.7% Never married46.3% Now married0.0% Separated6.9% Widowed13.2% DivorcedWomen who gave birth in the past 12 months Now married:
65.1% (70)Unmarried:
34.9% (38)
Women who did not give birth in the past 12 months Now married:
33.1% (367)Unmarried:
66.9% (743)
Marital status - Hispanic or Latino population 15 years and over
Males 24.7% Never married66.9% Now married0.0% Separated0.0% Widowed8.3% DivorcedFemales 45.9% Never married46.7% Now married0.0% Separated3.6% Widowed3.8% DivorcedWomen who gave birth in the past 12 months Now married:
100.0% (10)Unmarried:
0.0% (0)
Women who did not give birth in the past 12 months Now married:
49.2% (160)Unmarried:
50.8% (165)
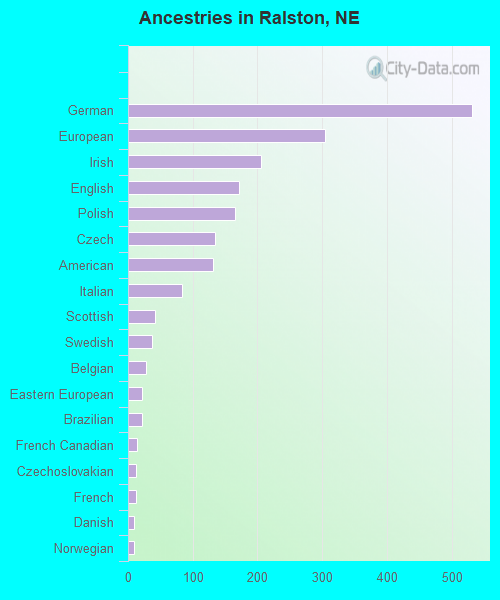
Ancestries in Ralston
531 17.4% German304 9.9% European206 6.7% Irish171 5.6% English165 5.4% Polish135 4.4% Czech131 4.3% American84 2.7% Italian42 1.4% Scottish37 1.2% Swedish28 0.9% Belgian22 0.7% Eastern European21 0.7% Brazilian14 0.5% French Canadian12 0.4% Czechoslovakian12 0.4% French10 0.3% Danish9 0.3% Norwegian
Children Nativity (place of birth) in Ralston
Children under 6 years - Living with two parents Both parents native 236 100.0% NativeBoth parents foreign-born 84 100.0% NativeChildren under 6 years - Living with one parent Native parent 112 100.0% NativeForeign-born parent 25 100.0% NativeChildren 6 to 17 years - Living with two parents Both parents native 312 100.0% NativeBoth parents foreign-born 91 100.0% NativeOne native, one foreign-born parent 12 100.0% NativeChildren 6 to 17 years - Living with one parent Native parent 194 93.2% Native14 6.8% Foreign-bornForeign-born parent 9 100.0% Native
Grandparents responsible for own grandchildren in Ralston
Grandparents (30 to 59 years) White / Caucasian 55 52.9% Responsible for grandchildren49 47.1% Not responsible for grandchildrenWhite alone, not Hispanic / Latino 58 96.9% Responsible for grandchildren2 3.1% Not responsible for grandchildrenHispanic or Latino 52 100.0% Not responsible for grandchildrenGrandparents (60 years and over) White / Caucasian 10 29.5% Responsible for grandchildren24 70.5% Not responsible for grandchildrenWhite alone, not Hispanic / Latino 9 25.2% Responsible for grandchildren27 74.8% Not responsible for grandchildrenHispanic or Latino 2 100.0% Not responsible for grandchildren