Races in Queenland, Maryland (MD) Detailed Stats
Ancestries, Foreign-born residents, place of birth
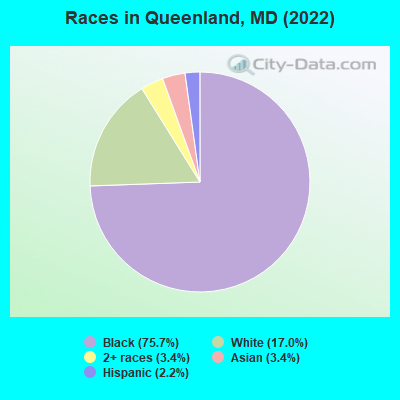
According to 2022 data, the most numerous races in Queenland, MD are White alone (349 residents), Black alone (1,558 residents), and Hispanic (45 residents). 91.0% of Queenland residents speak English at home.
Race distribution in Queenland

- 1,55875.7%Black alone
- 34917.0%White alone
- 703.4%Asian alone
- 713.4%Two or more races
- 452.2%Hispanic
2000
2022
-
- 3,286,54762.1%White alone
- 1,464,73527.7%Black alone
- 227,9164.3%Hispanic
- 209,7384.0%Asian alone
- 82,9461.6%Two or more races
- 13,3120.3%American Indian alone
- 9,3790.2%Other race alone
- 1,9130.04%Native Hawaiian and Other
Pacific Islander alone

-
- 2,906,49247.1%White alone
- 1,800,91429.2%Black alone
- 705,84211.4%Hispanic
- 401,8186.5%Asian alone
- 291,3174.7%Two or more races
- 46,9300.8%Other race alone
- 8,9300.1%American Indian alone
- 2,4170.04%Native Hawaiian and Other
Pacific Islander alone

Income and house value in Queenland
- Median household income in 2022
- over $200,000White non-Hispanic householders
- $177,608Black householders
- $174,609Two or more races householders
- Median 2022 house value
Household income for White non-Hispanic householders

Household income for Black householders

Household income for Two or more races householders

Median age by race in Queenland
- 56.3Median age for White residents
- 57.0Males
- 55.8Females
- 45.8Median age for Black or African American residents
- 45.8Males
- 48.8Females
- 56.7Median age for Asian residents
- 55.5Median age for Two or more races residents
- 55.3Median age for White alone residents
- 54.4Males
- 57.0Females
- 55.8Median age for Hispanic or Latino residents
Owner/renter occupied households by race in Queenland
- House owners and renters - White residents
- 176100.0%Owner occupied
- House owners and renters - Black or African American residents
- 35779.7%Owner occupied
- 9120.3%Renter occupied
- House owners and renters - Asian residents
- 27100.0%Owner occupied
- House owners and renters - Two or more races residents
- 2235.5%Owner occupied
- 4064.5%Renter occupied
- House owners and renters - White alone residents
- 169100.0%Owner occupied
- House owners and renters - Hispanic or Latino residents
- 17100.0%Owner occupied
Language usage in Queenland
- English speakers - Total
- 91.0% of residents of Queenland speak English at home.
- 3.0% of residents speak Spanish at home
- 1829.5%Speak English very well
- 4370.5%Speak English less than very well
- 3.0% of residents speak other language at home
- 2032.8%Speak English very well
- 4167.2%Speak English less than very well
- English speakers - Born in the United States
- 96.6% of residents of Queenland speak English at home.
- 1.3% of residents speak Spanish at home
- 16100.0%Speak English very well
- 1.3% of residents speak other language at home
- 16100.0%Speak English very well
All residents speak only English at home
- English speakers - Foreign-born
- 5.6% of residents of Queenland speak English at home.
- 47.8% of residents speak Spanish at home
- 43100.0%Speak English less than very well
- 46.7% of residents speak other language at home
- 42100.0%Speak English less than very well
Black or African American - Speak only English
| Native: | 99.2% (1,453) |
| Foreign-born: | 95.6% (6) |
Asian - Speak another language
| Native: | 81.8% (22) |
| Foreign-born: | 100.0% (46) |
Foreign-born residents in Queenland


Marital status for residents in Queenland
Marital status - White (Caucasian) population 15 years and over
- Males
- 0.0%Never married
- 92.7%Now married
- 0.0%Separated
- 7.3%Widowed
- 0.0%Divorced
- Females
- 10.5%Never married
- 78.9%Now married
- 0.0%Separated
- 10.5%Widowed
- 0.0%Divorced
Women who did not give birth in the past 12 months
| Now married: | 76.0% (32) |
| Unmarried: | 24.0% (10) |
Marital status - Black or African American population 15 years and over
- Males
- 34.8%Never married
- 54.6%Now married
- 2.1%Separated
- 1.6%Widowed
- 6.9%Divorced
- Females
- 37.3%Never married
- 53.7%Now married
- 0.0%Separated
- 5.2%Widowed
- 3.9%Divorced
Women who did not give birth in the past 12 months
| Now married: | 49.1% (193) |
| Unmarried: | 50.9% (200) |
Marital status - Asian population 15 years and over
- Males
- 47.2%Never married
- 52.8%Now married
- 0.0%Separated
- 0.0%Widowed
- 0.0%Divorced
- Females
- 0.0%Never married
- 100.0%Now married
- 0.0%Separated
- 0.0%Widowed
- 0.0%Divorced
Marital status - White alone, not Hispanic / Latino population 15 years and over
- Males
- 0.0%Never married
- 92.1%Now married
- 0.0%Separated
- 7.9%Widowed
- 0.0%Divorced
- Females
- 11.1%Never married
- 77.8%Now married
- 0.0%Separated
- 11.1%Widowed
- 0.0%Divorced
Women who did not give birth in the past 12 months
| Now married: | 76.0% (32) |
| Unmarried: | 24.0% (10) |
Marital status - Hispanic or Latino population 15 years and over
- Males
- 0.0%Never married
- 100.0%Now married
- 0.0%Separated
- 0.0%Widowed
- 0.0%Divorced
- Females
- 0.0%Never married
- 100.0%Now married
- 0.0%Separated
- 0.0%Widowed
- 0.0%Divorced
Ancestries in Queenland

- 21015.3%African
- 402.9%European
- 261.9%English
- 231.7%Irish
- 161.2%German
- 120.9%Guyanese
- 100.7%Italian
- 100.7%Polish
- 70.5%Scotch-Irish
- 40.3%Scottish

Geographical mobility in Queenland

- Same house 1 year ago
- 368100.0%White (Caucasian)
- 1,53399.0%Black or African American
- 75100.0%Asian
- 88100.0%Two or more races
- 348100.0%White alone, not Hispanic / Latino
- 49100.0%Hispanic or Latino

-
- Moved within same county
- 352.2%Black or African American

-
- Moved from different state
- 221.4%Black or African American

Children Nativity (place of birth) in Queenland
Place of birth for residents in Queenland
![Place of birth for the foreign-born population - Regions]()
- 37Asia
- 37South Eastern Asia
- 37Americas
- 37Latin America
- 32Caribbean
- 5South America
