Races in Putnam Valley, New York (NY) Detailed Stats
Ancestries, Foreign-born residents, place of birth

Recent posts about races in Putnam Valley, New York on our local forum with over 2,400,000 registered users:

8.9% of Putnam Valley, NY residents are foreign-born (5.6% born in Europe, 2.3% born in Latin America), which is 147.5% less than the foreign-born rate of 22.0% across the entire state of New York.
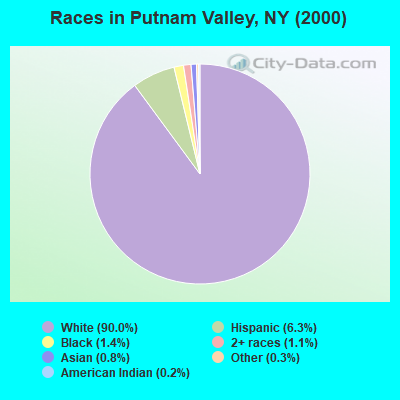
Race distribution in Putnam Valley

- 9,61390.0%White alone
- 6716.3%Hispanic
- 1491.4%Black alone
- 1201.1%Two or more races
- 840.8%Asian alone
- 320.3%Other race alone
- 170.2%American Indian alone
2000
2022
-
- 11,760,98162.0%White alone
- 2,867,58315.1%Hispanic
- 2,812,62314.8%Black alone
- 1,035,9265.5%Asian alone
- 366,1161.9%Two or more races
- 75,4990.4%Other race alone
- 52,4990.3%American Indian alone
- 5,2300.03%Native Hawaiian and Other
Pacific Islander alone

-
- 10,408,93352.9%White alone
- 3,867,29919.7%Hispanic
- 2,633,84013.4%Black alone
- 1,776,2869.0%Asian alone
- 732,6703.7%Two or more races
- 216,1101.1%Other race alone
- 35,0820.2%American Indian alone
- 6,9310.04%Native Hawaiian and Other
Pacific Islander alone

Income and house value in Putnam Valley
- Median household income in 2022
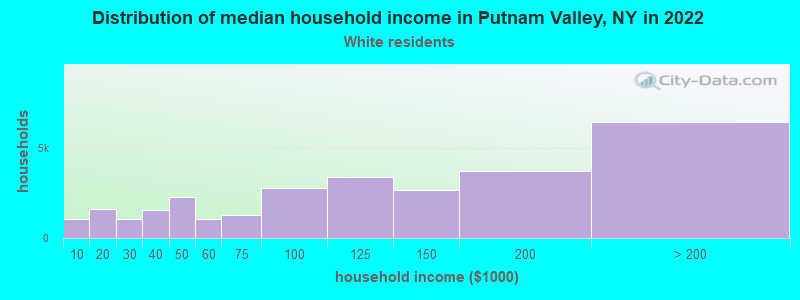
- $110,874White non-Hispanic householders
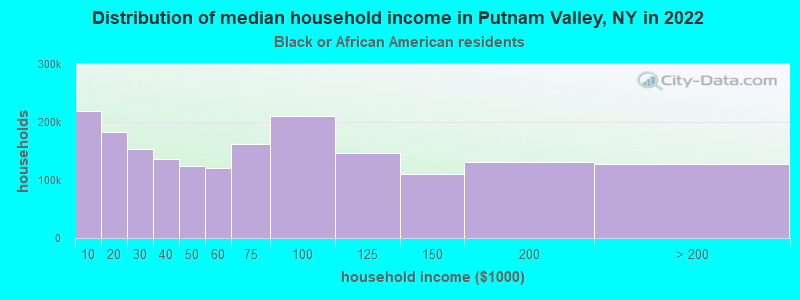
- $136,019Black householders
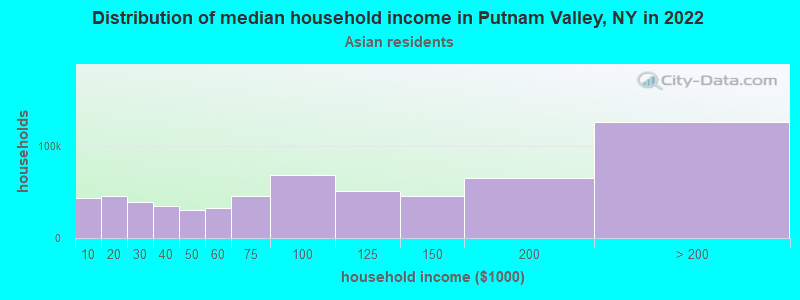
- $118,715Asian householders
- $106,953Some other race householders
- $81,277Two or more races householders
- $124,453Hispanic or Latino race householders
- Median 2022 house value
- $426,091White Non-Hispanic householders
- $380,848Black or African American householders
- $398,266Asian householders
- $381,698Some other race householders
- $415,259Two or more races householders
- $365,980Hispanic or Latino householders
Household income for White non-Hispanic householders
Household income for Black householders
Household income for Asian householders
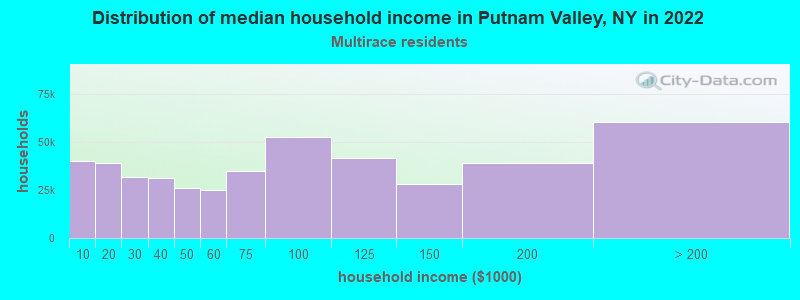
Household income for Two or more races householders
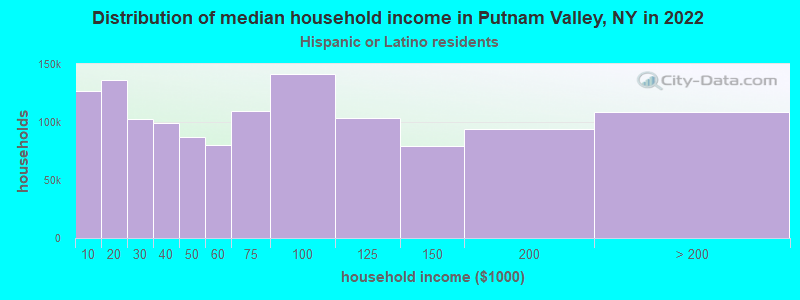
Household income for Hispanic or Latino race householders
Foreign-born residents in Putnam Valley
950 residents are foreign born (5.6% Europe, 2.3% Latin America).
| This city: | 8.9% |
| New York: | 20.4% |
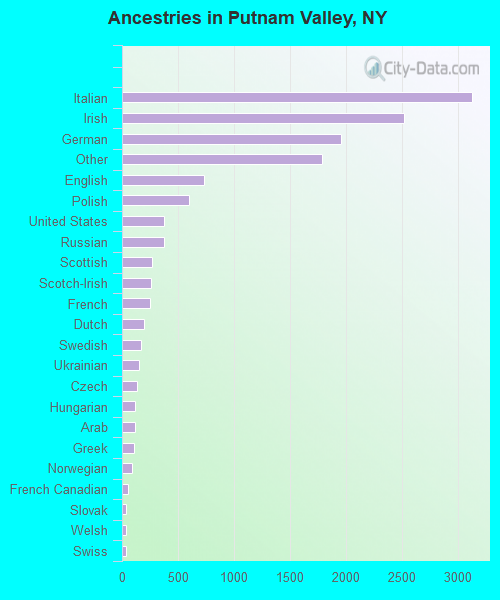
Ancestries in Putnam Valley

- 3,12223.0%Italian
- 2,51718.6%Irish
- 1,95214.4%German
- 1,78413.2%Other
- 7285.4%English
- 5954.4%Polish
- 3792.8%United States
- 3772.8%Russian
- 2702.0%Scottish
- 2611.9%Scotch-Irish
- 2491.8%French
- 1941.4%Dutch
- 1711.3%Swedish
- 1551.1%Ukrainian
- 1311.0%Czech
- 1170.9%Hungarian
- 1140.8%Arab
- 1040.8%Greek
- 930.7%Norwegian
- 500.4%French Canadian
- 400.3%Slovak
- 360.3%Welsh
- 350.3%Swiss
- 270.2%Lithuanian
- 220.2%Subsaharan African
- 100.07%Danish
- 100.07%Portuguese
- 70.05%West Indian
Zip codes: 10579.