Races in Pumphrey, Maryland (MD) Detailed Stats
Ancestries, Foreign-born residents, place of birth

Discuss Pumphrey, Maryland races on our local forum with over 2,400,000 registered users
3.9% of Pumphrey, MD residents are foreign-born (2.3% born in Asia, 1.1% born in Europe, 0.6% born in Latin America), which is 309.0% less than the foreign-born rate of 16.0% across the entire state of Maryland.
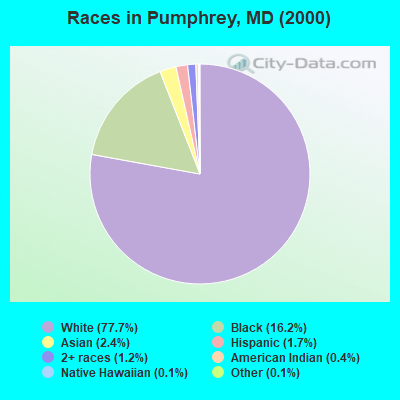
Race distribution in Pumphrey

- 4,13377.7%White alone
- 86416.2%Black alone
- 1282.4%Asian alone
- 931.7%Hispanic
- 651.2%Two or more races
- 220.4%American Indian alone
- 60.1%Other race alone
- 60.1%Native Hawaiian and Other
Pacific Islander alone
2000
2022
-
- 3,286,54762.1%White alone
- 1,464,73527.7%Black alone
- 227,9164.3%Hispanic
- 209,7384.0%Asian alone
- 82,9461.6%Two or more races
- 13,3120.3%American Indian alone
- 9,3790.2%Other race alone
- 1,9130.04%Native Hawaiian and Other
Pacific Islander alone

-
- 2,906,49247.1%White alone
- 1,800,91429.2%Black alone
- 705,84211.4%Hispanic
- 401,8186.5%Asian alone
- 291,3174.7%Two or more races
- 46,9300.8%Other race alone
- 8,9300.1%American Indian alone
- 2,4170.04%Native Hawaiian and Other
Pacific Islander alone

Income and house value in Pumphrey
- Median household income in 2022
- $85,770White non-Hispanic householders
- $96,834Black householders
- $80,620Asian householders
- $77,039Some other race householders
- $48,449Two or more races householders
- $68,889Hispanic or Latino race householders
- Median 2022 house value
- $377,538White Non-Hispanic householders
- $231,974Black or African American householders
- $359,560Asian householders
- $398,706Some other race householders
- $367,679Two or more races householders
- $416,974Hispanic or Latino householders
Household income for White non-Hispanic householders

Household income for Black householders

Household income for Asian householders

Household income for Native Hawaiian and other Pacific Islander householders

Household income for Two or more races householders

Household income for Hispanic or Latino race householders

Foreign-born residents in Pumphrey
208 residents are foreign born (2.3% Asia, 1.1% Europe, 0.6% Latin America).
| This city: | 3.9% |
| Maryland: | 9.8% |
Ancestries in Pumphrey

- 1,18822.8%Other
- 1,11621.4%German
- 68813.2%Irish
- 53810.3%United States
- 3677.0%English
- 3506.7%Polish
- 1963.8%Italian
- 961.8%Dutch
- 881.7%Lithuanian
- 871.7%Scottish
- 791.5%French
- 791.5%Scotch-Irish
- 771.5%Welsh
- 661.3%Hungarian
- 601.2%Czech
- 310.6%Swiss
- 230.4%Greek
- 230.4%Norwegian
- 200.4%Ukrainian
- 200.4%West Indian
- 160.3%Russian
- 50.10%Swedish

Zip codes: 21225.