Races in Princeton, Texas (TX) Detailed Stats
Data:
Races - White alone (%)
Races - White alone (% change since 2000)
Races - Black alone (%)
Races - Black alone (% change since 2000)
Races - American Indian alone (%)
Races - American Indian alone (% change since 2000)
Races - Asian alone (%)
Races - Asian alone (% change since 2000)
Races - Hispanic (%)
Races - Hispanic (% change since 2000)
Races - Native Hawaiian and Other Pacific Islander alone (%)
Races - Native Hawaiian and Other Pacific Islander alone (% change since 2000)
Races - Two or more races(%)
Races - Two or more races(% change since 2000)
Races - Other race alone (%)
Races - Other race alone (% change since 2000)
Racial diversity
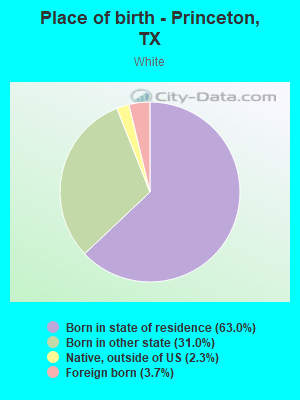
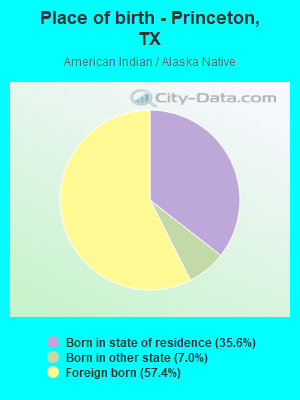
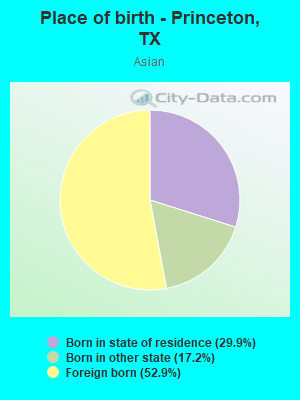
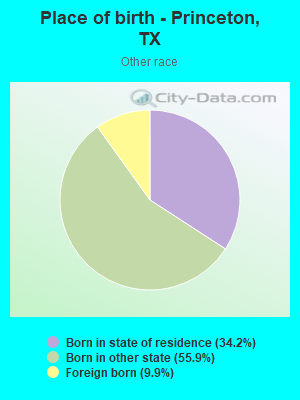
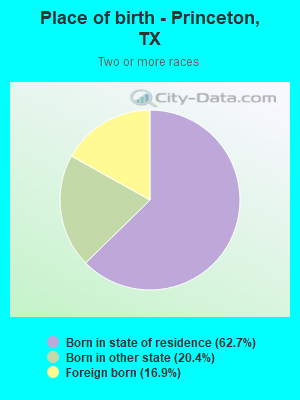
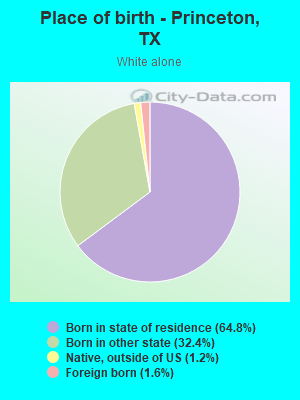
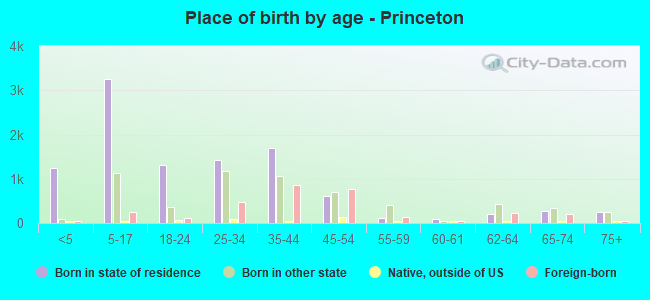
Place of birth - Born in state of residence (%)
Place of birth - Born in state of residence (%) - White
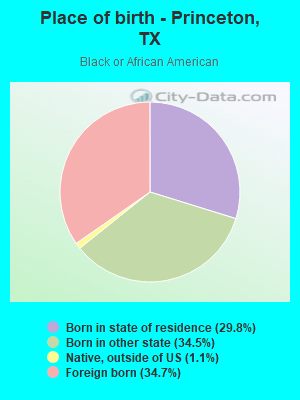
Place of birth - Born in state of residence (%) - Black or African American
Place of birth - Born in state of residence (%) - Asian
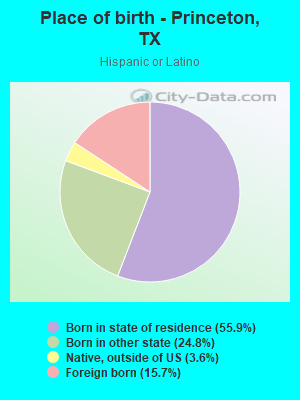
Place of birth - Born in state of residence (%) - Hispanic or Latino
Place of birth - Born in state of residence (%) - American Indian and Alaska Native
Place of birth - Born in state of residence (%) - Multirace
Place of birth - Born in state of residence (%) - Other Race
Place of birth - Born in other state (%)
Place of birth - Born in other state (%) - White
Place of birth - Born in other state (%) - Black or African American
Place of birth - Born in other state (%) - Asian
Place of birth - Born in other state (%) - Hispanic or Latino
Place of birth - Born in other state (%) - American Indian and Alaska Native
Place of birth - Born in other state (%) - Multirace
Place of birth - Born in other state (%) - Other Race
Place of birth - Native, outside of US (%)
Place of birth - Native, outside of US (%) - White
Place of birth - Native, outside of US (%) - Black or African American
Place of birth - Native, outside of US (%) - Asian
Place of birth - Native, outside of US (%) - Hispanic or Latino
Place of birth - Native, outside of US (%) - American Indian and Alaska Native
Place of birth - Native, outside of US (%) - Multirace
Place of birth - Native, outside of US (%) - Other Race
Place of birth - Foreign born (%)
Place of birth - Foreign born (%) - White
Place of birth - Foreign born (%) - Black or African American
Place of birth - Foreign born (%) - Asian
Place of birth - Foreign born (%) - Hispanic or Latino
Place of birth - Foreign born (%) - American Indian and Alaska Native
Place of birth - Foreign born (%) - Multirace
Place of birth - Foreign born (%) - Other Race
Residents speaking English at home (%)
Residents speaking English at home - Born in the United States (%)
Residents speaking English at home - Native, born elsewhere (%)
Residents speaking English at home - Foreign born (%)
Residents speaking Spanish at home (%)
Residents speaking Spanish at home - Born in the United States (%)
Residents speaking Spanish at home - Native, born elsewhere (%)
Residents speaking Spanish at home - Foreign born (%)
Residents speaking other language at home (%)
Residents speaking other language at home - Born in the United States (%)
Residents speaking other language at home - Native, born elsewhere (%)
Residents speaking other language at home - Foreign born (%)
Marital status - Never married (%)
Marital status - Now married (%)
Marital status - Separated (%)
Marital status - Widowed (%)
Marital status - Divorced (%)
Ancestries Reported - Arab (%)
Ancestries Reported - Czech (%)
Ancestries Reported - Danish (%)
Ancestries Reported - Dutch (%)
Ancestries Reported - English (%)
Ancestries Reported - French (%)
Ancestries Reported - French Canadian (%)
Ancestries Reported - German (%)
Ancestries Reported - Greek (%)
Ancestries Reported - Hungarian (%)
Ancestries Reported - Irish (%)
Ancestries Reported - Italian (%)
Ancestries Reported - Lithuanian (%)
Ancestries Reported - Norwegian (%)
Ancestries Reported - Polish (%)
Ancestries Reported - Portuguese (%)
Ancestries Reported - Russian (%)
Ancestries Reported - Scotch-Irish (%)
Ancestries Reported - Scottish (%)
Ancestries Reported - Slovak (%)
Ancestries Reported - Subsaharan African (%)
Ancestries Reported - Swedish (%)
Ancestries Reported - Swiss (%)
Ancestries Reported - Ukrainian (%)
Ancestries Reported - United States (%)
Ancestries Reported - Welsh (%)
Ancestries Reported - West Indian (%)
Ancestries Reported - Other (%)
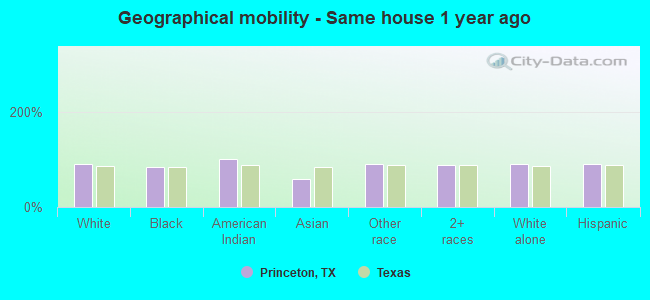
Geographical mobility - Same house 1 year ago (%)
Geographical mobility - Same house 1 year ago (%) - White
Geographical mobility - Same house 1 year ago (%) - Black or African American
Geographical mobility - Same house 1 year ago (%) - Asian
Geographical mobility - Same house 1 year ago (%) - Hispanic or Latino
Geographical mobility - Same house 1 year ago (%) - American Indian and Alaska Native
Geographical mobility - Same house 1 year ago (%) - Multirace
Geographical mobility - Same house 1 year ago (%) - Other Race
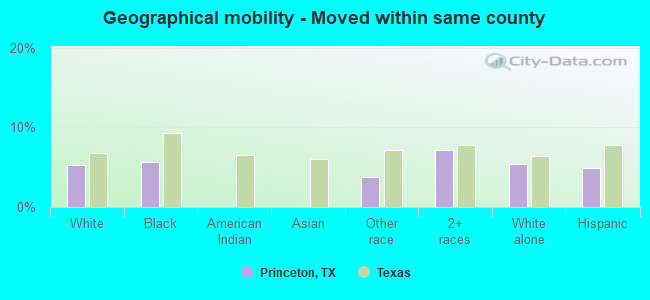
Geographical mobility - Moved within same county (%)
Geographical mobility - Moved within same county (%) - White
Geographical mobility - Moved within same county (%) - Black or African American
Geographical mobility - Moved within same county (%) - Asian
Geographical mobility - Moved within same county (%) - Hispanic or Latino
Geographical mobility - Moved within same county (%) - American Indian and Alaska Native
Geographical mobility - Moved within same county (%) - Multirace
Geographical mobility - Moved within same county (%) - Other Race
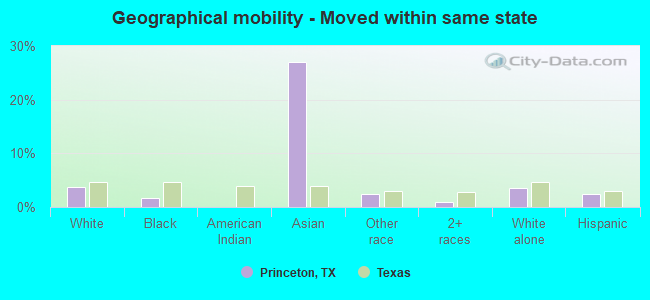
Geographical mobility - Moved from different county within same state (%)
Geographical mobility - Moved from different county within same state (%) - White
Geographical mobility - Moved from different county within same state (%) - Black or African American
Geographical mobility - Moved from different county within same state (%) - Asian
Geographical mobility - Moved from different county within same state (%) - Hispanic or Latino
Geographical mobility - Moved from different county within same state (%) - American Indian and Alaska Native
Geographical mobility - Moved from different county within same state (%) - Multirace
Geographical mobility - Moved from different county within same state (%) - Other Race
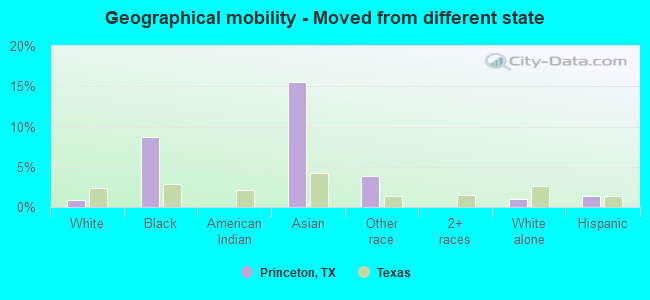
Geographical mobility - Moved from different state (%)
Geographical mobility - Moved from different state (%) - White
Geographical mobility - Moved from different state (%) - Black or African American
Geographical mobility - Moved from different state (%) - Asian
Geographical mobility - Moved from different state (%) - Hispanic or Latino
Geographical mobility - Moved from different state (%) - American Indian and Alaska Native
Geographical mobility - Moved from different state (%) - Multirace
Geographical mobility - Moved from different state (%) - Other Race
Geographical mobility - Moved from abroad (%)
Geographical mobility - Moved from abroad (%) - White
Geographical mobility - Moved from abroad (%) - Black or African American
Geographical mobility - Moved from abroad (%) - Asian
Geographical mobility - Moved from abroad (%) - Hispanic or Latino
Geographical mobility - Moved from abroad (%) - American Indian and Alaska Native
Geographical mobility - Moved from abroad (%) - Multirace
Geographical mobility - Moved from abroad (%) - Other Race
Place of birth for the foreign-born population - Ireland (%)
Place of birth for the foreign-born population - Denmark (%)
Place of birth for the foreign-born population - Norway (%)
Place of birth for the foreign-born population - Sweden (%)
Place of birth for the foreign-born population - United Kingdom (%)
Place of birth for the foreign-born population - England (%)
Place of birth for the foreign-born population - Scotland (%)
Place of birth for the foreign-born population - Other Northern Europe (%)
Place of birth for the foreign-born population - Austria (%)
Place of birth for the foreign-born population - Belgium (%)
Place of birth for the foreign-born population - France (%)
Place of birth for the foreign-born population - Germany (%)
Place of birth for the foreign-born population - Netherlands (%)
Place of birth for the foreign-born population - Switzerland (%)
Place of birth for the foreign-born population - Other Western Europe (%)
Place of birth for the foreign-born population - Greece (%)
Place of birth for the foreign-born population - Italy (%)
Place of birth for the foreign-born population - Portugal (%)
Place of birth for the foreign-born population - Spain (%)
Place of birth for the foreign-born population - Other Southern Europe (%)
Place of birth for the foreign-born population - Albania (%)
Place of birth for the foreign-born population - Belarus (%)
Place of birth for the foreign-born population - Bosnia and Herzegovina (%)
Place of birth for the foreign-born population - Bulgaria (%)
Place of birth for the foreign-born population - Croatia (%)
Place of birth for the foreign-born population - Czechoslovakia (%)
Place of birth for the foreign-born population - Hungary (%)
Place of birth for the foreign-born population - Latvia (%)
Place of birth for the foreign-born population - Lithuania (%)
Place of birth for the foreign-born population - North Macedonia (Macedonia) (%)
Place of birth for the foreign-born population - Moldova (%)
Place of birth for the foreign-born population - Poland (%)
Place of birth for the foreign-born population - Romania (%)
Place of birth for the foreign-born population - Russia (%)
Place of birth for the foreign-born population - Serbia (%)
Place of birth for the foreign-born population - Ukraine (%)
Place of birth for the foreign-born population - Other Eastern Europe (%)
Place of birth for the foreign-born population - China (%)
Place of birth for the foreign-born population - Hong Kong (%)
Place of birth for the foreign-born population - Taiwan (%)
Place of birth for the foreign-born population - Japan (%)
Place of birth for the foreign-born population - Korea (%)
Place of birth for the foreign-born population - Other Eastern Asia (%)
Place of birth for the foreign-born population - Afghanistan (%)
Place of birth for the foreign-born population - Bangladesh (%)
Place of birth for the foreign-born population - India (%)
Place of birth for the foreign-born population - Iran (%)
Place of birth for the foreign-born population - Kazakhstan (%)
Place of birth for the foreign-born population - Nepal (%)
Place of birth for the foreign-born population - Pakistan (%)
Place of birth for the foreign-born population - Sri Lanka (%)
Place of birth for the foreign-born population - Uzbekistan (%)
Place of birth for the foreign-born population - Other South Central Asia (%)
Place of birth for the foreign-born population - Burma (%)
Place of birth for the foreign-born population - Cambodia (%)
Place of birth for the foreign-born population - Indonesia (%)
Place of birth for the foreign-born population - Laos (%)
Place of birth for the foreign-born population - Malaysia (%)
Place of birth for the foreign-born population - Philippines (%)
Place of birth for the foreign-born population - Singapore (%)
Place of birth for the foreign-born population - Thailand (%)
Place of birth for the foreign-born population - Vietnam (%)
Place of birth for the foreign-born population - Other South Eastern Asia (%)
Place of birth for the foreign-born population - Armenia (%)
Place of birth for the foreign-born population - Iraq (%)
Place of birth for the foreign-born population - Israel (%)
Place of birth for the foreign-born population - Jordan (%)
Place of birth for the foreign-born population - Kuwait (%)
Place of birth for the foreign-born population - Lebanon (%)
Place of birth for the foreign-born population - Saudi Arabia (%)
Place of birth for the foreign-born population - Syria (%)
Place of birth for the foreign-born population - Turkey (%)
Place of birth for the foreign-born population - Yemen (%)
Place of birth for the foreign-born population - Other Western Asia (%)
Place of birth for the foreign-born population - Eritrea (%)
Place of birth for the foreign-born population - Ethiopia (%)
Place of birth for the foreign-born population - Kenya (%)
Place of birth for the foreign-born population - Somalia (%)
Place of birth for the foreign-born population - Uganda (%)
Place of birth for the foreign-born population - Zimbabwe (%)
Place of birth for the foreign-born population - Other Eastern Africa (%)
Place of birth for the foreign-born population - Cameroon (%)
Place of birth for the foreign-born population - Congo (%)
Place of birth for the foreign-born population - Democratic Republic of Congo (Zaire) (%)
Place of birth for the foreign-born population - Other Middle Africa (%)
Place of birth for the foreign-born population - Egypt (%)
Place of birth for the foreign-born population - Morocco (%)
Place of birth for the foreign-born population - Sudan (%)
Place of birth for the foreign-born population - Other Northern Africa (%)
Place of birth for the foreign-born population - South Africa (%)
Place of birth for the foreign-born population - Other Southern Africa (%)
Place of birth for the foreign-born population - Cabo Verde (%)
Place of birth for the foreign-born population - Ghana (%)
Place of birth for the foreign-born population - Liberia (%)
Place of birth for the foreign-born population - Nigeria (%)
Place of birth for the foreign-born population - Senegal (%)
Place of birth for the foreign-born population - Sierra Leone (%)
Place of birth for the foreign-born population - Other Western Africa (%)
Place of birth for the foreign-born population - Australia (%)
Place of birth for the foreign-born population - New Zealand (%)
Place of birth for the foreign-born population - Fiji (%)
Place of birth for the foreign-born population - Micronesia (%)
Place of birth for the foreign-born population - Bahamas (%)
Place of birth for the foreign-born population - Barbados (%)
Place of birth for the foreign-born population - Cuba (%)
Place of birth for the foreign-born population - Dominica (%)
Place of birth for the foreign-born population - Dominican Republic (%)
Place of birth for the foreign-born population - Grenada (%)
Place of birth for the foreign-born population - Haiti (%)
Place of birth for the foreign-born population - Jamaica (%)
Place of birth for the foreign-born population - St. Vincent and the Grenadines (%)
Place of birth for the foreign-born population - Trinidad and Tobago (%)
Place of birth for the foreign-born population - West Indies (%)
Place of birth for the foreign-born population - Other Caribbean (%)
Place of birth for the foreign-born population - Belize (%)
Place of birth for the foreign-born population - Costa Rica (%)
Place of birth for the foreign-born population - El Salvador (%)
Place of birth for the foreign-born population - Guatemala (%)
Place of birth for the foreign-born population - Honduras (%)
Place of birth for the foreign-born population - Mexico (%)
Place of birth for the foreign-born population - Nicaragua (%)
Place of birth for the foreign-born population - Panama (%)
Place of birth for the foreign-born population - Other Central America (%)
Place of birth for the foreign-born population - Argentina (%)
Place of birth for the foreign-born population - Bolivia (%)
Place of birth for the foreign-born population - Brazil (%)
Place of birth for the foreign-born population - Chile (%)
Place of birth for the foreign-born population - Colombia (%)
Place of birth for the foreign-born population - Ecuador (%)
Place of birth for the foreign-born population - Guyana (%)
Place of birth for the foreign-born population - Peru (%)
Place of birth for the foreign-born population - Uruguay (%)
Place of birth for the foreign-born population - Venezuela (%)
Place of birth for the foreign-born population - Other South America (%)
Place of birth for the foreign-born population - Canada (%)
Place of birth for the foreign-born population - Other Northern America (%)
Place of birth for the foreign-born population - Other (%)
Latest news about races in Princeton, TX collected exclusively by city-data.com from local newspapers, TV, and radio stations
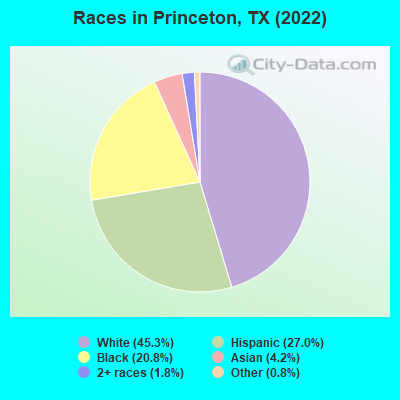
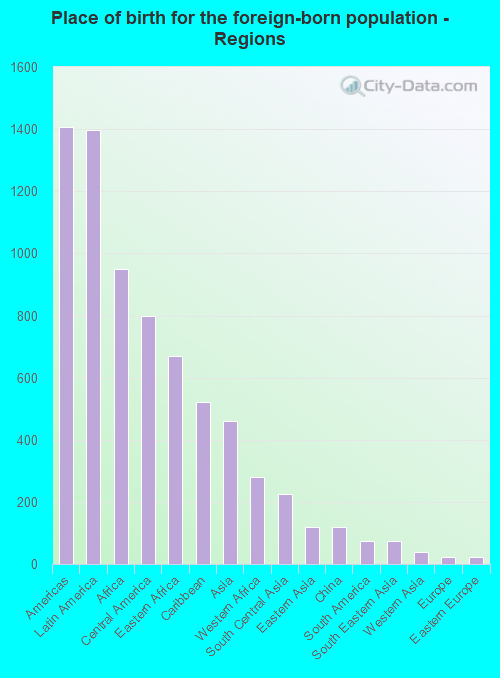
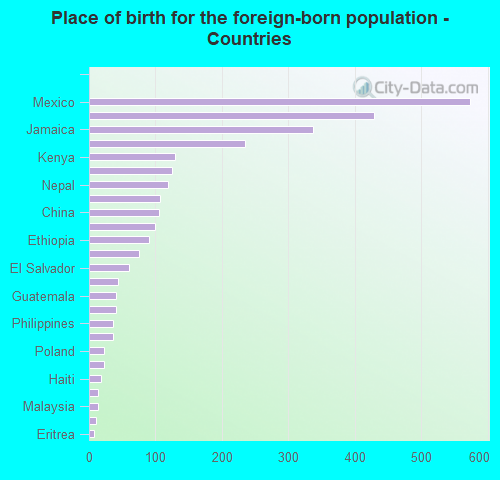
According to 2022 data, the most numerous races in Princeton, TX are Hispanic (5,349 residents), White alone (8,963 residents), and Black alone (4,117 residents). 74.3% of Princeton residents speak English at home. 14.4% of Princeton, TX residents are foreign-born (7.3% born in Latin America, 5.0% born in Africa, 2.4% born in Asia), which is 18.4% less than the foreign-born rate of 17.0% across the entire state of Texas.
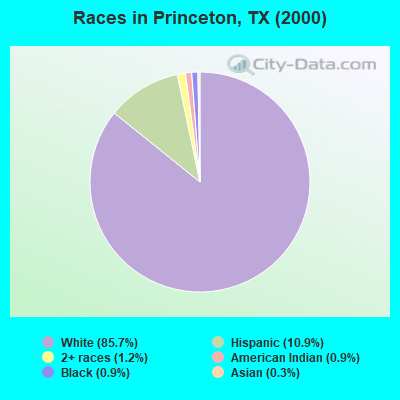
Race distribution in Princeton
2000 2022
10,933,313 52.4% White alone 6,669,666 32.0% Hispanic 2,364,255 11.3% Black alone 554,445 2.7% Asian alone 230,567 1.1% Two or more races 68,859 0.3% American Indian alone 19,958 0.10% Other race alone 10,757 0.05% Native Hawaiian and Other
12,070,642 40.2% Hispanic 11,683,430 38.9% White alone 3,508,706 11.7% Black alone 1,608,173 5.4% Asian alone 956,560 3.2% Two or more races 125,763 0.4% Other race alone 47,023 0.2% American Indian alone 29,275 0.10% Native Hawaiian and Other
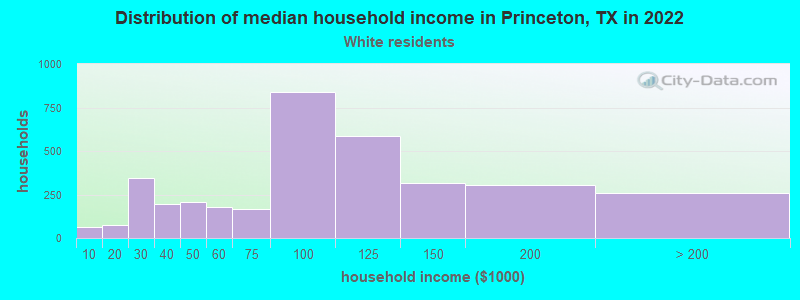
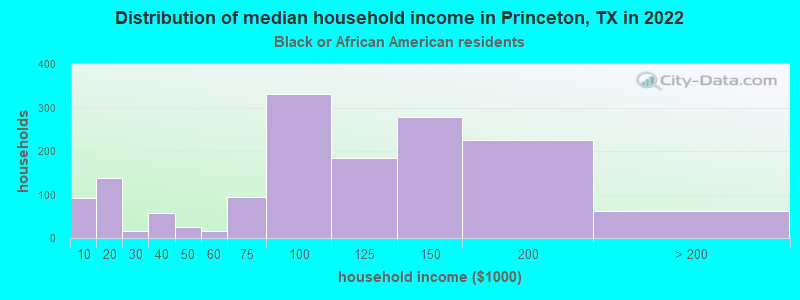
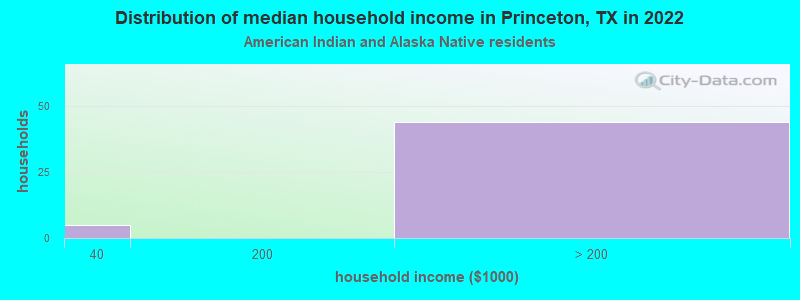
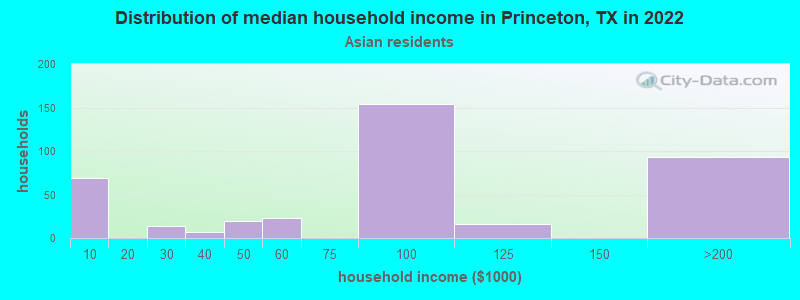
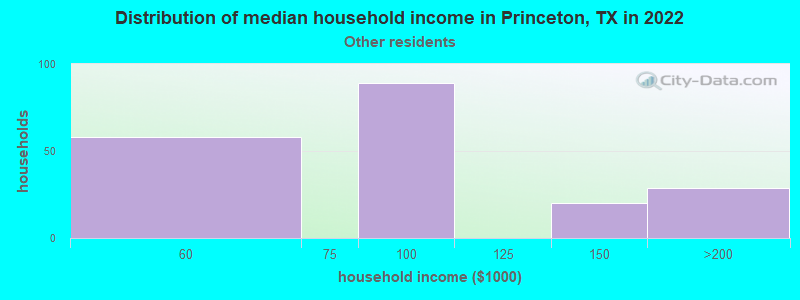
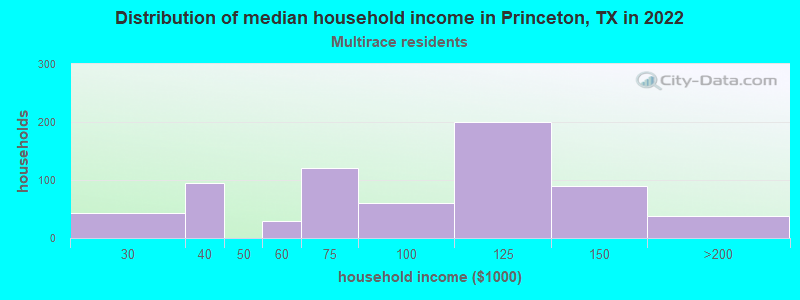
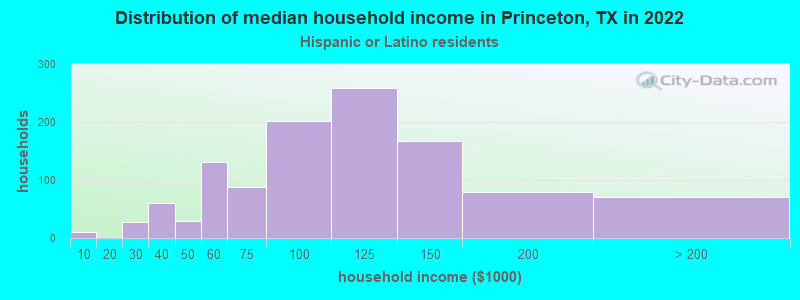
Income and house value in Princeton Median household income in 2022 $87,984 White non-Hispanic householders$97,247 Black householders$117,718 American Indian and Alaska Native householders$97,816 Asian householders$110,474 Some other race householders$90,480 Two or more races householders$106,053 Hispanic or Latino race householdersMedian 2022 house value $347,779 White Non-Hispanic householders$340,130 Black or African American householders$280,467 American Indian or Alaska Native householders $89,239 Asian householders$305,964 Some other race householders$331,461 Two or more races householders$305,964 Hispanic or Latino householders
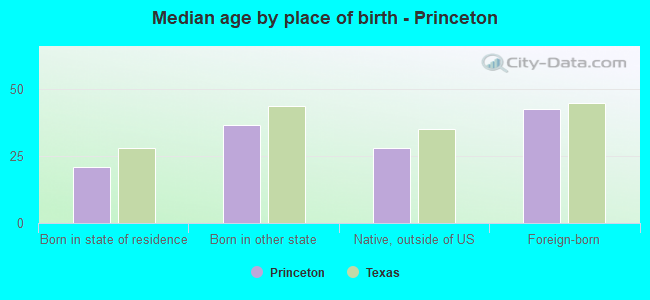
Median age by race in Princeton
32.4 Median age for White residents29.2 34.8 34.9 Median age for Black or African American residents36.9 34.3 49.9 Median age for American Indian / Alaska Native residents15.1 52.1 30.6 Median age for Asian residents31.2 30.2 -819,226,749.4 Median age for Native Hawaiian / Pacific Islander residents-770,894,787.8 -577,777,777.2 23.1 Median age for Other race residents23.5 22.5 25.5 Median age for Two or more races residents34.6 18.0 35.3 Median age for White alone residents33.2 36.4 22.1 Median age for Hispanic or Latino residents22.9 20.6
Owner/renter occupied households by race in Princeton
House owners and renters - White residents 2,647 73.8% Owner occupied939 26.2% Renter occupiedHouse owners and renters - Black or African American residents 1,325 87.0% Owner occupied197 13.0% Renter occupiedHouse owners and renters - American Indian / Alaska Native residents 17 100.0% Owner occupiedHouse owners and renters - Asian residents 319 75.9% Owner occupied101 24.1% Renter occupiedHouse owners and renters - Other race residents 163 100.0% Owner occupiedHouse owners and renters - Two or more races residents 589 90.4% Owner occupied63 9.6% Renter occupiedHouse owners and renters - White alone residents 2,355 73.4% Owner occupied853 26.6% Renter occupiedHouse owners and renters - Hispanic or Latino residents 954 87.0% Owner occupied143 13.0% Renter occupied
Language usage in Princeton
English speakers - Total 74.3% of residents of Princeton speak English at home.
14.8% of residents speak Spanish at home 2,422 88.5% Speak English very well316 11.5% Speak English less than very well10.4% of residents speak other language at home 1,650 86.0% Speak English very well268 14.0% Speak English less than very well
English speakers - Born in the United States 90.1% of residents of Princeton speak English at home.
6.9% of residents speak Spanish at home 361 90.0% Speak English very well40 10.0% Speak English less than very well2.1% of residents speak other language at home 124 100.0% Speak English very well
English speakers - Native, born elsewhere 28.0% of residents of Princeton speak English at home.
57.0% of residents speak Spanish at home 154 86.0% Speak English very well25 14.0% Speak English less than very well14.3% of residents speak other language at home 45 100.0% Speak English very well
English speakers - Foreign-born 35.3% of residents of Princeton speak English at home.
23.0% of residents speak Spanish at home 486 69.9% Speak English very well209 30.1% Speak English less than very well43.8% of residents speak other language at home 1,058 79.9% Speak English very well266 20.1% Speak English less than very well
White (Caucasian) - Speak only English Native:
88.7% (8,833)Foreign-born:
24.4% (101)
White (Caucasian) - Speak another language Native:
10.6% (1,054)Foreign-born:
76.0% (313)
Black or African American - Speak only English Native:
98.6% (2,212)Foreign-born:
49.1% (681)
Black or African American - Speak another language Native:
1.7% (39)Foreign-born:
49.4% (685)
American Indian / Alaska Native - Speak only English Native:
76.6% (47)Foreign-born:
62.4% (53)
American Indian / Alaska Native - Speak another language Native:
23.4% (14)Foreign-born:
57.8% (49)
Asian - Speak only English Native:
39.6% (139)Foreign-born:
3.8% (19)
Asian - Speak another language Native:
60.8% (213)Foreign-born:
95.0% (463)
Other race - Speak only English Native:
57.9% (561)Foreign-born:
6.9% (9)
Other race - Speak another language Native:
41.4% (402)Foreign-born:
91.1% (123)
Two or more races - Speak only English Native:
51.2% (959)Foreign-born:
25.5% (109)
Two or more races - Speak another language Native:
49.6% (930)Foreign-born:
73.9% (316)
White alone - Speak only English Native:
96.6% (8,226)Foreign-born:
21.2% (32)
White alone - Speak another language Native:
3.4% (290)Foreign-born:
79.4% (118)
Hispanic or Latino - Speak only English Native:
46.4% (1,895)Foreign-born:
27.4% (236)
Hispanic or Latino - Speak another language Native:
52.3% (2,137)Foreign-born:
76.9% (662)
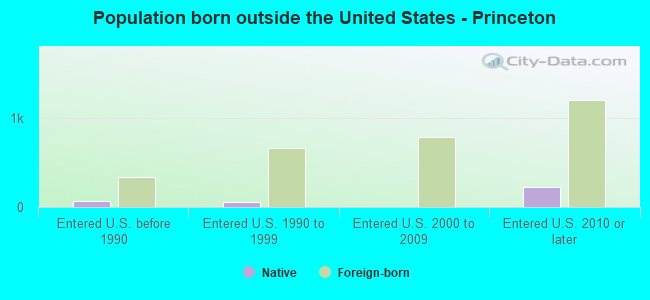
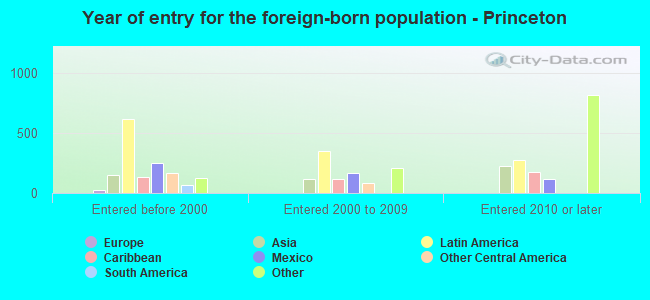
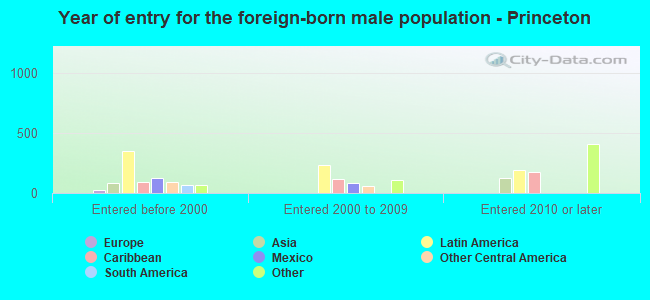
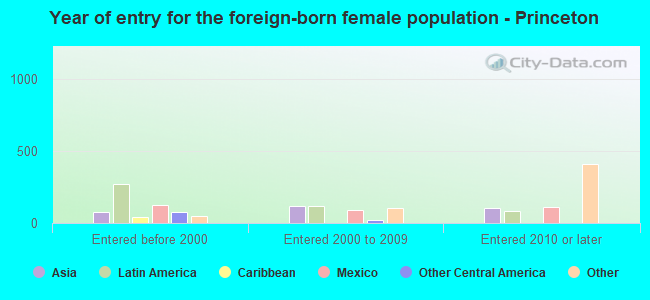
Foreign-born residents in Princeton 2,842 residents are foreign born (7.3% Latin America , 5.0% Africa , 2.4% Asia ).
This city:
14.4%Texas:
17.1%
Marital status for residents in Princeton Marital status - White (Caucasian) population 15 years and over
Males 30.4% Never married59.7% Now married1.0% Separated5.1% Widowed3.8% DivorcedFemales 22.0% Never married51.6% Now married2.4% Separated6.7% Widowed17.3% DivorcedWomen who gave birth in the past 12 months Now married:
100.0% (77)Unmarried:
0.0% (0)
Women who did not give birth in the past 12 months Now married:
57.3% (1,585)Unmarried:
42.7% (1,182)
Marital status - Black or African American population 15 years and over
Males 29.3% Never married51.3% Now married0.0% Separated4.4% Widowed15.0% DivorcedFemales 32.5% Never married47.8% Now married0.2% Separated5.6% Widowed13.9% DivorcedWomen who gave birth in the past 12 months Now married:
55.5% (90)Unmarried:
44.5% (72)
Women who did not give birth in the past 12 months Now married:
46.5% (525)Unmarried:
53.5% (603)
Marital status - American Indian / Alaska Native population 15 years and over
Males 0.0% Never married100.0% Now married0.0% Separated0.0% Widowed0.0% DivorcedFemales 0.0% Never married63.8% Now married0.0% Separated0.0% Widowed36.2% DivorcedWomen who did not give birth in the past 12 months Now married:
100.0% (53)Unmarried:
0.0% (0)
Marital status - Asian population 15 years and over
Males 9.2% Never married57.1% Now married0.0% Separated28.4% Widowed5.4% DivorcedFemales 43.0% Never married47.9% Now married0.0% Separated0.0% Widowed9.1% DivorcedWomen who gave birth in the past 12 months Now married:
100.0% (66)Unmarried:
0.0% (0)
Women who did not give birth in the past 12 months Now married:
24.6% (51)Unmarried:
75.4% (157)
Marital status - Other race population 15 years and over
Males 55.0% Never married30.5% Now married0.0% Separated0.0% Widowed14.5% DivorcedFemales 23.6% Never married73.4% Now married0.0% Separated3.0% Widowed0.0% DivorcedWomen who gave birth in the past 12 months Now married:
79.2% (39)Unmarried:
20.8% (10)
Women who did not give birth in the past 12 months Now married:
68.5% (138)Unmarried:
31.5% (64)
Marital status - Two or more races population 15 years and over
Males 17.6% Never married77.1% Now married0.0% Separated0.0% Widowed5.3% DivorcedFemales 27.4% Never married68.2% Now married0.0% Separated0.0% Widowed4.3% DivorcedWomen who gave birth in the past 12 months Now married:
100.0% (63)Unmarried:
0.0% (0)
Women who did not give birth in the past 12 months Now married:
62.8% (390)Unmarried:
37.2% (231)
Marital status - White alone, not Hispanic / Latino population 15 years and over
Males 30.5% Never married58.2% Now married0.6% Separated6.1% Widowed4.6% DivorcedFemales 17.1% Never married50.4% Now married2.9% Separated8.3% Widowed21.3% DivorcedWomen who gave birth in the past 12 months Now married:
100.0% (60)Unmarried:
0.0% (0)
Women who did not give birth in the past 12 months Now married:
59.3% (1,284)Unmarried:
40.7% (883)
Marital status - Hispanic or Latino population 15 years and over
Males 28.9% Never married64.8% Now married1.3% Separated0.0% Widowed5.0% DivorcedFemales 32.2% Never married64.3% Now married0.0% Separated0.5% Widowed3.0% DivorcedWomen who gave birth in the past 12 months Now married:
91.3% (115)Unmarried:
8.7% (11)
Women who did not give birth in the past 12 months Now married:
59.3% (823)Unmarried:
40.7% (565)
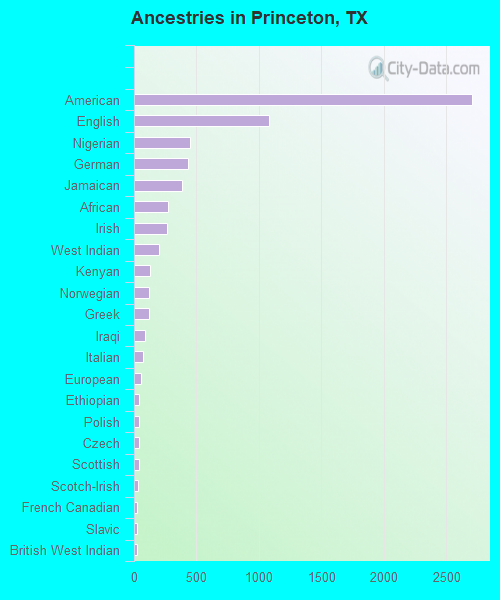
Ancestries in Princeton
2,705 22.6% American1,084 9.1% English449 3.8% Nigerian434 3.6% German388 3.2% Jamaican270 2.3% African263 2.2% Irish203 1.7% West Indian129 1.1% Kenyan123 1.0% Norwegian118 1.0% Greek88 0.7% Iraqi75 0.6% Italian55 0.5% European44 0.4% Ethiopian43 0.4% Polish39 0.3% Czech38 0.3% Scottish36 0.3% Scotch-Irish27 0.2% French Canadian27 0.2% Slavic27 0.2% British West Indian20 0.2% Portuguese20 0.2% Zimbabwean15 0.1% Canadian9 0.08% Swiss
Geographical mobility in Princeton Same house 1 year ago 9,684 90.7% White (Caucasian)3,446 82.6% Black or African American225 100.0% American Indian / Alaska Native500 59.3% Asian1,012 89.7% Other race2,217 89.3% Two or more races8,040 90.4% White alone, not Hispanic / Latino4,667 90.1% Hispanic or LatinoMoved within same county 566 5.3% White / Caucasian236 5.7% Black or African American42 3.8% Other race178 7.2% Two or more races477 5.4% White alone, not Hispanic / Latino257 5.0% Hispanic or LatinoMoved within same state 389 3.6% White / Caucasian68 1.6% Black or African American228 27.0% Asian28 2.4% Other race24 1.0% Two or more races322 3.6% White alone, not Hispanic / Latino124 2.4% Hispanic or LatinoMoved from different state 87 0.8% White / Caucasian365 8.7% Black or African American132 15.6% Asian43 3.8% Other race89 1.0% White alone, not Hispanic / Latino70 1.4% Hispanic or Latino
Children Nativity (place of birth) in Princeton
Children under 6 years - Living with two parents Both parents native 788 100.0% NativeBoth parents foreign-born 362 100.0% NativeOne native, one foreign-born parent 388 100.0% NativeChildren under 6 years - Living with one parent Native parent 511 100.0% NativeChildren 6 to 17 years - Living with two parents Both parents native 2,507 98.1% Native49 1.9% Foreign-bornBoth parents foreign-born 393 96.2% Native16 3.8% Foreign-bornOne native, one foreign-born parent 316 100.0% NativeChildren 6 to 17 years - Living with one parent Native parent 402 85.7% Native67 14.3% Foreign-bornForeign-born parent 151 86.3% Native24 13.7% Foreign-born
Grandparents responsible for own grandchildren in Princeton
Grandparents (30 to 59 years) White / Caucasian 59 100.0% Not responsible for grandchildrenBlack or African American 67 100.0% Responsible for grandchildrenWhite alone, not Hispanic / Latino 58 100.0% Not responsible for grandchildrenGrandparents (60 years and over) White / Caucasian 14 6.6% Responsible for grandchildren196 93.4% Not responsible for grandchildrenBlack or African American 129 100.0% Not responsible for grandchildrenWhite alone, not Hispanic / Latino 13 7.1% Responsible for grandchildren175 92.9% Not responsible for grandchildren