Races in Port Arthur, Texas (TX) Detailed Stats
Data:
Races - White alone (%)
Races - White alone (% change since 2000)
Races - Black alone (%)
Races - Black alone (% change since 2000)
Races - American Indian alone (%)
Races - American Indian alone (% change since 2000)
Races - Asian alone (%)
Races - Asian alone (% change since 2000)
Races - Hispanic (%)
Races - Hispanic (% change since 2000)
Races - Native Hawaiian and Other Pacific Islander alone (%)
Races - Native Hawaiian and Other Pacific Islander alone (% change since 2000)
Races - Two or more races(%)
Races - Two or more races(% change since 2000)
Races - Other race alone (%)
Races - Other race alone (% change since 2000)
Racial diversity
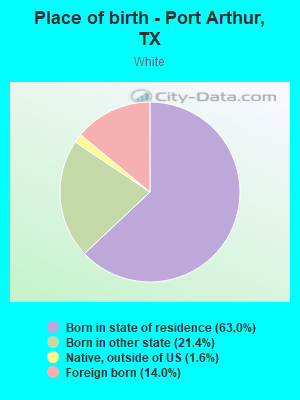
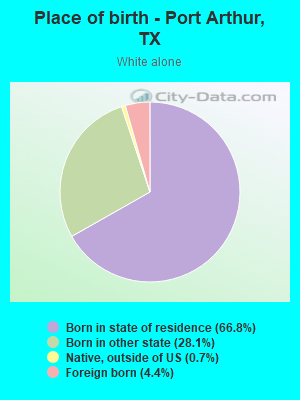
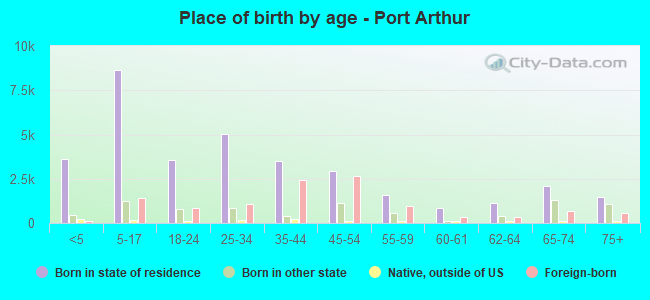
Place of birth - Born in state of residence (%)
Place of birth - Born in state of residence (%) - White
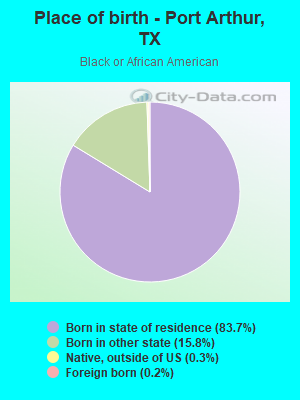
Place of birth - Born in state of residence (%) - Black or African American
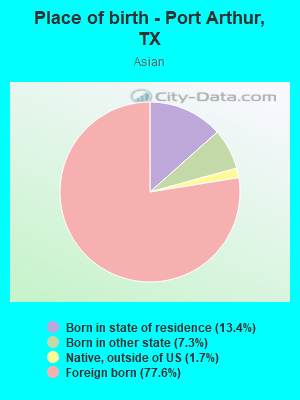
Place of birth - Born in state of residence (%) - Asian
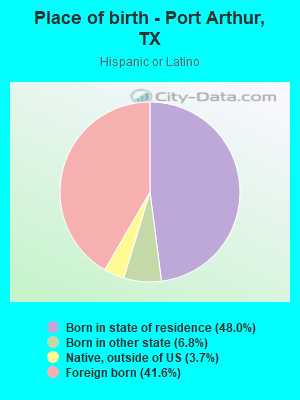
Place of birth - Born in state of residence (%) - Hispanic or Latino
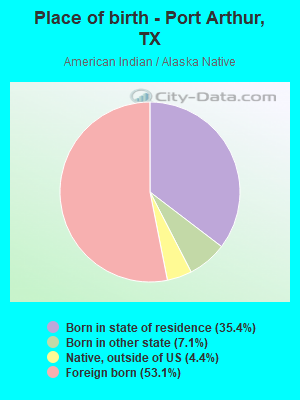
Place of birth - Born in state of residence (%) - American Indian and Alaska Native
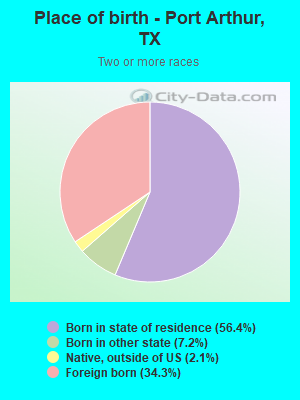
Place of birth - Born in state of residence (%) - Multirace
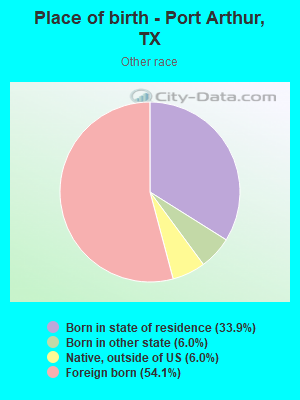
Place of birth - Born in state of residence (%) - Other Race
Place of birth - Born in other state (%)
Place of birth - Born in other state (%) - White
Place of birth - Born in other state (%) - Black or African American
Place of birth - Born in other state (%) - Asian
Place of birth - Born in other state (%) - Hispanic or Latino
Place of birth - Born in other state (%) - American Indian and Alaska Native
Place of birth - Born in other state (%) - Multirace
Place of birth - Born in other state (%) - Other Race
Place of birth - Native, outside of US (%)
Place of birth - Native, outside of US (%) - White
Place of birth - Native, outside of US (%) - Black or African American
Place of birth - Native, outside of US (%) - Asian
Place of birth - Native, outside of US (%) - Hispanic or Latino
Place of birth - Native, outside of US (%) - American Indian and Alaska Native
Place of birth - Native, outside of US (%) - Multirace
Place of birth - Native, outside of US (%) - Other Race
Place of birth - Foreign born (%)
Place of birth - Foreign born (%) - White
Place of birth - Foreign born (%) - Black or African American
Place of birth - Foreign born (%) - Asian
Place of birth - Foreign born (%) - Hispanic or Latino
Place of birth - Foreign born (%) - American Indian and Alaska Native
Place of birth - Foreign born (%) - Multirace
Place of birth - Foreign born (%) - Other Race
Residents speaking English at home (%)
Residents speaking English at home - Born in the United States (%)
Residents speaking English at home - Native, born elsewhere (%)
Residents speaking English at home - Foreign born (%)
Residents speaking Spanish at home (%)
Residents speaking Spanish at home - Born in the United States (%)
Residents speaking Spanish at home - Native, born elsewhere (%)
Residents speaking Spanish at home - Foreign born (%)
Residents speaking other language at home (%)
Residents speaking other language at home - Born in the United States (%)
Residents speaking other language at home - Native, born elsewhere (%)
Residents speaking other language at home - Foreign born (%)
Marital status - Never married (%)
Marital status - Now married (%)
Marital status - Separated (%)
Marital status - Widowed (%)
Marital status - Divorced (%)
Ancestries Reported - Arab (%)
Ancestries Reported - Czech (%)
Ancestries Reported - Danish (%)
Ancestries Reported - Dutch (%)
Ancestries Reported - English (%)
Ancestries Reported - French (%)
Ancestries Reported - French Canadian (%)
Ancestries Reported - German (%)
Ancestries Reported - Greek (%)
Ancestries Reported - Hungarian (%)
Ancestries Reported - Irish (%)
Ancestries Reported - Italian (%)
Ancestries Reported - Lithuanian (%)
Ancestries Reported - Norwegian (%)
Ancestries Reported - Polish (%)
Ancestries Reported - Portuguese (%)
Ancestries Reported - Russian (%)
Ancestries Reported - Scotch-Irish (%)
Ancestries Reported - Scottish (%)
Ancestries Reported - Slovak (%)
Ancestries Reported - Subsaharan African (%)
Ancestries Reported - Swedish (%)
Ancestries Reported - Swiss (%)
Ancestries Reported - Ukrainian (%)
Ancestries Reported - United States (%)
Ancestries Reported - Welsh (%)
Ancestries Reported - West Indian (%)
Ancestries Reported - Other (%)
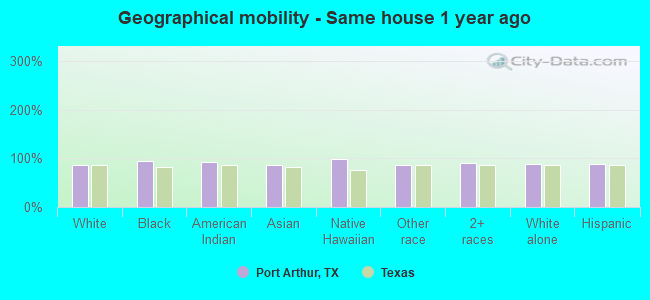
Geographical mobility - Same house 1 year ago (%)
Geographical mobility - Same house 1 year ago (%) - White
Geographical mobility - Same house 1 year ago (%) - Black or African American
Geographical mobility - Same house 1 year ago (%) - Asian
Geographical mobility - Same house 1 year ago (%) - Hispanic or Latino
Geographical mobility - Same house 1 year ago (%) - American Indian and Alaska Native
Geographical mobility - Same house 1 year ago (%) - Multirace
Geographical mobility - Same house 1 year ago (%) - Other Race
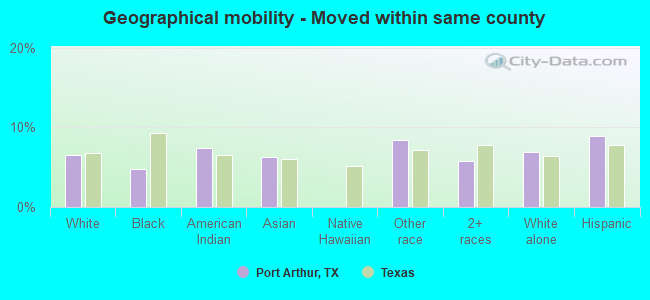
Geographical mobility - Moved within same county (%)
Geographical mobility - Moved within same county (%) - White
Geographical mobility - Moved within same county (%) - Black or African American
Geographical mobility - Moved within same county (%) - Asian
Geographical mobility - Moved within same county (%) - Hispanic or Latino
Geographical mobility - Moved within same county (%) - American Indian and Alaska Native
Geographical mobility - Moved within same county (%) - Multirace
Geographical mobility - Moved within same county (%) - Other Race
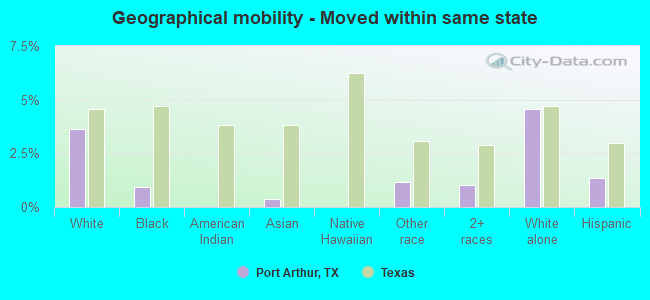
Geographical mobility - Moved from different county within same state (%)
Geographical mobility - Moved from different county within same state (%) - White
Geographical mobility - Moved from different county within same state (%) - Black or African American
Geographical mobility - Moved from different county within same state (%) - Asian
Geographical mobility - Moved from different county within same state (%) - Hispanic or Latino
Geographical mobility - Moved from different county within same state (%) - American Indian and Alaska Native
Geographical mobility - Moved from different county within same state (%) - Multirace
Geographical mobility - Moved from different county within same state (%) - Other Race
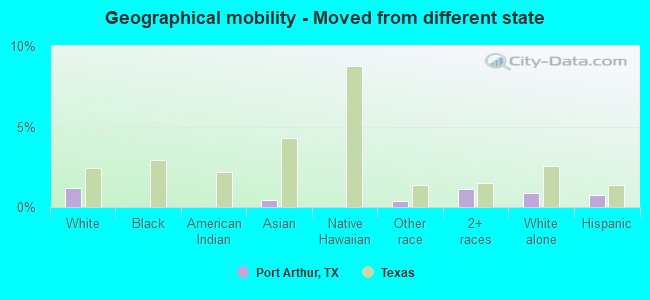
Geographical mobility - Moved from different state (%)
Geographical mobility - Moved from different state (%) - White
Geographical mobility - Moved from different state (%) - Black or African American
Geographical mobility - Moved from different state (%) - Asian
Geographical mobility - Moved from different state (%) - Hispanic or Latino
Geographical mobility - Moved from different state (%) - American Indian and Alaska Native
Geographical mobility - Moved from different state (%) - Multirace
Geographical mobility - Moved from different state (%) - Other Race
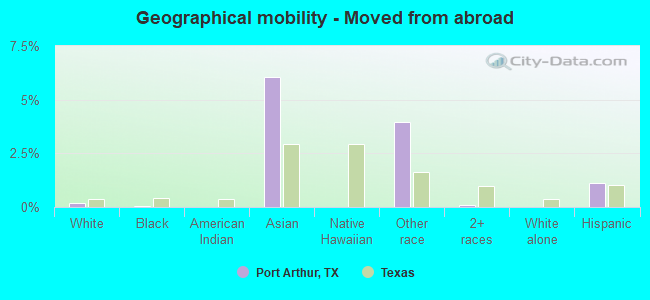
Geographical mobility - Moved from abroad (%)
Geographical mobility - Moved from abroad (%) - White
Geographical mobility - Moved from abroad (%) - Black or African American
Geographical mobility - Moved from abroad (%) - Asian
Geographical mobility - Moved from abroad (%) - Hispanic or Latino
Geographical mobility - Moved from abroad (%) - American Indian and Alaska Native
Geographical mobility - Moved from abroad (%) - Multirace
Geographical mobility - Moved from abroad (%) - Other Race
Place of birth for the foreign-born population - Ireland (%)
Place of birth for the foreign-born population - Denmark (%)
Place of birth for the foreign-born population - Norway (%)
Place of birth for the foreign-born population - Sweden (%)
Place of birth for the foreign-born population - United Kingdom (%)
Place of birth for the foreign-born population - England (%)
Place of birth for the foreign-born population - Scotland (%)
Place of birth for the foreign-born population - Other Northern Europe (%)
Place of birth for the foreign-born population - Austria (%)
Place of birth for the foreign-born population - Belgium (%)
Place of birth for the foreign-born population - France (%)
Place of birth for the foreign-born population - Germany (%)
Place of birth for the foreign-born population - Netherlands (%)
Place of birth for the foreign-born population - Switzerland (%)
Place of birth for the foreign-born population - Other Western Europe (%)
Place of birth for the foreign-born population - Greece (%)
Place of birth for the foreign-born population - Italy (%)
Place of birth for the foreign-born population - Portugal (%)
Place of birth for the foreign-born population - Spain (%)
Place of birth for the foreign-born population - Other Southern Europe (%)
Place of birth for the foreign-born population - Albania (%)
Place of birth for the foreign-born population - Belarus (%)
Place of birth for the foreign-born population - Bosnia and Herzegovina (%)
Place of birth for the foreign-born population - Bulgaria (%)
Place of birth for the foreign-born population - Croatia (%)
Place of birth for the foreign-born population - Czechoslovakia (%)
Place of birth for the foreign-born population - Hungary (%)
Place of birth for the foreign-born population - Latvia (%)
Place of birth for the foreign-born population - Lithuania (%)
Place of birth for the foreign-born population - North Macedonia (Macedonia) (%)
Place of birth for the foreign-born population - Moldova (%)
Place of birth for the foreign-born population - Poland (%)
Place of birth for the foreign-born population - Romania (%)
Place of birth for the foreign-born population - Russia (%)
Place of birth for the foreign-born population - Serbia (%)
Place of birth for the foreign-born population - Ukraine (%)
Place of birth for the foreign-born population - Other Eastern Europe (%)
Place of birth for the foreign-born population - China (%)
Place of birth for the foreign-born population - Hong Kong (%)
Place of birth for the foreign-born population - Taiwan (%)
Place of birth for the foreign-born population - Japan (%)
Place of birth for the foreign-born population - Korea (%)
Place of birth for the foreign-born population - Other Eastern Asia (%)
Place of birth for the foreign-born population - Afghanistan (%)
Place of birth for the foreign-born population - Bangladesh (%)
Place of birth for the foreign-born population - India (%)
Place of birth for the foreign-born population - Iran (%)
Place of birth for the foreign-born population - Kazakhstan (%)
Place of birth for the foreign-born population - Nepal (%)
Place of birth for the foreign-born population - Pakistan (%)
Place of birth for the foreign-born population - Sri Lanka (%)
Place of birth for the foreign-born population - Uzbekistan (%)
Place of birth for the foreign-born population - Other South Central Asia (%)
Place of birth for the foreign-born population - Burma (%)
Place of birth for the foreign-born population - Cambodia (%)
Place of birth for the foreign-born population - Indonesia (%)
Place of birth for the foreign-born population - Laos (%)
Place of birth for the foreign-born population - Malaysia (%)
Place of birth for the foreign-born population - Philippines (%)
Place of birth for the foreign-born population - Singapore (%)
Place of birth for the foreign-born population - Thailand (%)
Place of birth for the foreign-born population - Vietnam (%)
Place of birth for the foreign-born population - Other South Eastern Asia (%)
Place of birth for the foreign-born population - Armenia (%)
Place of birth for the foreign-born population - Iraq (%)
Place of birth for the foreign-born population - Israel (%)
Place of birth for the foreign-born population - Jordan (%)
Place of birth for the foreign-born population - Kuwait (%)
Place of birth for the foreign-born population - Lebanon (%)
Place of birth for the foreign-born population - Saudi Arabia (%)
Place of birth for the foreign-born population - Syria (%)
Place of birth for the foreign-born population - Turkey (%)
Place of birth for the foreign-born population - Yemen (%)
Place of birth for the foreign-born population - Other Western Asia (%)
Place of birth for the foreign-born population - Eritrea (%)
Place of birth for the foreign-born population - Ethiopia (%)
Place of birth for the foreign-born population - Kenya (%)
Place of birth for the foreign-born population - Somalia (%)
Place of birth for the foreign-born population - Uganda (%)
Place of birth for the foreign-born population - Zimbabwe (%)
Place of birth for the foreign-born population - Other Eastern Africa (%)
Place of birth for the foreign-born population - Cameroon (%)
Place of birth for the foreign-born population - Congo (%)
Place of birth for the foreign-born population - Democratic Republic of Congo (Zaire) (%)
Place of birth for the foreign-born population - Other Middle Africa (%)
Place of birth for the foreign-born population - Egypt (%)
Place of birth for the foreign-born population - Morocco (%)
Place of birth for the foreign-born population - Sudan (%)
Place of birth for the foreign-born population - Other Northern Africa (%)
Place of birth for the foreign-born population - South Africa (%)
Place of birth for the foreign-born population - Other Southern Africa (%)
Place of birth for the foreign-born population - Cabo Verde (%)
Place of birth for the foreign-born population - Ghana (%)
Place of birth for the foreign-born population - Liberia (%)
Place of birth for the foreign-born population - Nigeria (%)
Place of birth for the foreign-born population - Senegal (%)
Place of birth for the foreign-born population - Sierra Leone (%)
Place of birth for the foreign-born population - Other Western Africa (%)
Place of birth for the foreign-born population - Australia (%)
Place of birth for the foreign-born population - New Zealand (%)
Place of birth for the foreign-born population - Fiji (%)
Place of birth for the foreign-born population - Micronesia (%)
Place of birth for the foreign-born population - Bahamas (%)
Place of birth for the foreign-born population - Barbados (%)
Place of birth for the foreign-born population - Cuba (%)
Place of birth for the foreign-born population - Dominica (%)
Place of birth for the foreign-born population - Dominican Republic (%)
Place of birth for the foreign-born population - Grenada (%)
Place of birth for the foreign-born population - Haiti (%)
Place of birth for the foreign-born population - Jamaica (%)
Place of birth for the foreign-born population - St. Vincent and the Grenadines (%)
Place of birth for the foreign-born population - Trinidad and Tobago (%)
Place of birth for the foreign-born population - West Indies (%)
Place of birth for the foreign-born population - Other Caribbean (%)
Place of birth for the foreign-born population - Belize (%)
Place of birth for the foreign-born population - Costa Rica (%)
Place of birth for the foreign-born population - El Salvador (%)
Place of birth for the foreign-born population - Guatemala (%)
Place of birth for the foreign-born population - Honduras (%)
Place of birth for the foreign-born population - Mexico (%)
Place of birth for the foreign-born population - Nicaragua (%)
Place of birth for the foreign-born population - Panama (%)
Place of birth for the foreign-born population - Other Central America (%)
Place of birth for the foreign-born population - Argentina (%)
Place of birth for the foreign-born population - Bolivia (%)
Place of birth for the foreign-born population - Brazil (%)
Place of birth for the foreign-born population - Chile (%)
Place of birth for the foreign-born population - Colombia (%)
Place of birth for the foreign-born population - Ecuador (%)
Place of birth for the foreign-born population - Guyana (%)
Place of birth for the foreign-born population - Peru (%)
Place of birth for the foreign-born population - Uruguay (%)
Place of birth for the foreign-born population - Venezuela (%)
Place of birth for the foreign-born population - Other South America (%)
Place of birth for the foreign-born population - Canada (%)
Place of birth for the foreign-born population - Other Northern America (%)
Place of birth for the foreign-born population - Other (%)
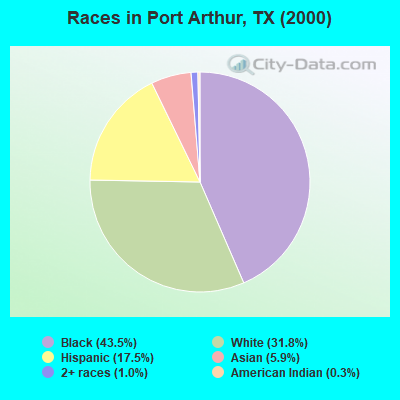
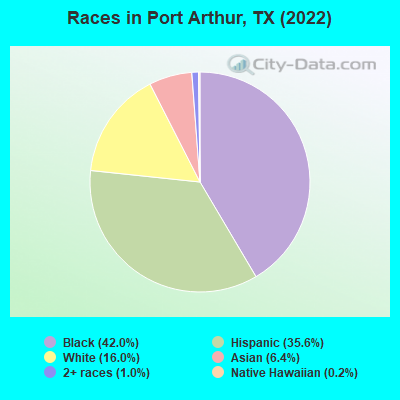
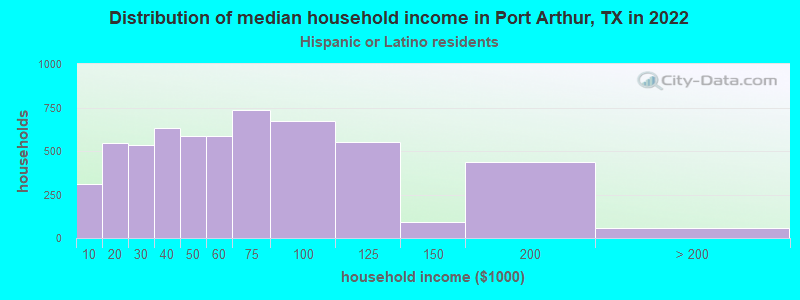
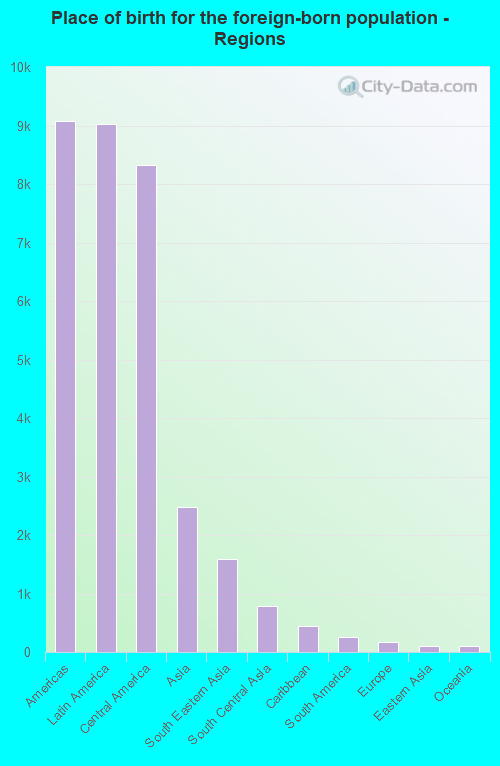
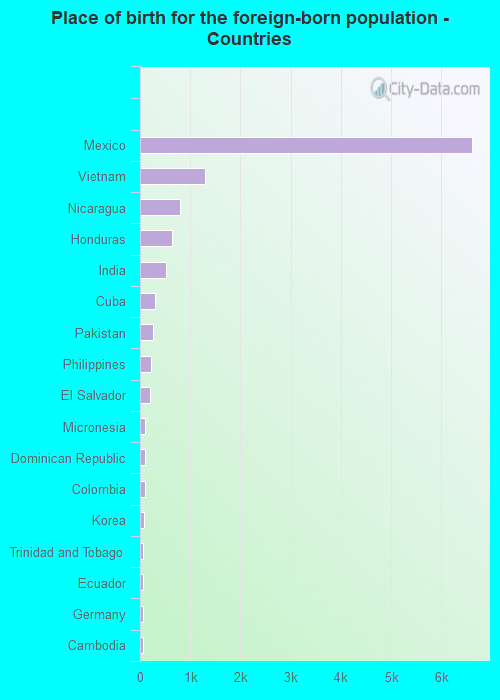
According to 2022 data, the most numerous races in Port Arthur, TX are Hispanic (19,604 residents), White alone (8,806 residents), and Black alone (23,100 residents). 64.7% of Port Arthur residents speak English at home. 21.6% of Port Arthur, TX residents are foreign-born (15.6% born in Latin America, 4.3% born in Asia), which is 21.3% greater than the foreign-born rate of 17.0% across the entire state of Texas.
Race distribution in Port Arthur
2000 2022
10,933,313 52.4% White alone 6,669,666 32.0% Hispanic 2,364,255 11.3% Black alone 554,445 2.7% Asian alone 230,567 1.1% Two or more races 68,859 0.3% American Indian alone 19,958 0.10% Other race alone 10,757 0.05% Native Hawaiian and Other
12,070,642 40.2% Hispanic 11,683,430 38.9% White alone 3,508,706 11.7% Black alone 1,608,173 5.4% Asian alone 956,560 3.2% Two or more races 125,763 0.4% Other race alone 47,023 0.2% American Indian alone 29,275 0.10% Native Hawaiian and Other
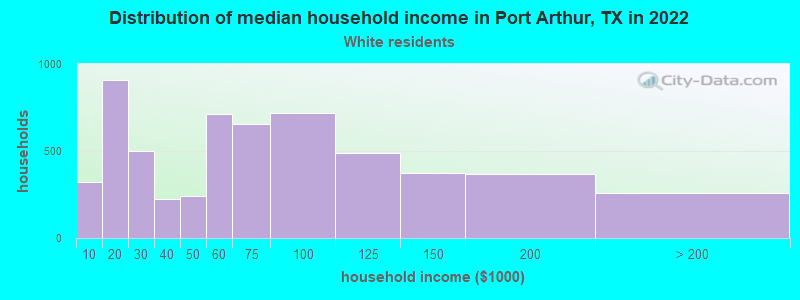
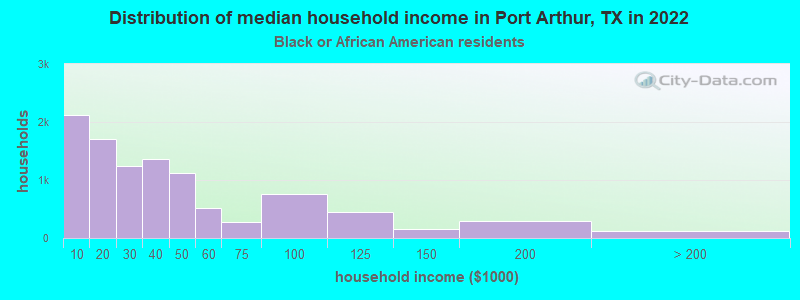
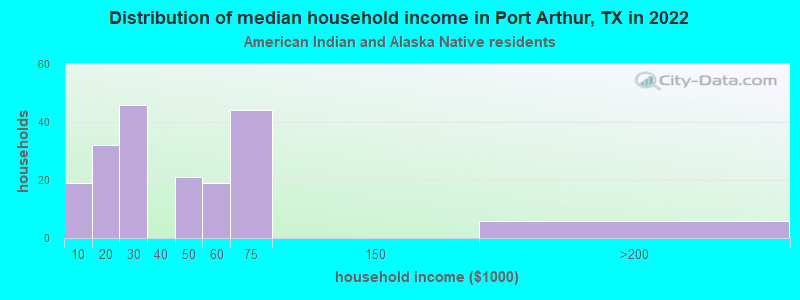
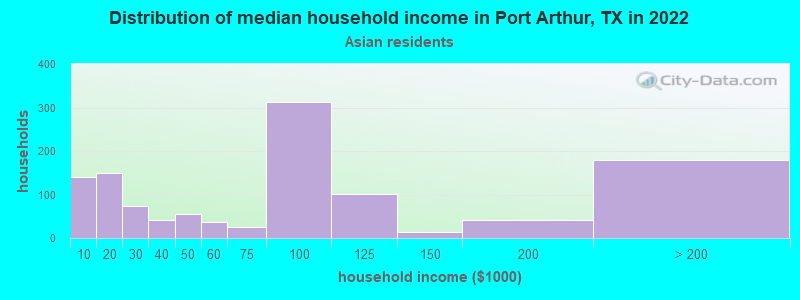
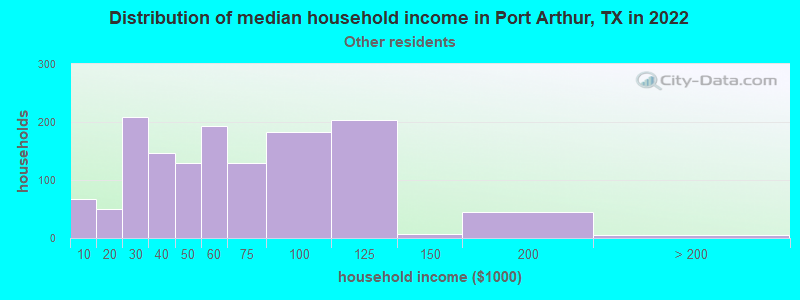
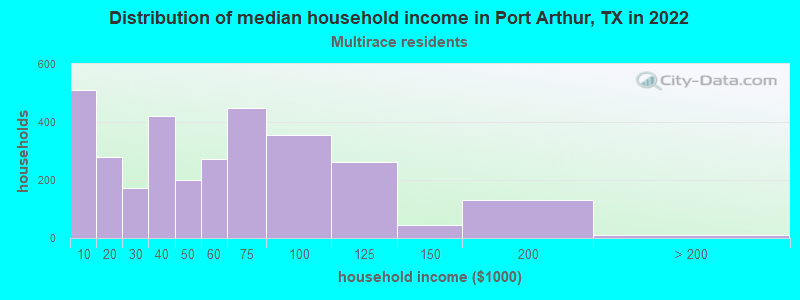
Income and house value in Port Arthur Median household income in 2022 $59,734 White non-Hispanic householders$31,216 Black householders$28,595 American Indian and Alaska Native householders$80,332 Asian householders$57,747 Some other race householders$39,967 Two or more races householders$58,121 Hispanic or Latino race householdersMedian 2022 house value $121,872 White Non-Hispanic householders$81,066 Black or African American householders$56,855 American Indian or Alaska Native householders $97,388 Asian householders$224,973 Native Hawaiian and other Pacific Islander householders$78,618 Some other race householders$111,806 Two or more races householders$80,250 Hispanic or Latino householders
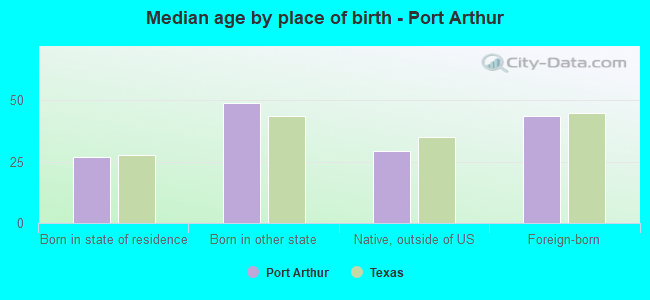
Median age by race in Port Arthur
39.1 Median age for White residents38.7 39.4 32.7 Median age for Black or African American residents28.7 35.4 24.2 Median age for American Indian / Alaska Native residents19.2 25.5 41.2 Median age for Asian residents43.2 39.9 18.1 Median age for Native Hawaiian / Pacific Islander residents-666,666,666.0 -577,777,777.2 27.4 Median age for Other race residents32.7 25.9 28.7 Median age for Two or more races residents28.4 30.1 48.7 Median age for White alone residents50.0 47.6 27.2 Median age for Hispanic or Latino residents27.3 28.1
Owner/renter occupied households by race in Port Arthur
House owners and renters - White residents 3,864 66.8% Owner occupied1,919 33.2% Renter occupiedHouse owners and renters - Black or African American residents 4,832 47.5% Owner occupied5,340 52.5% Renter occupiedHouse owners and renters - American Indian / Alaska Native residents 155 85.1% Owner occupied27 14.9% Renter occupiedHouse owners and renters - Asian residents 797 62.3% Owner occupied481 37.7% Renter occupiedHouse owners and renters - Native Hawaiian / Pacific Islander residents 25 100.0% Renter occupiedHouse owners and renters - Other race residents 1,041 69.9% Owner occupied448 30.1% Renter occupiedHouse owners and renters - Two or more races residents 2,238 66.3% Owner occupied1,139 33.7% Renter occupiedHouse owners and renters - White alone residents 2,820 70.1% Owner occupied1,204 29.9% Renter occupiedHouse owners and renters - Hispanic or Latino residents 3,992 68.7% Owner occupied1,820 31.3% Renter occupied
Language usage in Port Arthur
English speakers - Total 64.7% of residents of Port Arthur speak English at home.
29.2% of residents speak Spanish at home 8,047 54.3% Speak English very well6,768 45.7% Speak English less than very well6.1% of residents speak other language at home 1,810 58.1% Speak English very well1,307 41.9% Speak English less than very well
English speakers - Born in the United States 84.6% of residents of Port Arthur speak English at home.
11.3% of residents speak Spanish at home 840 93.9% Speak English very well55 6.1% Speak English less than very well4.4% of residents speak other language at home 306 87.4% Speak English very well44 12.6% Speak English less than very well
English speakers - Native, born elsewhere 34.7% of residents of Port Arthur speak English at home.
88.2% of residents speak Spanish at home 90 16.3% Speak English very well462 83.7% Speak English less than very well0.8% of residents speak other language at home 5 100.0% Speak English very well
English speakers - Foreign-born 8.3% of residents of Port Arthur speak English at home.
68.2% of residents speak Spanish at home 2,137 28.3% Speak English very well5,423 71.7% Speak English less than very well22.9% of residents speak other language at home 1,150 45.3% Speak English very well1,387 54.7% Speak English less than very well
White (Caucasian) - Speak only English Native:
77.4% (8,215)Foreign-born:
5.0% (93)
White (Caucasian) - Speak another language Native:
16.0% (1,701)Foreign-born:
84.8% (1,570)
Black or African American - Speak only English Native:
99.2% (22,005)Foreign-born:
55.0% (47)
Black or African American - Speak another language Native:
0.8% (186)Foreign-born:
41.3% (35)
American Indian / Alaska Native - Speak only English Native:
50.6% (164)Foreign-born:
36.0% (140)
American Indian / Alaska Native - Speak another language Native:
49.4% (161)Foreign-born:
68.5% (267)
Asian - Speak only English Native:
28.7% (198)Foreign-born:
15.4% (423)
Asian - Speak another language Native:
70.8% (490)Foreign-born:
84.7% (2,319)
Other race - Speak only English Native:
14.8% (303)Foreign-born:
8.3% (225)
Other race - Speak another language Native:
87.0% (1,782)Foreign-born:
91.7% (2,476)
Two or more races - Speak only English Native:
31.1% (1,837)Foreign-born:
7.8% (281)
Two or more races - Speak another language Native:
68.1% (4,025)Foreign-born:
91.6% (3,298)
White alone - Speak only English Native:
98.0% (7,852)Foreign-born:
16.0% (62)
White alone - Speak another language Native:
1.8% (143)Foreign-born:
92.8% (358)
Hispanic or Latino - Speak only English Native:
22.7% (2,136)Foreign-born:
7.1% (562)
Hispanic or Latino - Speak another language Native:
75.6% (7,108)Foreign-born:
93.0% (7,361)
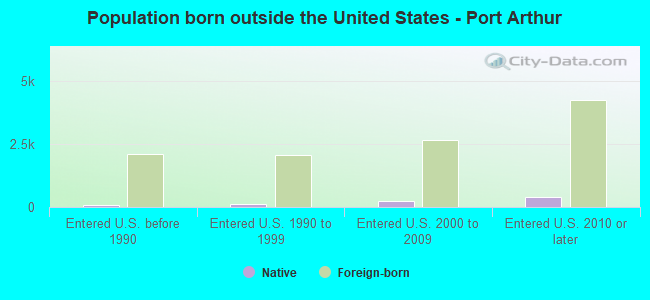
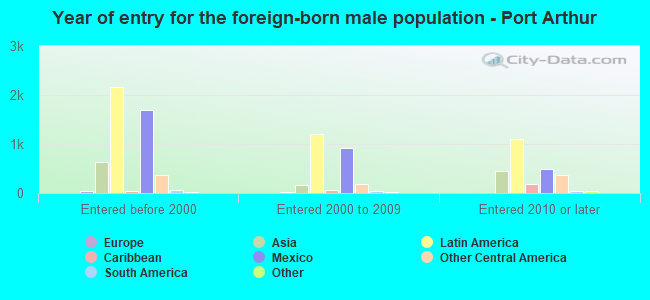
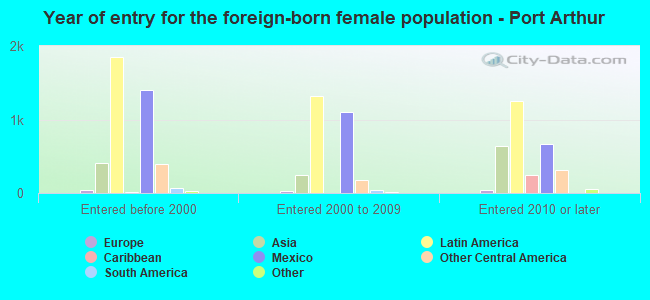
Foreign-born residents in Port Arthur 11,879 residents are foreign born (15.6% Latin America , 4.3% Asia ).
This city:
21.6%Texas:
17.1%
Marital status for residents in Port Arthur Marital status - White (Caucasian) population 15 years and over
Males 30.0% Never married52.7% Now married1.6% Separated4.9% Widowed10.9% DivorcedFemales 28.1% Never married47.4% Now married2.4% Separated8.4% Widowed13.7% DivorcedWomen who gave birth in the past 12 months Now married:
65.7% (91)Unmarried:
34.3% (47)
Women who did not give birth in the past 12 months Now married:
46.8% (1,491)Unmarried:
53.2% (1,692)
Marital status - Black or African American population 15 years and over
Males 54.3% Never married26.9% Now married4.9% Separated4.3% Widowed9.5% DivorcedFemales 50.1% Never married22.4% Now married1.8% Separated10.6% Widowed15.2% DivorcedWomen who gave birth in the past 12 months Now married:
40.6% (83)Unmarried:
59.4% (121)
Women who did not give birth in the past 12 months Now married:
15.2% (742)Unmarried:
84.8% (4,130)
Marital status - American Indian / Alaska Native population 15 years and over
Males 60.7% Never married33.7% Now married0.0% Separated5.6% Widowed0.0% DivorcedFemales 42.2% Never married42.2% Now married0.0% Separated4.3% Widowed11.2% DivorcedWomen who did not give birth in the past 12 months Now married:
45.9% (98)Unmarried:
54.1% (115)
Marital status - Asian population 15 years and over
Males 45.2% Never married50.0% Now married0.4% Separated2.5% Widowed1.8% DivorcedFemales 33.5% Never married55.5% Now married0.3% Separated8.7% Widowed1.9% DivorcedWomen who gave birth in the past 12 months Now married:
0.0% (0)Unmarried:
100.0% (9)
Women who did not give birth in the past 12 months Now married:
50.5% (451)Unmarried:
49.5% (442)
Marital status - Native Hawaiian / Pacific Islander population 15 years and over
Males 0.0% Never married100.0% Now married0.0% Separated0.0% Widowed0.0% DivorcedFemales 66.7% Never married33.3% Now married0.0% Separated0.0% Widowed0.0% DivorcedWomen who did not give birth in the past 12 months Now married:
0.0% (0)Unmarried:
100.0% (36)
Marital status - Other race population 15 years and over
Males 39.3% Never married43.4% Now married7.8% Separated1.4% Widowed8.1% DivorcedFemales 25.9% Never married38.1% Now married13.2% Separated6.1% Widowed16.7% DivorcedWomen who gave birth in the past 12 months Now married:
100.0% (9)Unmarried:
0.0% (0)
Women who did not give birth in the past 12 months Now married:
48.0% (541)Unmarried:
52.0% (586)
Marital status - Two or more races population 15 years and over
Males 33.8% Never married50.8% Now married2.2% Separated0.9% Widowed12.3% DivorcedFemales 31.4% Never married48.5% Now married7.5% Separated6.6% Widowed6.0% DivorcedWomen who gave birth in the past 12 months Now married:
67.9% (135)Unmarried:
32.1% (64)
Women who did not give birth in the past 12 months Now married:
55.3% (1,416)Unmarried:
44.7% (1,145)
Marital status - White alone, not Hispanic / Latino population 15 years and over
Males 22.2% Never married52.8% Now married1.3% Separated8.0% Widowed15.7% DivorcedFemales 22.5% Never married45.9% Now married1.6% Separated11.7% Widowed18.3% DivorcedWomen who gave birth in the past 12 months Now married:
100.0% (33)Unmarried:
0.0% (0)
Women who did not give birth in the past 12 months Now married:
39.3% (703)Unmarried:
60.7% (1,088)
Marital status - Hispanic or Latino population 15 years and over
Males 38.5% Never married49.5% Now married3.2% Separated1.1% Widowed7.8% DivorcedFemales 32.6% Never married48.8% Now married5.1% Separated5.1% Widowed8.4% DivorcedWomen who gave birth in the past 12 months Now married:
63.0% (182)Unmarried:
37.0% (107)
Women who did not give birth in the past 12 months Now married:
53.3% (2,458)Unmarried:
46.7% (2,151)
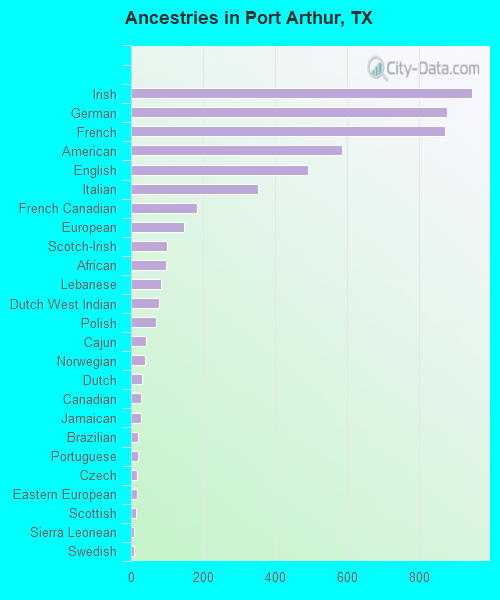
Ancestries in Port Arthur
946 2.1% Irish878 2.0% German872 2.0% French585 1.3% American492 1.1% English353 0.8% Italian183 0.4% French Canadian146 0.3% European101 0.2% Scotch-Irish98 0.2% African82 0.2% Lebanese78 0.2% Dutch West Indian69 0.2% Polish41 0.09% Cajun38 0.09% Norwegian30 0.07% Dutch29 0.07% Canadian27 0.06% Jamaican20 0.05% Brazilian19 0.04% Portuguese18 0.04% Czech16 0.04% Eastern European14 0.03% Scottish9 0.02% Sierra Leonean9 0.02% Swedish7 0.02% British7 0.02% Danish5 0.01% Iranian5 0.01% Welsh
Geographical mobility in Port Arthur Same house 1 year ago 12,325 87.3% White (Caucasian)21,962 94.4% Black or African American635 93.4% American Indian / Alaska Native3,209 86.3% Asian115 98.2% Native Hawaiian / Pacific Islander4,092 86.4% Other race9,443 91.1% Two or more races7,667 87.5% White alone, not Hispanic / Latino16,904 88.3% Hispanic or LatinoMoved within same county 923 6.5% White / Caucasian1,123 4.8% Black or African American50 7.4% American Indian / Alaska Native233 6.3% Asian398 8.4% Other race594 5.7% Two or more races602 6.9% White alone, not Hispanic / Latino1,712 8.9% Hispanic or LatinoMoved within same state 510 3.6% White / Caucasian218 0.9% Black or African American14 0.4% Asian55 1.2% Other race109 1.0% Two or more races398 4.5% White alone, not Hispanic / Latino261 1.4% Hispanic or LatinoMoved from different state 167 1.2% White / Caucasian5 0.0% Black or African American17 0.5% Asian19 0.4% Other race113 1.1% Two or more races74 0.8% White alone, not Hispanic / Latino141 0.7% Hispanic or LatinoMoved from abroad 29 0.2% White7 0.0% Black or African American225 6.0% Asian188 4.0% Other race9 0.1% Two or more races210 1.1% Hispanic or Latino
Children Nativity (place of birth) in Port Arthur
Children under 6 years - Living with two parents Both parents native 726 100.0% NativeBoth parents foreign-born 370 83.3% Native74 16.7% Foreign-bornOne native, one foreign-born parent 367 100.0% NativeChildren under 6 years - Living with one parent Native parent 3,291 99.8% Native5 0.2% Foreign-bornForeign-born parent 290 94.6% Native17 5.4% Foreign-bornChildren 6 to 17 years - Living with two parents Both parents native 1,406 100.0% NativeBoth parents foreign-born 1,564 57.6% Native1,152 42.4% Foreign-bornOne native, one foreign-born parent 377 66.8% Native187 33.2% Foreign-bornChildren 6 to 17 years - Living with one parent Native parent 4,237 100.0% NativeForeign-born parent 882 54.8% Native726 45.2% Foreign-born
Grandparents responsible for own grandchildren in Port Arthur
Grandparents (30 to 59 years) White / Caucasian 47 92.0% Responsible for grandchildren4 8.0% Not responsible for grandchildrenBlack or African American 147 64.3% Responsible for grandchildren82 35.7% Not responsible for grandchildrenAmerican Indian / Alaska Native 28 100.0% Responsible for grandchildrenAsian 3 100.0% Not responsible for grandchildrenOther race 100 86.8% Responsible for grandchildren15 13.2% Not responsible for grandchildrenTwo or more races 33 16.3% Responsible for grandchildren167 83.7% Not responsible for grandchildrenWhite alone, not Hispanic / Latino 22 100.0% Responsible for grandchildrenHispanic or Latino 159 57.8% Responsible for grandchildren116 42.2% Not responsible for grandchildrenGrandparents (60 years and over) White / Caucasian 59 66.2% Responsible for grandchildren30 33.8% Not responsible for grandchildrenBlack or African American 199 51.4% Responsible for grandchildren189 48.6% Not responsible for grandchildrenAsian 13 100.0% Not responsible for grandchildrenOther race 64 45.7% Responsible for grandchildren76 54.3% Not responsible for grandchildrenTwo or more races 10 3.5% Responsible for grandchildren268 96.5% Not responsible for grandchildrenWhite alone, not Hispanic / Latino 36 79.8% Responsible for grandchildren9 20.2% Not responsible for grandchildrenHispanic or Latino 92 27.4% Responsible for grandchildren245 72.6% Not responsible for grandchildren