Races in Pontiac, Michigan (MI) Detailed Stats
Data:
Races - White alone (%)
Races - White alone (% change since 2000)
Races - Black alone (%)
Races - Black alone (% change since 2000)
Races - American Indian alone (%)
Races - American Indian alone (% change since 2000)
Races - Asian alone (%)
Races - Asian alone (% change since 2000)
Races - Hispanic (%)
Races - Hispanic (% change since 2000)
Races - Native Hawaiian and Other Pacific Islander alone (%)
Races - Native Hawaiian and Other Pacific Islander alone (% change since 2000)
Races - Two or more races(%)
Races - Two or more races(% change since 2000)
Races - Other race alone (%)
Races - Other race alone (% change since 2000)
Racial diversity
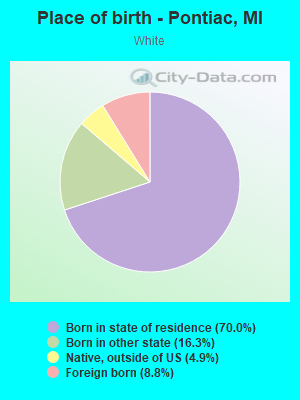
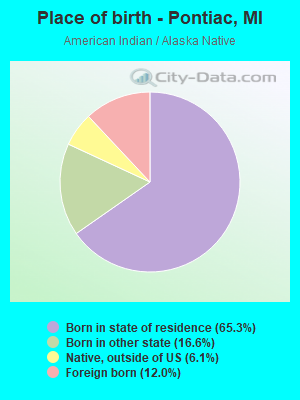
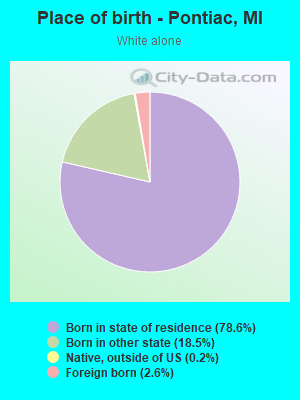
Place of birth - Born in state of residence (%)
Place of birth - Born in state of residence (%) - White
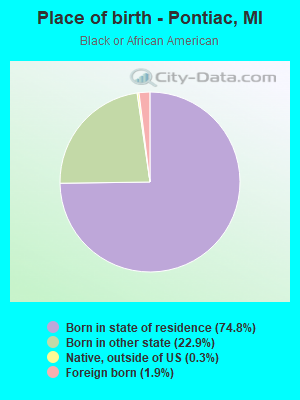
Place of birth - Born in state of residence (%) - Black or African American
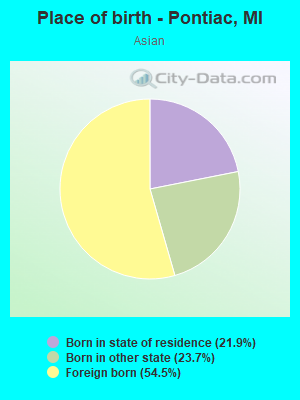
Place of birth - Born in state of residence (%) - Asian
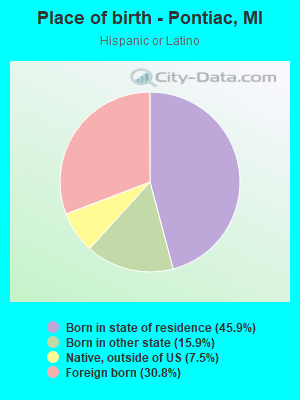
Place of birth - Born in state of residence (%) - Hispanic or Latino
Place of birth - Born in state of residence (%) - American Indian and Alaska Native
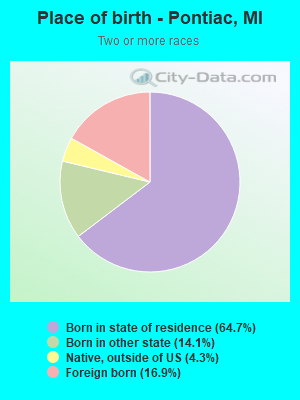
Place of birth - Born in state of residence (%) - Multirace
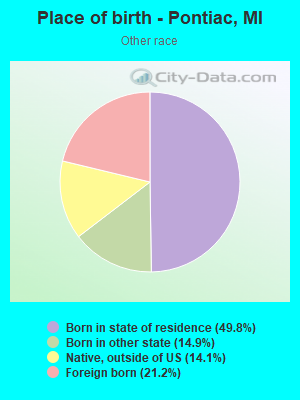
Place of birth - Born in state of residence (%) - Other Race
Place of birth - Born in other state (%)
Place of birth - Born in other state (%) - White
Place of birth - Born in other state (%) - Black or African American
Place of birth - Born in other state (%) - Asian
Place of birth - Born in other state (%) - Hispanic or Latino
Place of birth - Born in other state (%) - American Indian and Alaska Native
Place of birth - Born in other state (%) - Multirace
Place of birth - Born in other state (%) - Other Race
Place of birth - Native, outside of US (%)
Place of birth - Native, outside of US (%) - White
Place of birth - Native, outside of US (%) - Black or African American
Place of birth - Native, outside of US (%) - Asian
Place of birth - Native, outside of US (%) - Hispanic or Latino
Place of birth - Native, outside of US (%) - American Indian and Alaska Native
Place of birth - Native, outside of US (%) - Multirace
Place of birth - Native, outside of US (%) - Other Race
Place of birth - Foreign born (%)
Place of birth - Foreign born (%) - White
Place of birth - Foreign born (%) - Black or African American
Place of birth - Foreign born (%) - Asian
Place of birth - Foreign born (%) - Hispanic or Latino
Place of birth - Foreign born (%) - American Indian and Alaska Native
Place of birth - Foreign born (%) - Multirace
Place of birth - Foreign born (%) - Other Race
Residents speaking English at home (%)
Residents speaking English at home - Born in the United States (%)
Residents speaking English at home - Native, born elsewhere (%)
Residents speaking English at home - Foreign born (%)
Residents speaking Spanish at home (%)
Residents speaking Spanish at home - Born in the United States (%)
Residents speaking Spanish at home - Native, born elsewhere (%)
Residents speaking Spanish at home - Foreign born (%)
Residents speaking other language at home (%)
Residents speaking other language at home - Born in the United States (%)
Residents speaking other language at home - Native, born elsewhere (%)
Residents speaking other language at home - Foreign born (%)
Marital status - Never married (%)
Marital status - Now married (%)
Marital status - Separated (%)
Marital status - Widowed (%)
Marital status - Divorced (%)
Ancestries Reported - Arab (%)
Ancestries Reported - Czech (%)
Ancestries Reported - Danish (%)
Ancestries Reported - Dutch (%)
Ancestries Reported - English (%)
Ancestries Reported - French (%)
Ancestries Reported - French Canadian (%)
Ancestries Reported - German (%)
Ancestries Reported - Greek (%)
Ancestries Reported - Hungarian (%)
Ancestries Reported - Irish (%)
Ancestries Reported - Italian (%)
Ancestries Reported - Lithuanian (%)
Ancestries Reported - Norwegian (%)
Ancestries Reported - Polish (%)
Ancestries Reported - Portuguese (%)
Ancestries Reported - Russian (%)
Ancestries Reported - Scotch-Irish (%)
Ancestries Reported - Scottish (%)
Ancestries Reported - Slovak (%)
Ancestries Reported - Subsaharan African (%)
Ancestries Reported - Swedish (%)
Ancestries Reported - Swiss (%)
Ancestries Reported - Ukrainian (%)
Ancestries Reported - United States (%)
Ancestries Reported - Welsh (%)
Ancestries Reported - West Indian (%)
Ancestries Reported - Other (%)
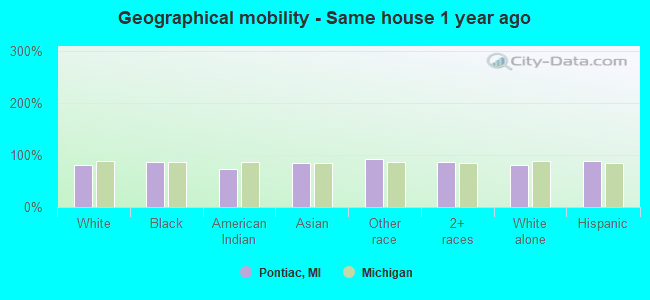
Geographical mobility - Same house 1 year ago (%)
Geographical mobility - Same house 1 year ago (%) - White
Geographical mobility - Same house 1 year ago (%) - Black or African American
Geographical mobility - Same house 1 year ago (%) - Asian
Geographical mobility - Same house 1 year ago (%) - Hispanic or Latino
Geographical mobility - Same house 1 year ago (%) - American Indian and Alaska Native
Geographical mobility - Same house 1 year ago (%) - Multirace
Geographical mobility - Same house 1 year ago (%) - Other Race
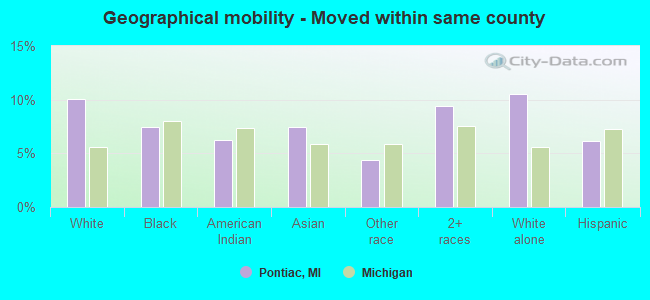
Geographical mobility - Moved within same county (%)
Geographical mobility - Moved within same county (%) - White
Geographical mobility - Moved within same county (%) - Black or African American
Geographical mobility - Moved within same county (%) - Asian
Geographical mobility - Moved within same county (%) - Hispanic or Latino
Geographical mobility - Moved within same county (%) - American Indian and Alaska Native
Geographical mobility - Moved within same county (%) - Multirace
Geographical mobility - Moved within same county (%) - Other Race
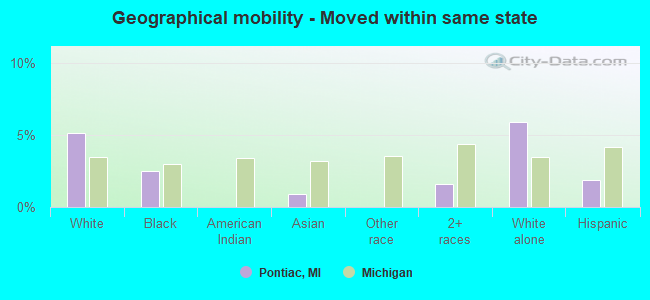
Geographical mobility - Moved from different county within same state (%)
Geographical mobility - Moved from different county within same state (%) - White
Geographical mobility - Moved from different county within same state (%) - Black or African American
Geographical mobility - Moved from different county within same state (%) - Asian
Geographical mobility - Moved from different county within same state (%) - Hispanic or Latino
Geographical mobility - Moved from different county within same state (%) - American Indian and Alaska Native
Geographical mobility - Moved from different county within same state (%) - Multirace
Geographical mobility - Moved from different county within same state (%) - Other Race
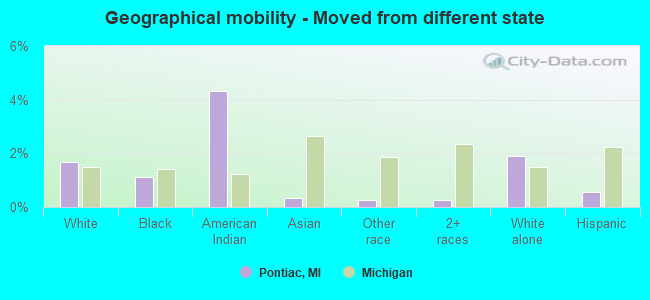
Geographical mobility - Moved from different state (%)
Geographical mobility - Moved from different state (%) - White
Geographical mobility - Moved from different state (%) - Black or African American
Geographical mobility - Moved from different state (%) - Asian
Geographical mobility - Moved from different state (%) - Hispanic or Latino
Geographical mobility - Moved from different state (%) - American Indian and Alaska Native
Geographical mobility - Moved from different state (%) - Multirace
Geographical mobility - Moved from different state (%) - Other Race
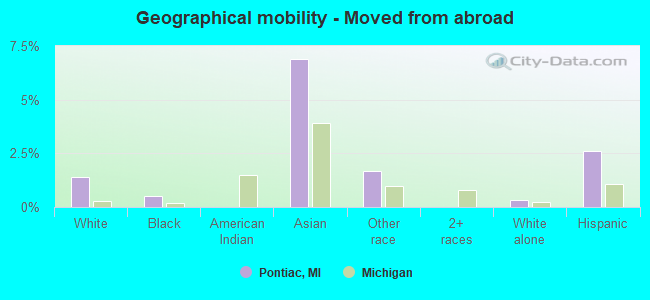
Geographical mobility - Moved from abroad (%)
Geographical mobility - Moved from abroad (%) - White
Geographical mobility - Moved from abroad (%) - Black or African American
Geographical mobility - Moved from abroad (%) - Asian
Geographical mobility - Moved from abroad (%) - Hispanic or Latino
Geographical mobility - Moved from abroad (%) - American Indian and Alaska Native
Geographical mobility - Moved from abroad (%) - Multirace
Geographical mobility - Moved from abroad (%) - Other Race
Place of birth for the foreign-born population - Ireland (%)
Place of birth for the foreign-born population - Denmark (%)
Place of birth for the foreign-born population - Norway (%)
Place of birth for the foreign-born population - Sweden (%)
Place of birth for the foreign-born population - United Kingdom (%)
Place of birth for the foreign-born population - England (%)
Place of birth for the foreign-born population - Scotland (%)
Place of birth for the foreign-born population - Other Northern Europe (%)
Place of birth for the foreign-born population - Austria (%)
Place of birth for the foreign-born population - Belgium (%)
Place of birth for the foreign-born population - France (%)
Place of birth for the foreign-born population - Germany (%)
Place of birth for the foreign-born population - Netherlands (%)
Place of birth for the foreign-born population - Switzerland (%)
Place of birth for the foreign-born population - Other Western Europe (%)
Place of birth for the foreign-born population - Greece (%)
Place of birth for the foreign-born population - Italy (%)
Place of birth for the foreign-born population - Portugal (%)
Place of birth for the foreign-born population - Spain (%)
Place of birth for the foreign-born population - Other Southern Europe (%)
Place of birth for the foreign-born population - Albania (%)
Place of birth for the foreign-born population - Belarus (%)
Place of birth for the foreign-born population - Bosnia and Herzegovina (%)
Place of birth for the foreign-born population - Bulgaria (%)
Place of birth for the foreign-born population - Croatia (%)
Place of birth for the foreign-born population - Czechoslovakia (%)
Place of birth for the foreign-born population - Hungary (%)
Place of birth for the foreign-born population - Latvia (%)
Place of birth for the foreign-born population - Lithuania (%)
Place of birth for the foreign-born population - North Macedonia (Macedonia) (%)
Place of birth for the foreign-born population - Moldova (%)
Place of birth for the foreign-born population - Poland (%)
Place of birth for the foreign-born population - Romania (%)
Place of birth for the foreign-born population - Russia (%)
Place of birth for the foreign-born population - Serbia (%)
Place of birth for the foreign-born population - Ukraine (%)
Place of birth for the foreign-born population - Other Eastern Europe (%)
Place of birth for the foreign-born population - China (%)
Place of birth for the foreign-born population - Hong Kong (%)
Place of birth for the foreign-born population - Taiwan (%)
Place of birth for the foreign-born population - Japan (%)
Place of birth for the foreign-born population - Korea (%)
Place of birth for the foreign-born population - Other Eastern Asia (%)
Place of birth for the foreign-born population - Afghanistan (%)
Place of birth for the foreign-born population - Bangladesh (%)
Place of birth for the foreign-born population - India (%)
Place of birth for the foreign-born population - Iran (%)
Place of birth for the foreign-born population - Kazakhstan (%)
Place of birth for the foreign-born population - Nepal (%)
Place of birth for the foreign-born population - Pakistan (%)
Place of birth for the foreign-born population - Sri Lanka (%)
Place of birth for the foreign-born population - Uzbekistan (%)
Place of birth for the foreign-born population - Other South Central Asia (%)
Place of birth for the foreign-born population - Burma (%)
Place of birth for the foreign-born population - Cambodia (%)
Place of birth for the foreign-born population - Indonesia (%)
Place of birth for the foreign-born population - Laos (%)
Place of birth for the foreign-born population - Malaysia (%)
Place of birth for the foreign-born population - Philippines (%)
Place of birth for the foreign-born population - Singapore (%)
Place of birth for the foreign-born population - Thailand (%)
Place of birth for the foreign-born population - Vietnam (%)
Place of birth for the foreign-born population - Other South Eastern Asia (%)
Place of birth for the foreign-born population - Armenia (%)
Place of birth for the foreign-born population - Iraq (%)
Place of birth for the foreign-born population - Israel (%)
Place of birth for the foreign-born population - Jordan (%)
Place of birth for the foreign-born population - Kuwait (%)
Place of birth for the foreign-born population - Lebanon (%)
Place of birth for the foreign-born population - Saudi Arabia (%)
Place of birth for the foreign-born population - Syria (%)
Place of birth for the foreign-born population - Turkey (%)
Place of birth for the foreign-born population - Yemen (%)
Place of birth for the foreign-born population - Other Western Asia (%)
Place of birth for the foreign-born population - Eritrea (%)
Place of birth for the foreign-born population - Ethiopia (%)
Place of birth for the foreign-born population - Kenya (%)
Place of birth for the foreign-born population - Somalia (%)
Place of birth for the foreign-born population - Uganda (%)
Place of birth for the foreign-born population - Zimbabwe (%)
Place of birth for the foreign-born population - Other Eastern Africa (%)
Place of birth for the foreign-born population - Cameroon (%)
Place of birth for the foreign-born population - Congo (%)
Place of birth for the foreign-born population - Democratic Republic of Congo (Zaire) (%)
Place of birth for the foreign-born population - Other Middle Africa (%)
Place of birth for the foreign-born population - Egypt (%)
Place of birth for the foreign-born population - Morocco (%)
Place of birth for the foreign-born population - Sudan (%)
Place of birth for the foreign-born population - Other Northern Africa (%)
Place of birth for the foreign-born population - South Africa (%)
Place of birth for the foreign-born population - Other Southern Africa (%)
Place of birth for the foreign-born population - Cabo Verde (%)
Place of birth for the foreign-born population - Ghana (%)
Place of birth for the foreign-born population - Liberia (%)
Place of birth for the foreign-born population - Nigeria (%)
Place of birth for the foreign-born population - Senegal (%)
Place of birth for the foreign-born population - Sierra Leone (%)
Place of birth for the foreign-born population - Other Western Africa (%)
Place of birth for the foreign-born population - Australia (%)
Place of birth for the foreign-born population - New Zealand (%)
Place of birth for the foreign-born population - Fiji (%)
Place of birth for the foreign-born population - Micronesia (%)
Place of birth for the foreign-born population - Bahamas (%)
Place of birth for the foreign-born population - Barbados (%)
Place of birth for the foreign-born population - Cuba (%)
Place of birth for the foreign-born population - Dominica (%)
Place of birth for the foreign-born population - Dominican Republic (%)
Place of birth for the foreign-born population - Grenada (%)
Place of birth for the foreign-born population - Haiti (%)
Place of birth for the foreign-born population - Jamaica (%)
Place of birth for the foreign-born population - St. Vincent and the Grenadines (%)
Place of birth for the foreign-born population - Trinidad and Tobago (%)
Place of birth for the foreign-born population - West Indies (%)
Place of birth for the foreign-born population - Other Caribbean (%)
Place of birth for the foreign-born population - Belize (%)
Place of birth for the foreign-born population - Costa Rica (%)
Place of birth for the foreign-born population - El Salvador (%)
Place of birth for the foreign-born population - Guatemala (%)
Place of birth for the foreign-born population - Honduras (%)
Place of birth for the foreign-born population - Mexico (%)
Place of birth for the foreign-born population - Nicaragua (%)
Place of birth for the foreign-born population - Panama (%)
Place of birth for the foreign-born population - Other Central America (%)
Place of birth for the foreign-born population - Argentina (%)
Place of birth for the foreign-born population - Bolivia (%)
Place of birth for the foreign-born population - Brazil (%)
Place of birth for the foreign-born population - Chile (%)
Place of birth for the foreign-born population - Colombia (%)
Place of birth for the foreign-born population - Ecuador (%)
Place of birth for the foreign-born population - Guyana (%)
Place of birth for the foreign-born population - Peru (%)
Place of birth for the foreign-born population - Uruguay (%)
Place of birth for the foreign-born population - Venezuela (%)
Place of birth for the foreign-born population - Other South America (%)
Place of birth for the foreign-born population - Canada (%)
Place of birth for the foreign-born population - Other Northern America (%)
Place of birth for the foreign-born population - Other (%)
Latest news about races in Pontiac, MI collected exclusively by city-data.com from local newspapers, TV, and radio stations
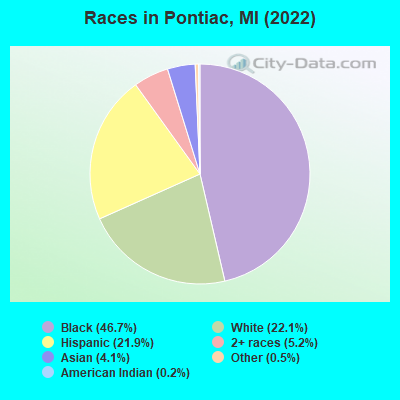
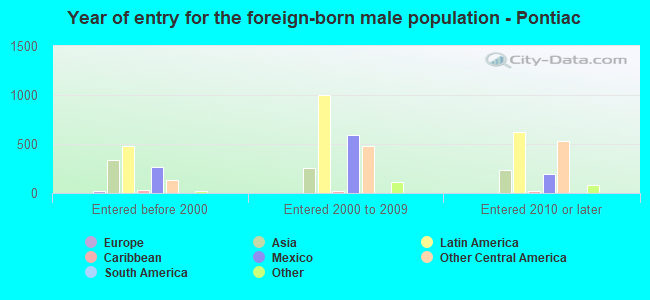
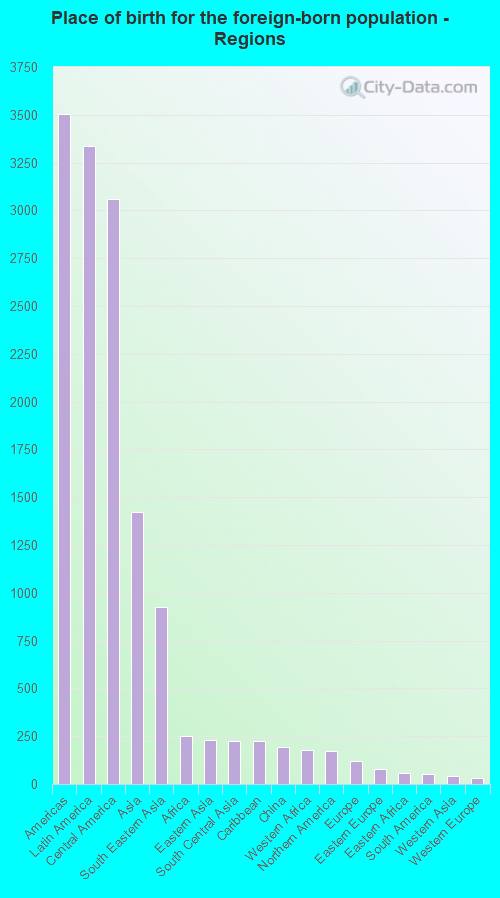
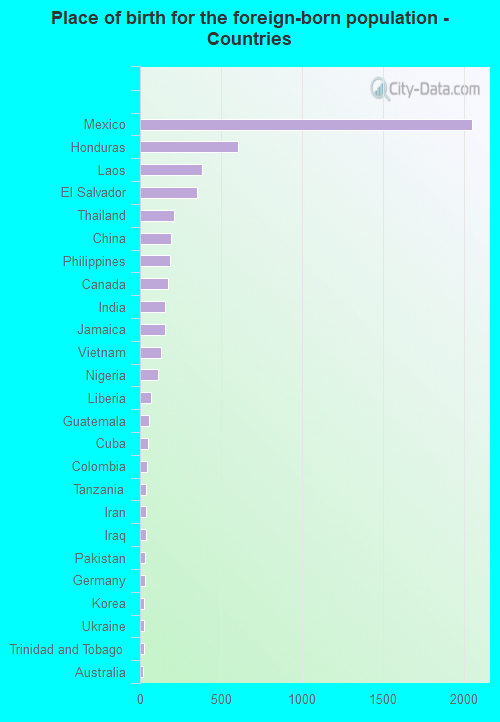
According to 2022 data, the most numerous races in Pontiac, MI are White alone (13,634 residents), Black alone (28,864 residents), and Hispanic (13,550 residents). 79.7% of Pontiac residents speak English at home. 8.6% of Pontiac, MI residents are foreign-born (5.4% born in Latin America, 2.3% born in Asia), which is 30.3% greater than the foreign-born rate of 6.0% across the entire state of Michigan.
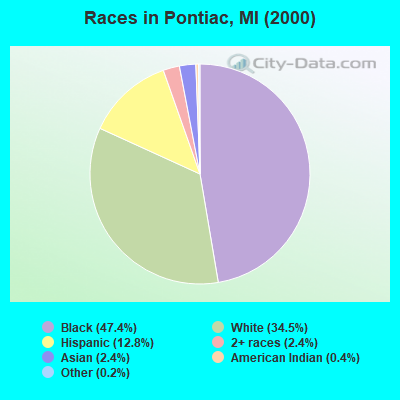
Race distribution in Pontiac
2000 2022
31,416 47.4% Black alone 22,875 34.5% White alone 8,463 12.8% Hispanic 1,611 2.4% Two or more races 1,576 2.4% Asian alone 275 0.4% American Indian alone 109 0.2% Other race alone 12 0.02% Native Hawaiian and Other
28,864 46.7% Black alone 13,634 22.1% White alone 13,550 21.9% Hispanic 3,190 5.2% Two or more races 2,545 4.1% Asian alone 302 0.5% Other race alone 117 0.2% American Indian alone
2000 2022
7,806,691 78.6% White alone 1,402,047 14.1% Black alone 323,877 3.3% Hispanic 175,311 1.8% Asian alone 163,487 1.6% Two or more races 53,421 0.5% American Indian alone 11,465 0.1% Other race alone 2,145 0.02% Native Hawaiian and Other
7,289,051 72.6% White alone 1,310,464 13.1% Black alone 572,405 5.7% Hispanic 450,031 4.5% Two or more races 335,732 3.3% Asian alone 45,217 0.5% Other race alone 29,011 0.3% American Indian alone 2,207 0.02% Native Hawaiian and Other
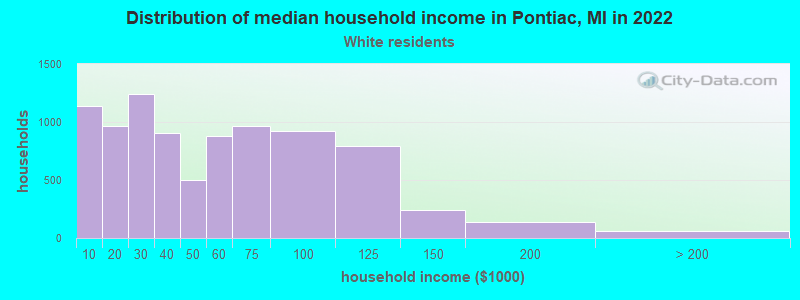
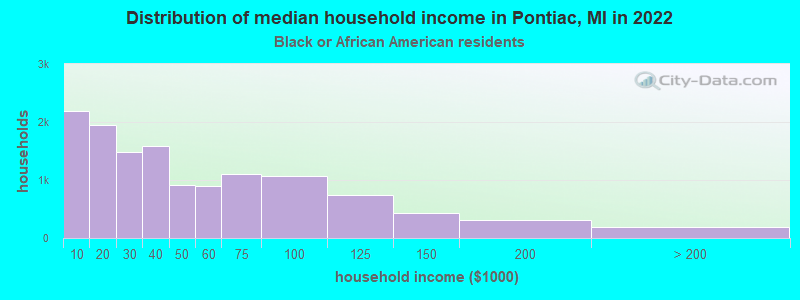
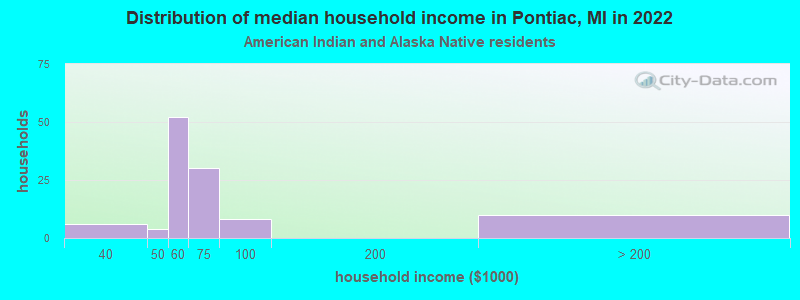
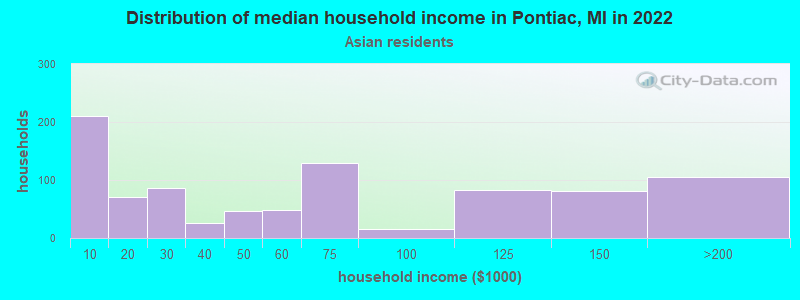
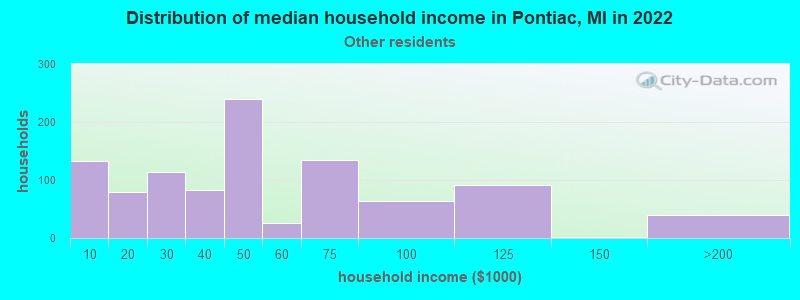
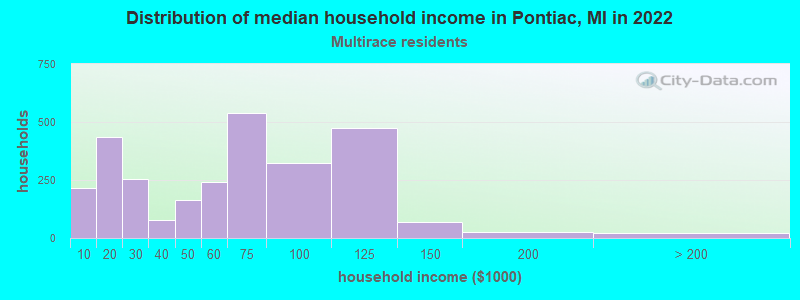
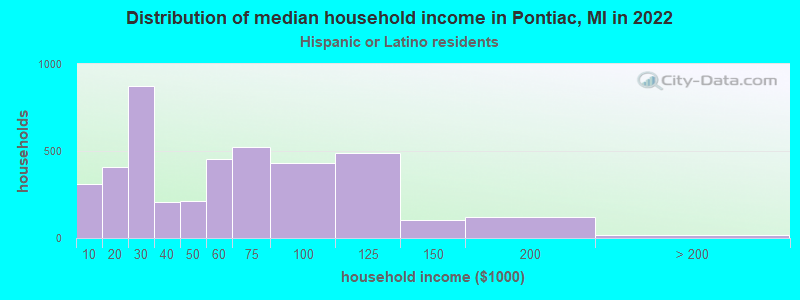
Income and house value in Pontiac Median household income in 2022 $44,938 White non-Hispanic householders$37,145 Black householders$97,393 American Indian and Alaska Native householders$65,254 Asian householders$46,856 Some other race householders$56,820 Two or more races householders$47,909 Hispanic or Latino race householdersMedian 2022 house value $113,974 White Non-Hispanic householders$107,568 Black or African American householders$93,861 American Indian or Alaska Native householders $144,368 Asian householders$104,290 Some other race householders$95,351 Two or more races householders$101,906 Hispanic or Latino householders
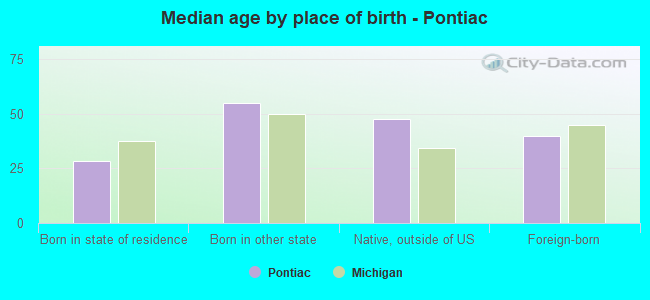
Median age by race in Pontiac
40.0 Median age for White residents39.6 40.4 36.2 Median age for Black or African American residents33.8 38.9 48.6 Median age for American Indian / Alaska Native residents34.2 51.5 30.5 Median age for Asian residents31.1 30.0 -670,531,400.3 Median age for Native Hawaiian / Pacific Islander residents-674,772,035.8 -699,588,476.7 31.2 Median age for Other race residents33.6 27.0 22.0 Median age for Two or more races residents22.5 22.1 45.5 Median age for White alone residents45.7 44.6 26.4 Median age for Hispanic or Latino residents26.0 28.0
Owner/renter occupied households by race in Pontiac
House owners and renters - White residents 4,430 52.3% Owner occupied4,040 47.7% Renter occupiedHouse owners and renters - Black or African American residents 4,846 37.5% Owner occupied8,074 62.5% Renter occupiedHouse owners and renters - American Indian / Alaska Native residents 72 76.4% Owner occupied22 23.6% Renter occupiedHouse owners and renters - Asian residents 354 41.8% Owner occupied494 58.2% Renter occupiedHouse owners and renters - Other race residents 535 45.1% Owner occupied651 54.9% Renter occupiedHouse owners and renters - Two or more races residents 1,219 44.8% Owner occupied1,501 55.2% Renter occupiedHouse owners and renters - White alone residents 3,545 51.2% Owner occupied3,375 48.8% Renter occupiedHouse owners and renters - Hispanic or Latino residents 1,833 43.0% Owner occupied2,430 57.0% Renter occupied
Language usage in Pontiac
English speakers - Total 79.7% of residents of Pontiac speak English at home.
17.3% of residents speak Spanish at home 5,580 56.1% Speak English very well4,365 43.9% Speak English less than very well4.7% of residents speak other language at home 1,597 59.5% Speak English very well1,085 40.5% Speak English less than very well
English speakers - Born in the United States 86.0% of residents of Pontiac speak English at home.
12.0% of residents speak Spanish at home 942 68.1% Speak English very well441 31.9% Speak English less than very well3.8% of residents speak other language at home 283 65.2% Speak English very well151 34.8% Speak English less than very well
English speakers - Native, born elsewhere 11.6% of residents of Pontiac speak English at home.
79.2% of residents speak Spanish at home 540 41.1% Speak English very well775 58.9% Speak English less than very well0.7% of residents speak other language at home 5 41.7% Speak English very well7 58.3% Speak English less than very well
English speakers - Foreign-born 11.3% of residents of Pontiac speak English at home.
73.9% of residents speak Spanish at home 1,016 25.8% Speak English very well2,917 74.2% Speak English less than very well29.1% of residents speak other language at home 786 50.8% Speak English very well762 49.2% Speak English less than very well
White (Caucasian) - Speak only English Native:
86.6% (13,898)Foreign-born:
14.0% (220)
White (Caucasian) - Speak another language Native:
12.6% (2,029)Foreign-born:
84.3% (1,324)
Black or African American - Speak only English Native:
98.1% (25,841)Foreign-born:
37.8% (216)
Black or African American - Speak another language Native:
1.9% (487)Foreign-born:
53.9% (307)
American Indian / Alaska Native - Speak another language Native:
20.2% (34)Foreign-born:
100.0% (29)
Asian - Speak only English Native:
28.5% (307)Foreign-born:
11.1% (156)
Asian - Speak another language Native:
70.1% (756)Foreign-born:
88.9% (1,254)
Other race - Speak only English Native:
33.6% (841)Foreign-born:
0.9% (6)
Other race - Speak another language Native:
71.5% (1,791)Foreign-born:
100.0% (717)
Two or more races - Speak another language Native:
42.1% (2,895)Foreign-born:
100.0% (1,637)
White alone - Speak only English Native:
97.7% (12,788)Foreign-born:
53.0% (188)
White alone - Speak another language Native:
2.2% (287)Foreign-born:
48.4% (171)
Hispanic or Latino - Speak only English Native:
35.0% (2,881)Foreign-born:
1.1% (45)
Hispanic or Latino - Speak another language Native:
68.2% (5,618)Foreign-born:
100.0% (3,957)
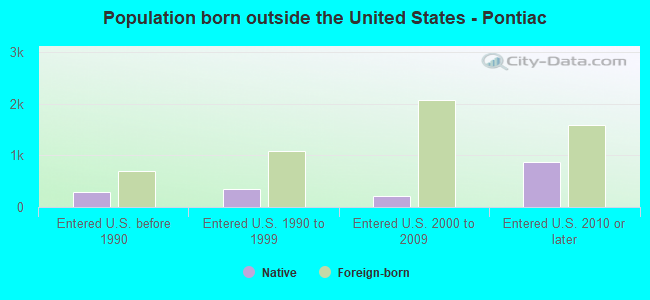
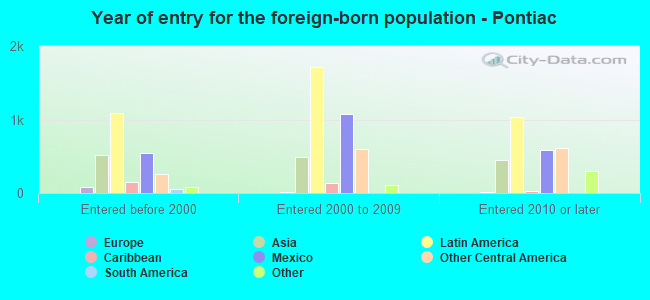
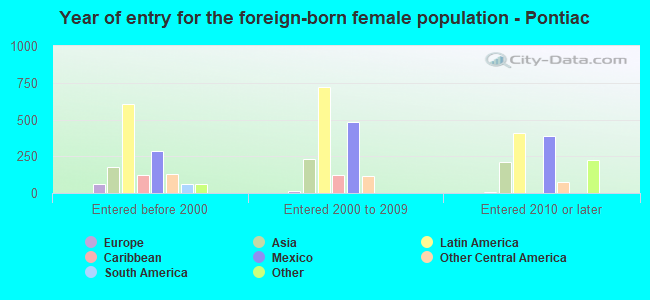
Foreign-born residents in Pontiac 5,322 residents are foreign born (5.4% Latin America , 2.3% Asia ).
This city:
8.6%Michigan:
6.9%
Marital status for residents in Pontiac Marital status - White (Caucasian) population 15 years and over
Males 47.9% Never married31.4% Now married2.9% Separated3.5% Widowed14.3% DivorcedFemales 37.8% Never married32.5% Now married2.3% Separated9.4% Widowed18.0% DivorcedWomen who gave birth in the past 12 months Now married:
17.2% (25)Unmarried:
82.8% (119)
Women who did not give birth in the past 12 months Now married:
32.0% (1,337)Unmarried:
68.0% (2,839)
Marital status - Black or African American population 15 years and over
Males 62.0% Never married20.6% Now married2.2% Separated2.7% Widowed12.5% DivorcedFemales 56.9% Never married13.7% Now married2.0% Separated11.8% Widowed15.6% DivorcedWomen who gave birth in the past 12 months Now married:
8.3% (36)Unmarried:
91.7% (398)
Women who did not give birth in the past 12 months Now married:
13.5% (934)Unmarried:
86.5% (5,994)
Marital status - American Indian / Alaska Native population 15 years and over
Males 44.9% Never married9.6% Now married5.1% Separated6.6% Widowed33.8% DivorcedFemales 35.7% Never married12.5% Now married0.0% Separated32.1% Widowed19.6% DivorcedWomen who did not give birth in the past 12 months Now married:
18.4% (7)Unmarried:
81.6% (32)
Marital status - Asian population 15 years and over
Males 59.1% Never married33.4% Now married3.1% Separated2.5% Widowed1.9% DivorcedFemales 51.5% Never married28.4% Now married4.2% Separated8.0% Widowed7.9% DivorcedWomen who gave birth in the past 12 months Now married:
37.3% (22)Unmarried:
62.7% (37)
Women who did not give birth in the past 12 months Now married:
25.4% (143)Unmarried:
74.6% (422)
Marital status - Other race population 15 years and over
Males 41.3% Never married53.1% Now married0.7% Separated0.0% Widowed4.9% DivorcedFemales 51.5% Never married36.9% Now married0.0% Separated0.0% Widowed11.6% DivorcedWomen who gave birth in the past 12 months Now married:
100.0% (138)Unmarried:
0.0% (0)
Women who did not give birth in the past 12 months Now married:
26.6% (206)Unmarried:
73.4% (571)
Marital status - Two or more races population 15 years and over
Males 54.5% Never married32.7% Now married8.2% Separated1.9% Widowed2.8% DivorcedFemales 54.9% Never married28.0% Now married1.3% Separated2.5% Widowed13.2% DivorcedWomen who gave birth in the past 12 months Now married:
9.7% (20)Unmarried:
90.3% (183)
Women who did not give birth in the past 12 months Now married:
31.0% (836)Unmarried:
69.0% (1,859)
Marital status - White alone, not Hispanic / Latino population 15 years and over
Males 49.2% Never married27.0% Now married3.2% Separated3.2% Widowed17.4% DivorcedFemales 36.3% Never married30.0% Now married2.1% Separated10.3% Widowed21.3% DivorcedWomen who gave birth in the past 12 months Now married:
23.0% (25)Unmarried:
77.0% (84)
Women who did not give birth in the past 12 months Now married:
27.9% (859)Unmarried:
72.1% (2,218)
Marital status - Hispanic or Latino population 15 years and over
Males 47.1% Never married42.9% Now married5.0% Separated2.1% Widowed2.8% DivorcedFemales 49.9% Never married35.7% Now married1.7% Separated3.5% Widowed9.1% DivorcedWomen who gave birth in the past 12 months Now married:
41.6% (102)Unmarried:
58.4% (143)
Women who did not give birth in the past 12 months Now married:
36.0% (1,224)Unmarried:
64.0% (2,174)
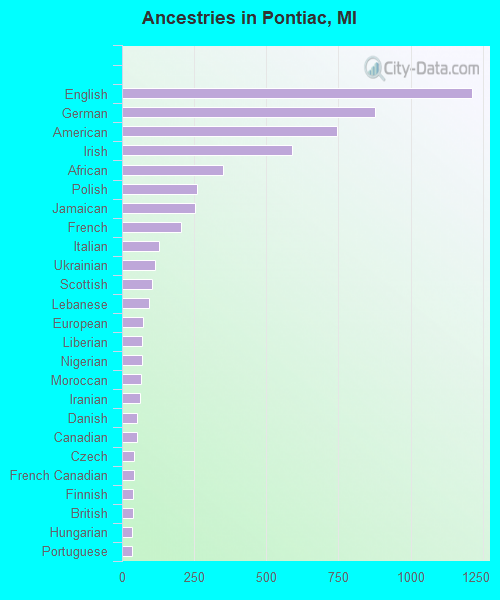
Ancestries in Pontiac
1,211 3.0% English878 2.2% German746 1.8% American590 1.5% Irish349 0.9% African259 0.6% Polish252 0.6% Jamaican203 0.5% French127 0.3% Italian115 0.3% Ukrainian103 0.3% Scottish95 0.2% Lebanese72 0.2% European69 0.2% Liberian68 0.2% Nigerian66 0.2% Moroccan62 0.2% Iranian53 0.1% Danish52 0.1% Canadian43 0.1% Czech40 0.10% French Canadian39 0.10% Finnish37 0.09% British35 0.09% Hungarian34 0.08% Portuguese31 0.08% Iraqi25 0.06% Swedish24 0.06% Austrian24 0.06% Czechoslovakian19 0.05% Pennsylvania German19 0.05% Russian19 0.05% Belgian18 0.04% Albanian17 0.04% Celtic15 0.04% Egyptian14 0.03% Armenian14 0.03% Norwegian10 0.02% Dutch8 0.02% Macedonian8 0.02% Yugoslavian7 0.02% Kenyan6 0.01% Israeli6 0.01% Greek5 0.01% Romanian
Geographical mobility in Pontiac Same house 1 year ago 14,883 81.4% White (Caucasian)25,233 86.7% Black or African American125 74.1% American Indian / Alaska Native2,226 85.7% Asian3,121 92.8% Other race8,438 87.2% Two or more races11,047 81.3% White alone, not Hispanic / Latino11,845 88.7% Hispanic or LatinoMoved within same county 1,848 10.1% White / Caucasian2,164 7.4% Black or African American11 6.3% American Indian / Alaska Native192 7.4% Asian147 4.4% Other race913 9.4% Two or more races1,432 10.5% White alone, not Hispanic / Latino817 6.1% Hispanic or LatinoMoved within same state 941 5.1% White / Caucasian736 2.5% Black or African American23 0.9% Asian155 1.6% Two or more races801 5.9% White alone, not Hispanic / Latino252 1.9% Hispanic or LatinoMoved from different state 304 1.7% White / Caucasian324 1.1% Black or African American7 4.3% American Indian / Alaska Native9 0.3% Asian9 0.3% Other race24 0.3% Two or more races259 1.9% White alone, not Hispanic / Latino73 0.5% Hispanic or LatinoMoved from abroad 253 1.4% White149 0.5% Black or African American179 6.9% Asian57 1.7% Other race41 0.3% White alone, not Hispanic / Latino349 2.6% Hispanic or Latino
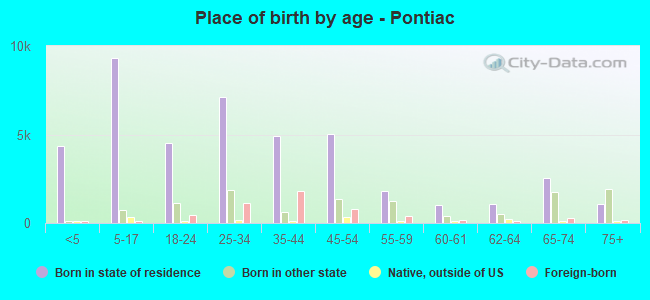
Children Nativity (place of birth) in Pontiac
Children under 6 years - Living with two parents Both parents native 675 100.0% NativeBoth parents foreign-born 357 97.4% Native10 2.6% Foreign-bornOne native, one foreign-born parent 206 97.1% Native6 2.9% Foreign-bornChildren under 6 years - Living with one parent Native parent 3,818 100.0% NativeForeign-born parent 283 87.4% Native41 12.6% Foreign-bornChildren 6 to 17 years - Living with two parents Both parents native 1,721 100.0% NativeBoth parents foreign-born 745 98.5% Native12 1.5% Foreign-bornOne native, one foreign-born parent 373 94.2% Native23 5.8% Foreign-bornChildren 6 to 17 years - Living with one parent Native parent 5,547 100.0% NativeForeign-born parent 947 48.9% Native989 51.1% Foreign-born
Grandparents responsible for own grandchildren in Pontiac
Grandparents (30 to 59 years) White / Caucasian 49 45.2% Responsible for grandchildren60 54.8% Not responsible for grandchildrenBlack or African American 48 11.9% Responsible for grandchildren357 88.1% Not responsible for grandchildrenTwo or more races 6 100.0% Responsible for grandchildrenWhite alone, not Hispanic / Latino 35 100.0% Responsible for grandchildrenHispanic or Latino 18 18.1% Responsible for grandchildren84 81.9% Not responsible for grandchildrenGrandparents (60 years and over) White / Caucasian 50 33.3% Responsible for grandchildren100 66.7% Not responsible for grandchildrenBlack or African American 125 27.9% Responsible for grandchildren323 72.1% Not responsible for grandchildrenTwo or more races 13 8.4% Responsible for grandchildren146 91.6% Not responsible for grandchildrenWhite alone, not Hispanic / Latino 16 15.6% Responsible for grandchildren88 84.4% Not responsible for grandchildrenHispanic or Latino 23 16.1% Responsible for grandchildren121 83.9% Not responsible for grandchildren