Races in Pompano Estates, Florida (FL) Detailed Stats
Ancestries, Foreign-born residents, place of birth

Discuss Pompano Estates, Florida races on our local forum with over 2,400,000 registered users
37.4% of Pompano Estates, FL residents are foreign-born (35.1% born in Latin America), which is 43.9% greater than the foreign-born rate of 21.0% across the entire state of Florida.
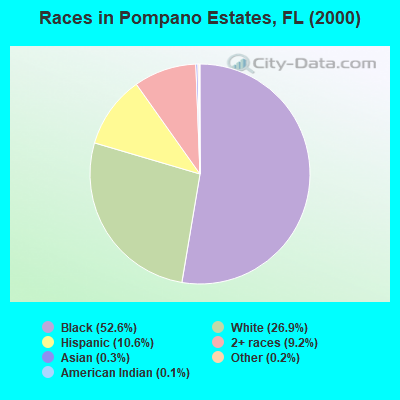
Race distribution in Pompano Estates

- 1,77052.6%Black alone
- 90626.9%White alone
- 35810.6%Hispanic
- 3109.2%Two or more races
- 110.3%Asian alone
- 60.2%Other race alone
- 50.1%American Indian alone
- 10.03%Native Hawaiian and Other
Pacific Islander alone
2000
2022
-
- 10,458,50965.4%White alone
- 2,682,71516.8%Hispanic
- 2,264,26814.2%Black alone
- 261,6931.6%Asian alone
- 236,9541.5%Two or more races
- 42,3580.3%American Indian alone
- 28,9940.2%Other race alone
- 6,8870.04%Native Hawaiian and Other
Pacific Islander alone

-
- 11,309,40350.8%White alone
- 6,025,03927.1%Hispanic
- 3,241,01514.6%Black alone
- 861,6303.9%Two or more races
- 623,6922.8%Asian alone
- 152,0540.7%Other race alone
- 22,5040.1%American Indian alone
- 9,4860.04%Native Hawaiian and Other
Pacific Islander alone

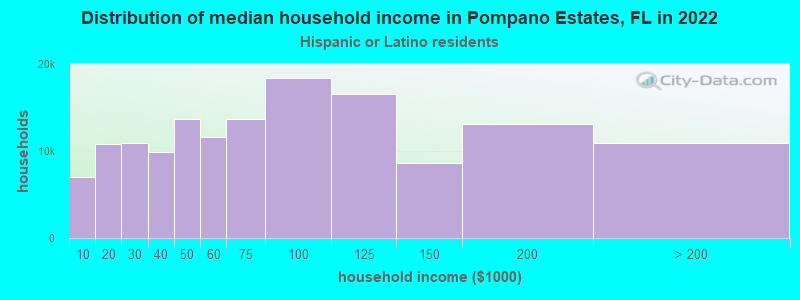
Income and house value in Pompano Estates
- Median household income in 2022
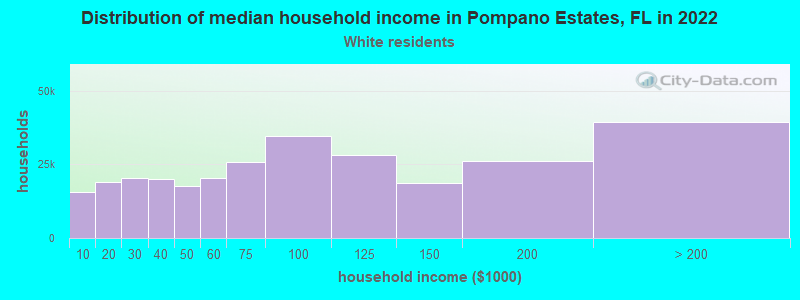
- $87,299White non-Hispanic householders
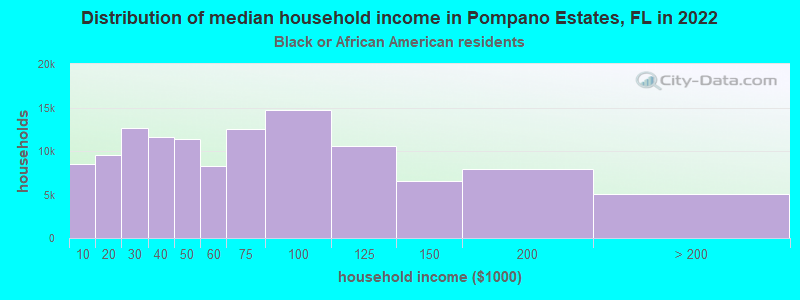
- $36,870Black householders
- $40,561Some other race householders
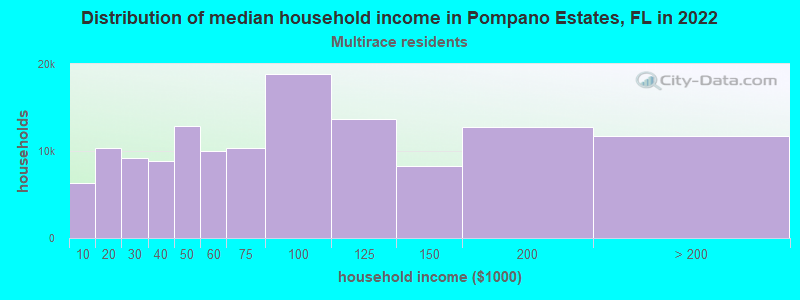
- $59,519Two or more races householders
- $44,609Hispanic or Latino race householders
- Median 2022 house value
- $278,182White Non-Hispanic householders
- $338,723Black or African American householders
- $313,434Two or more races householders
- $355,582Hispanic or Latino householders
Household income for White non-Hispanic householders
Household income for Black householders
Household income for Two or more races householders
Household income for Hispanic or Latino race householders
Foreign-born residents in Pompano Estates
1,260 residents are foreign born (35.1% Latin America).
| This city: | 37.4% |
| Florida: | 16.7% |
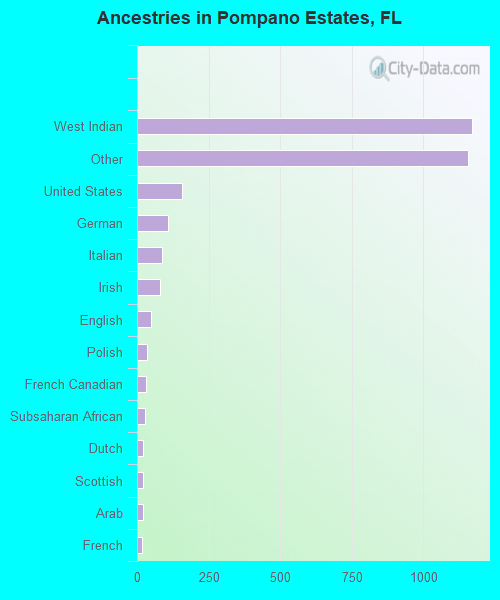
Ancestries in Pompano Estates

- 1,17239.0%West Indian
- 1,15738.5%Other
- 1585.3%United States
- 1103.7%German
- 882.9%Italian
- 812.7%Irish
- 481.6%English
- 361.2%Polish
- 331.1%French Canadian
- 280.9%Subsaharan African
- 210.7%Dutch
- 210.7%Scottish
- 200.7%Arab
- 190.6%French
- 80.3%Hungarian
- 70.2%Norwegian
Zip codes: 33064.