Races in Point Pleasant Beach, New Jersey (NJ) Detailed Stats
Ancestries, Foreign-born residents, place of birth
Settings
X


Recent posts about races in Point Pleasant Beach, New Jersey on our local forum with over 2,400,000 registered users:
 | Considering Moving to New Jersey to Retire. Curious About Red Bank. (48 replies) |
| Best downtowns of NJ (28 replies) |
| Planning a Vacation. Please Help! (66 replies) |
| Monmouth/Ocean County Schools vs. Bergen? (1 reply) |
| Info regarding possibly moving to Point Pleasant Boro (11 replies) |
| Should we buy in Point Pleasant Boro (13 replies) |
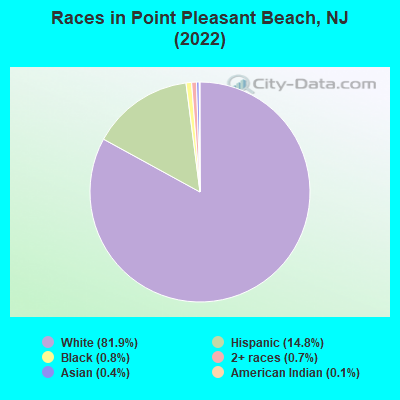
According to 2022 data, the most numerous races in Point Pleasant Beach, NJ are White alone (4,025 residents), Hispanic (726 residents), and Black alone (41 residents). 82.2% of Point Pleasant Beach residents speak English at home. 17.0% of Point Pleasant Beach, NJ residents are foreign-born (11.2% born in Latin America, 5.5% born in Europe), which is 35.7% less than the foreign-born rate of 23.0% across the entire state of New Jersey.
Race distribution in Point Pleasant Beach
2000
2022

- 4,96093.3%White alone
- 2344.4%Hispanic
- 541.0%Asian alone
- 270.5%Black alone
- 290.5%Two or more races
- 90.2%American Indian alone
- 10.02%Native Hawaiian and Other
Pacific Islander alone

-
- 4,02581.9%White alone
- 72614.8%Hispanic
- 410.8%Black alone
- 320.7%Two or more races
- 220.4%Asian alone
- 70.1%American Indian alone
2000
2022
-
- 5,557,20966.0%White alone
- 1,117,19113.3%Hispanic
- 1,096,17113.0%Black alone
- 477,0125.7%Asian alone
- 133,6891.6%Two or more races
- 19,5650.2%Other race alone
- 11,3380.1%American Indian alone
- 2,1750.03%Native Hawaiian and Other
Pacific Islander alone

-
- 4,766,47651.5%White alone
- 2,028,47021.9%Hispanic
- 1,111,63212.0%Black alone
- 923,54610.0%Asian alone
- 332,2373.6%Two or more races
- 89,8471.0%Other race alone
- 8,5570.09%American Indian alone
- 9340.01%Native Hawaiian and Other
Pacific Islander alone

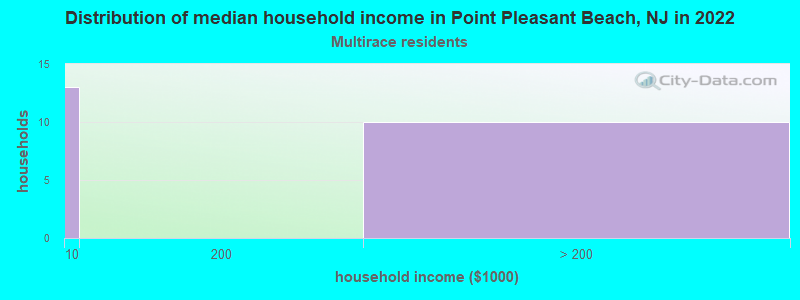
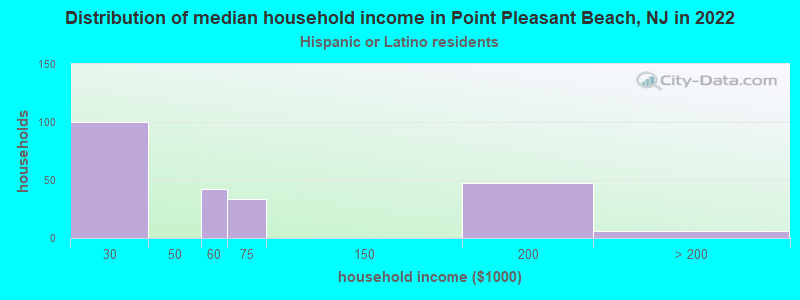
Income and house value in Point Pleasant Beach
- Median household income in 2022
- $127,615White non-Hispanic householders
- $59,020Hispanic or Latino race householders
- Median 2022 house value
- $844,477White Non-Hispanic householders
- over $1,000,000Black or African American householders
- $708,771Some other race householders
- $708,771Two or more races householders
- over $1,000,000Hispanic or Latino householders
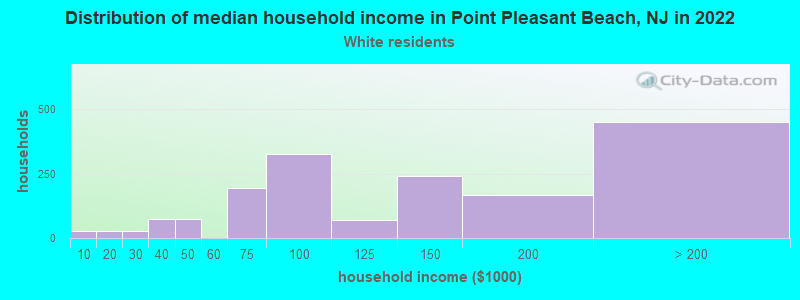
Household income for White non-Hispanic householders
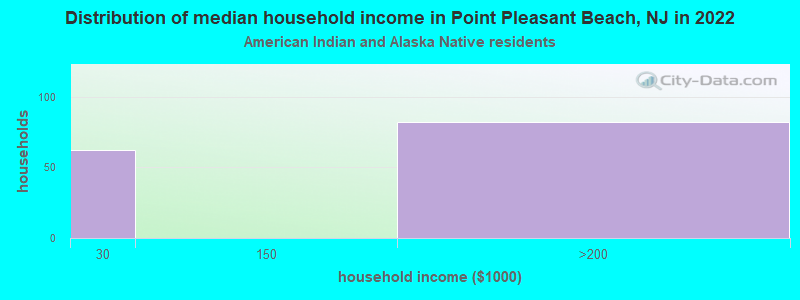
Household income for American Indian and Alaska Native householders
Household income for Asian householders

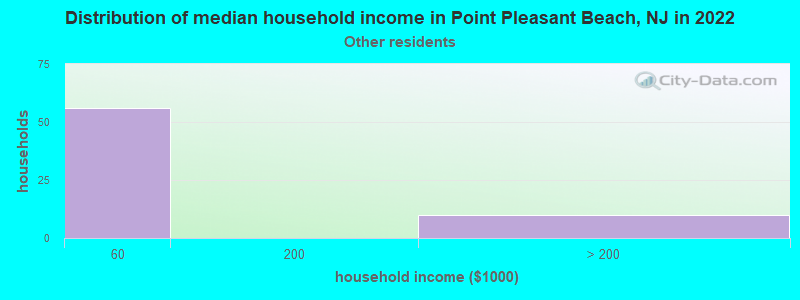
Household income for Some other race householders
Household income for Two or more races householders
Household income for Hispanic or Latino race householders
Median age by race in Point Pleasant Beach
- 50.1Median age for White residents
- 50.0Males
- 49.5Females
- 17.9Median age for Black or African American residents
- -657,060,518.1Males
- -630,303,029.7Females
- 45.7Median age for American Indian / Alaska Native residents
- 36.2Males
- -678,185,744.5Females
- 42.2Median age for Asian residents
- 17.1Males
- -708,604,482.3Females
- -804,177,544.9Median age for Native Hawaiian / Pacific Islander residents
- -860,335,194.7Males
- -713,070,378.3Females
- 24.4Median age for Other race residents
- 21.1Males
- -666,666,666.0Females
- 67.8Median age for Two or more races residents
- -823,529,410.9Males
- 66.9Females
- 50.5Median age for White alone residents
- 51.5Males
- 49.8Females
- 39.6Median age for Hispanic or Latino residents
- 39.7Males
- 36.9Females
Owner/renter occupied households by race in Point Pleasant Beach
- House owners and renters - White residents
- 1,29078.2%Owner occupied
- 36021.8%Renter occupied
- House owners and renters - American Indian / Alaska Native residents
- 189100.0%Renter occupied
- House owners and renters - Asian residents
- 671.0%Owner occupied
- 229.0%Renter occupied
- House owners and renters - Other race residents
- 1216.5%Owner occupied
- 5983.5%Renter occupied
- House owners and renters - Two or more races residents
- 1037.7%Owner occupied
- 1662.3%Renter occupied
- House owners and renters - White alone residents
- 1,30578.9%Owner occupied
- 34821.1%Renter occupied
- House owners and renters - Hispanic or Latino residents
- 84.0%Owner occupied
- 19496.0%Renter occupied
Language usage in Point Pleasant Beach
- English speakers - Total
- 82.2% of residents of Point Pleasant Beach speak English at home.
- 14.5% of residents speak Spanish at home
- 24935.7%Speak English very well
- 44864.3%Speak English less than very well
- 4.3% of residents speak other language at home
- 12761.4%Speak English very well
- 8038.6%Speak English less than very well
- English speakers - Born in the United States
- 96.0% of residents of Point Pleasant Beach speak English at home.
- 4.4% of residents speak other language at home
- 12.4%Speak English very well
- 4097.6%Speak English less than very well
- English speakers - Native, born elsewhere
- 95.1% of residents of Point Pleasant Beach speak English at home.
- English speakers - Foreign-born
- 14.7% of residents of Point Pleasant Beach speak English at home.
- 69.2% of residents speak Spanish at home
- 17330.2%Speak English very well
- 40069.8%Speak English less than very well
- 18.7% of residents speak other language at home
- 10366.5%Speak English very well
- 5233.5%Speak English less than very well
White (Caucasian) - Speak only English
| Native: | 97.3% (3,612) |
| Foreign-born: | 41.2% (111) |
White (Caucasian) - Speak another language
| Native: | 2.9% (109) |
| Foreign-born: | 58.8% (159) |
Black or African American - Speak only English
| Native: | 100.0% (37) |
| Foreign-born: | 100.0% (1) |
Asian - Speak only English
| Native: | 100.0% (9) |
| Foreign-born: | 33.7% (5) |
White alone - Speak only English
| Native: | 98.4% (3,601) |
| Foreign-born: | 45.3% (117) |
White alone - Speak another language
| Native: | 1.6% (59) |
| Foreign-born: | 55.0% (142) |
Hispanic or Latino - Speak another language
| Native: | 55.9% (83) |
| Foreign-born: | 98.6% (573) |
Foreign-born residents in Point Pleasant Beach
833 residents are foreign born (11.2% Latin America, 5.5% Europe).
| This city: | 17.0% |
| New Jersey: | 23.2% |


Marital status for residents in Point Pleasant Beach
Marital status - White (Caucasian) population 15 years and over
- Males
- 34.0%Never married
- 56.0%Now married
- 0.0%Separated
- 1.7%Widowed
- 8.4%Divorced
- Females
- 30.1%Never married
- 51.2%Now married
- 0.0%Separated
- 7.8%Widowed
- 10.9%Divorced
Women who gave birth in the past 12 months
| Now married: | 43.5% (10) |
| Unmarried: | 56.5% (12) |
Women who did not give birth in the past 12 months
| Now married: | 39.2% (327) |
| Unmarried: | 60.8% (506) |
Marital status - Black or African American population 15 years and over
- Males
- 100.0%Never married
- 0.0%Now married
- 0.0%Separated
- 0.0%Widowed
- 0.0%Divorced
- Females
- 0.0%Never married
- 100.0%Now married
- 0.0%Separated
- 0.0%Widowed
- 0.0%Divorced
Marital status - American Indian / Alaska Native population 15 years and over
- Males
- 100.0%Never married
- 0.0%Now married
- 0.0%Separated
- 0.0%Widowed
- 0.0%Divorced
- Females
- 100.0%Never married
- 0.0%Now married
- 0.0%Separated
- 0.0%Widowed
- 0.0%Divorced
Women who did not give birth in the past 12 months
| Now married: | 0.0% (0) |
| Unmarried: | 100.0% (181) |
Marital status - Asian population 15 years and over
- Males
- 0.0%Never married
- 100.0%Now married
- 0.0%Separated
- 0.0%Widowed
- 0.0%Divorced
- Females
- 0.0%Never married
- 40.0%Now married
- 0.0%Separated
- 0.0%Widowed
- 60.0%Divorced
Women who did not give birth in the past 12 months
| Now married: | 100.0% (4) |
| Unmarried: | 0.0% (0) |
Marital status - Other race population 15 years and over
- Males
- 86.6%Never married
- 7.2%Now married
- 0.0%Separated
- 0.0%Widowed
- 6.2%Divorced
- Females
- 0.0%Never married
- 100.0%Now married
- 0.0%Separated
- 0.0%Widowed
- 0.0%Divorced
Women who did not give birth in the past 12 months
| Now married: | 100.0% (11) |
| Unmarried: | 0.0% (0) |
Marital status - Two or more races population 15 years and over
- Males
- 16.7%Never married
- 83.3%Now married
- 0.0%Separated
- 0.0%Widowed
- 0.0%Divorced
- Females
- 79.2%Never married
- 20.8%Now married
- 0.0%Separated
- 0.0%Widowed
- 0.0%Divorced
Women who did not give birth in the past 12 months
| Now married: | 0.0% (0) |
| Unmarried: | 100.0% (14) |
Marital status - White alone, not Hispanic / Latino population 15 years and over
- Males
- 33.7%Never married
- 55.7%Now married
- 0.0%Separated
- 1.8%Widowed
- 8.8%Divorced
- Females
- 30.6%Never married
- 50.4%Now married
- 0.0%Separated
- 7.9%Widowed
- 11.1%Divorced
Women who gave birth in the past 12 months
| Now married: | 43.5% (10) |
| Unmarried: | 56.5% (13) |
Women who did not give birth in the past 12 months
| Now married: | 36.9% (310) |
| Unmarried: | 63.1% (529) |
Marital status - Hispanic or Latino population 15 years and over
- Males
- 84.4%Never married
- 14.3%Now married
- 0.0%Separated
- 0.0%Widowed
- 1.3%Divorced
- Females
- 76.2%Never married
- 23.8%Now married
- 0.0%Separated
- 0.0%Widowed
- 0.0%Divorced
Women who did not give birth in the past 12 months
| Now married: | 23.8% (42) |
| Unmarried: | 76.2% (134) |
Ancestries in Point Pleasant Beach

- 64628.3%Italian
- 37116.3%Irish
- 1205.3%Polish
- 1064.6%Czech
- 994.3%German
- 572.5%Dutch
- 431.9%Slovak
- 371.6%Lithuanian
- 301.3%Scottish
- 221.0%American
- 210.9%English
- 130.6%Hungarian
- 120.5%Austrian
- 120.5%Russian
- 110.5%European
- 90.4%Norwegian
- 80.4%British

Geographical mobility in Point Pleasant Beach

- Same house 1 year ago
- 3,29980.5%White (Caucasian)
- 3074.1%Black or African American
- 56496.6%American Indian / Alaska Native
- 27100.0%Asian
- 3220.3%Other race
- 3674.4%Two or more races
- 3,19579.7%White alone, not Hispanic / Latino
- 63787.6%Hispanic or Latino

-
- Moved within same county
- 1573.8%White / Caucasian
- 1523.8%White alone, not Hispanic / Latino

-
- Moved within same state
- 2175.3%White / Caucasian
- 716.7%Black or African American
- 2415.4%Other race
- 1531.0%Two or more races
- 2325.8%White alone, not Hispanic / Latino
- 395.4%Hispanic or Latino

-
- Moved from different state
- 2506.1%White / Caucasian
- 6139.4%Other race
- 2616.5%White alone, not Hispanic / Latino
- 547.5%Hispanic or Latino

-
- Moved from abroad
- 1624.0%White
- 1894.7%White alone, not Hispanic / Latino

Children Nativity (place of birth) in Point Pleasant Beach
Place of birth for residents in Point Pleasant Beach
![Place of birth for the foreign-born population - Regions]()
- 546Americas
- 546Latin America
- 400Central America
- 267Europe
- 154Eastern Europe
- 138Caribbean
- 89Northern Europe
- 18Western Europe
- 15Asia
- 9South Central Asia
- 8South America
- 6South Eastern Asia
- 5Southern Europe
- 4Africa
- 4Southern Africa

![Place of birth for the foreign-born population - Countries]()
- 368Mexico
- 154Czechoslovakia
- 138Dominican Republic
- 51Ireland
- 33England
- 32Guatemala
- 18Germany
- 9India
- 7Colombia
- 6Philippines
- 5Italy
- 4United Kingdom
- 4South Africa
- 1Guyana

Zip codes: 08742.