Races in Pleasant Valley, Wisconsin (WI) Detailed Stats
Ancestries, Foreign-born residents, place of birth

Discuss Pleasant Valley, Wisconsin races on our local forum with over 2,400,000 registered users
0.5% of Pleasant Valley, WI residents are foreign-born , which is 931.2% less than the foreign-born rate of 5.0% across the entire state of Wisconsin.
Race distribution in Pleasant Valley

- 2,60797.2%White alone
- 341.3%Hispanic
- 291.1%Asian alone
- 70.3%American Indian alone
- 40.1%Two or more races

2000
2022
-
- 4,681,63087.3%White alone
- 300,2455.6%Black alone
- 192,9213.6%Hispanic
- 87,9951.6%Asian alone
- 51,9211.0%Two or more races
- 43,9800.8%American Indian alone
- 3,6370.07%Other race alone
- 1,3460.03%Native Hawaiian and Other
Pacific Islander alone

-
- 4,654,03179.0%White alone
- 447,0227.6%Hispanic
- 345,6785.9%Black alone
- 217,5323.7%Two or more races
- 172,2422.9%Asian alone
- 33,7620.6%American Indian alone
- 19,6800.3%Other race alone
- 2,5920.04%Native Hawaiian and Other
Pacific Islander alone

Income and house value in Pleasant Valley
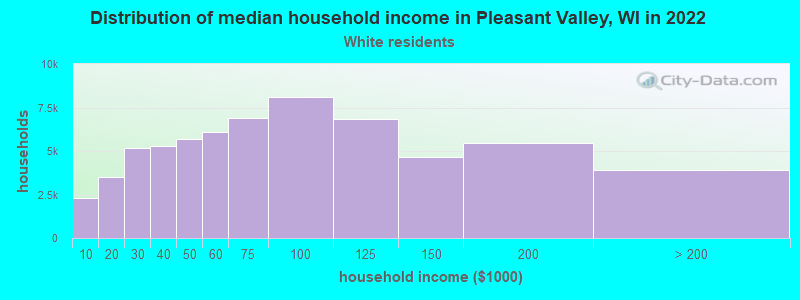
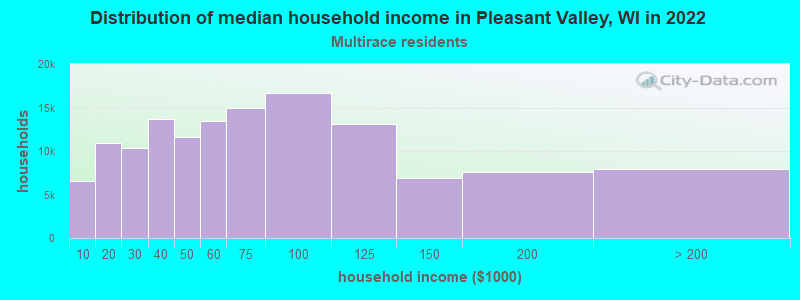
- Median household income in 2022
- $107,277White non-Hispanic householders
- $152,474Two or more races householders
- Median 2022 house value
- $372,900White Non-Hispanic householders
- $479,882Two or more races householders
Household income for White non-Hispanic householders
Household income for Two or more races householders
Foreign-born residents in Pleasant Valley
13 residents are foreign born
| This city: | 0.5% |
| Wisconsin: | 3.6% |
Ancestries in Pleasant Valley

- 1,32235.6%German
- 92925.0%Norwegian
- 3108.3%English
- 2677.2%Irish
- 2035.5%Polish
- 1855.0%French
- 1534.1%Other
- 922.5%Swedish
- 762.0%Czech
- 371.0%Dutch
- 270.7%Swiss
- 230.6%Scotch-Irish
- 230.6%United States
- 210.6%Danish
- 130.3%French Canadian
- 130.3%Hungarian
- 90.2%Italian
- 70.2%Welsh
- 50.1%Greek
- 30.08%Scottish
