Races in Pittsburgh, Pennsylvania (PA) Detailed Stats
Data:
Races - White alone (%)
Races - White alone (% change since 2000)
Races - Black alone (%)
Races - Black alone (% change since 2000)
Races - American Indian alone (%)
Races - American Indian alone (% change since 2000)
Races - Asian alone (%)
Races - Asian alone (% change since 2000)
Races - Hispanic (%)
Races - Hispanic (% change since 2000)
Races - Native Hawaiian and Other Pacific Islander alone (%)
Races - Native Hawaiian and Other Pacific Islander alone (% change since 2000)
Races - Two or more races(%)
Races - Two or more races(% change since 2000)
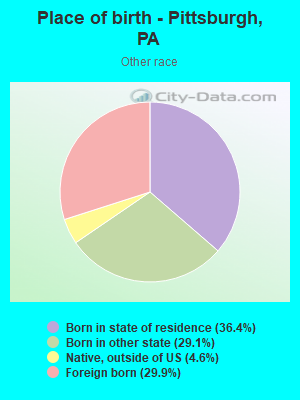
Races - Other race alone (%)
Races - Other race alone (% change since 2000)
Racial diversity
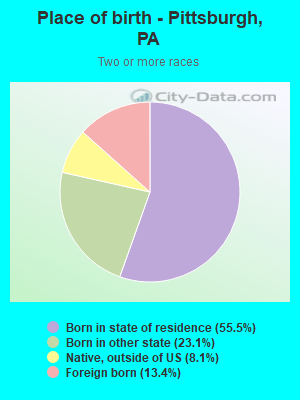
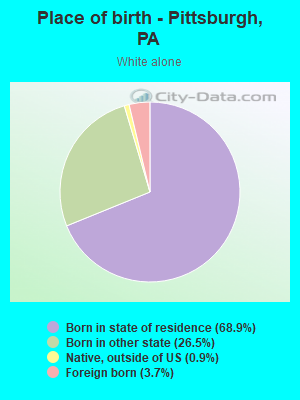
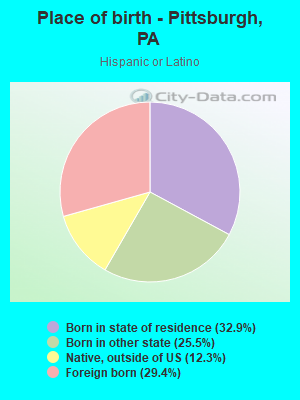
Place of birth - Born in state of residence (%)
Place of birth - Born in state of residence (%) - White
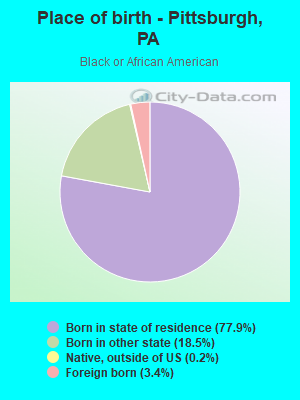
Place of birth - Born in state of residence (%) - Black or African American
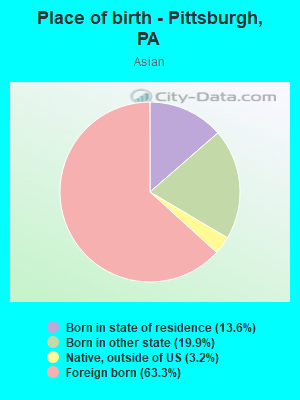
Place of birth - Born in state of residence (%) - Asian
Place of birth - Born in state of residence (%) - Hispanic or Latino
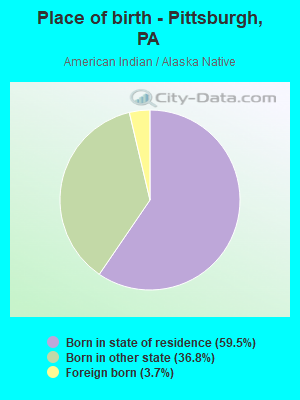
Place of birth - Born in state of residence (%) - American Indian and Alaska Native
Place of birth - Born in state of residence (%) - Multirace
Place of birth - Born in state of residence (%) - Other Race
Place of birth - Born in other state (%)
Place of birth - Born in other state (%) - White
Place of birth - Born in other state (%) - Black or African American
Place of birth - Born in other state (%) - Asian
Place of birth - Born in other state (%) - Hispanic or Latino
Place of birth - Born in other state (%) - American Indian and Alaska Native
Place of birth - Born in other state (%) - Multirace
Place of birth - Born in other state (%) - Other Race
Place of birth - Native, outside of US (%)
Place of birth - Native, outside of US (%) - White
Place of birth - Native, outside of US (%) - Black or African American
Place of birth - Native, outside of US (%) - Asian
Place of birth - Native, outside of US (%) - Hispanic or Latino
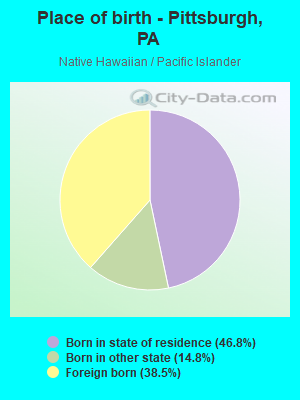
Place of birth - Native, outside of US (%) - American Indian and Alaska Native
Place of birth - Native, outside of US (%) - Multirace
Place of birth - Native, outside of US (%) - Other Race
Place of birth - Foreign born (%)
Place of birth - Foreign born (%) - White
Place of birth - Foreign born (%) - Black or African American
Place of birth - Foreign born (%) - Asian
Place of birth - Foreign born (%) - Hispanic or Latino
Place of birth - Foreign born (%) - American Indian and Alaska Native
Place of birth - Foreign born (%) - Multirace
Place of birth - Foreign born (%) - Other Race
Residents speaking English at home (%)
Residents speaking English at home - Born in the United States (%)
Residents speaking English at home - Native, born elsewhere (%)
Residents speaking English at home - Foreign born (%)
Residents speaking Spanish at home (%)
Residents speaking Spanish at home - Born in the United States (%)
Residents speaking Spanish at home - Native, born elsewhere (%)
Residents speaking Spanish at home - Foreign born (%)
Residents speaking other language at home (%)
Residents speaking other language at home - Born in the United States (%)
Residents speaking other language at home - Native, born elsewhere (%)
Residents speaking other language at home - Foreign born (%)
Marital status - Never married (%)
Marital status - Now married (%)
Marital status - Separated (%)
Marital status - Widowed (%)
Marital status - Divorced (%)
Ancestries Reported - Arab (%)
Ancestries Reported - Czech (%)
Ancestries Reported - Danish (%)
Ancestries Reported - Dutch (%)
Ancestries Reported - English (%)
Ancestries Reported - French (%)
Ancestries Reported - French Canadian (%)
Ancestries Reported - German (%)
Ancestries Reported - Greek (%)
Ancestries Reported - Hungarian (%)
Ancestries Reported - Irish (%)
Ancestries Reported - Italian (%)
Ancestries Reported - Lithuanian (%)
Ancestries Reported - Norwegian (%)
Ancestries Reported - Polish (%)
Ancestries Reported - Portuguese (%)
Ancestries Reported - Russian (%)
Ancestries Reported - Scotch-Irish (%)
Ancestries Reported - Scottish (%)
Ancestries Reported - Slovak (%)
Ancestries Reported - Subsaharan African (%)
Ancestries Reported - Swedish (%)
Ancestries Reported - Swiss (%)
Ancestries Reported - Ukrainian (%)
Ancestries Reported - United States (%)
Ancestries Reported - Welsh (%)
Ancestries Reported - West Indian (%)
Ancestries Reported - Other (%)
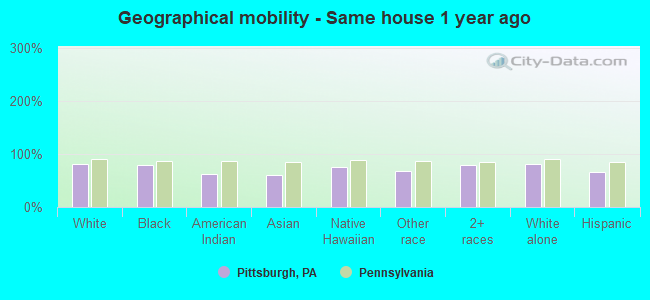
Geographical mobility - Same house 1 year ago (%)
Geographical mobility - Same house 1 year ago (%) - White
Geographical mobility - Same house 1 year ago (%) - Black or African American
Geographical mobility - Same house 1 year ago (%) - Asian
Geographical mobility - Same house 1 year ago (%) - Hispanic or Latino
Geographical mobility - Same house 1 year ago (%) - American Indian and Alaska Native
Geographical mobility - Same house 1 year ago (%) - Multirace
Geographical mobility - Same house 1 year ago (%) - Other Race
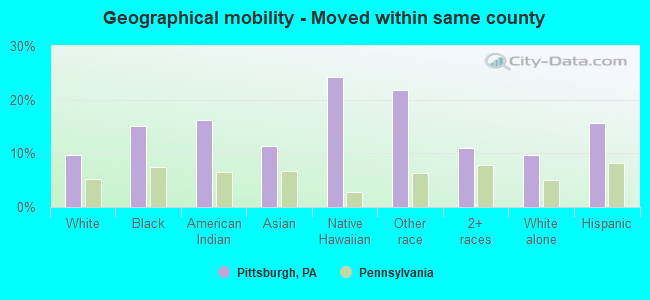
Geographical mobility - Moved within same county (%)
Geographical mobility - Moved within same county (%) - White
Geographical mobility - Moved within same county (%) - Black or African American
Geographical mobility - Moved within same county (%) - Asian
Geographical mobility - Moved within same county (%) - Hispanic or Latino
Geographical mobility - Moved within same county (%) - American Indian and Alaska Native
Geographical mobility - Moved within same county (%) - Multirace
Geographical mobility - Moved within same county (%) - Other Race
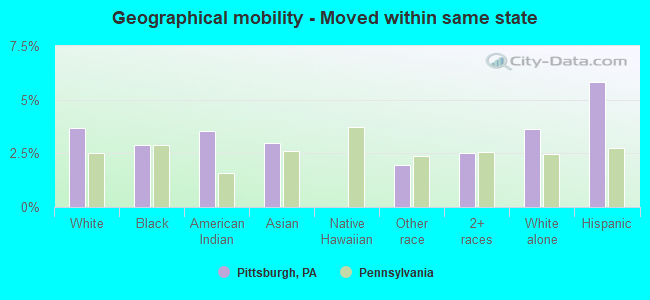
Geographical mobility - Moved from different county within same state (%)
Geographical mobility - Moved from different county within same state (%) - White
Geographical mobility - Moved from different county within same state (%) - Black or African American
Geographical mobility - Moved from different county within same state (%) - Asian
Geographical mobility - Moved from different county within same state (%) - Hispanic or Latino
Geographical mobility - Moved from different county within same state (%) - American Indian and Alaska Native
Geographical mobility - Moved from different county within same state (%) - Multirace
Geographical mobility - Moved from different county within same state (%) - Other Race
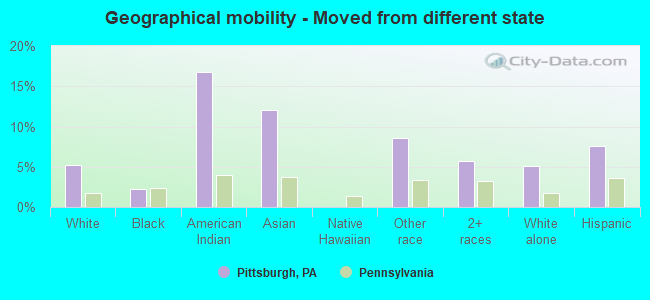
Geographical mobility - Moved from different state (%)
Geographical mobility - Moved from different state (%) - White
Geographical mobility - Moved from different state (%) - Black or African American
Geographical mobility - Moved from different state (%) - Asian
Geographical mobility - Moved from different state (%) - Hispanic or Latino
Geographical mobility - Moved from different state (%) - American Indian and Alaska Native
Geographical mobility - Moved from different state (%) - Multirace
Geographical mobility - Moved from different state (%) - Other Race
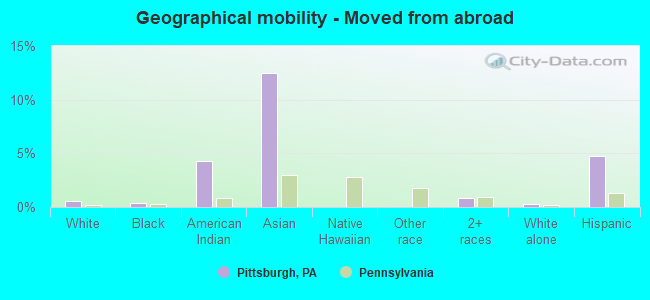
Geographical mobility - Moved from abroad (%)
Geographical mobility - Moved from abroad (%) - White
Geographical mobility - Moved from abroad (%) - Black or African American
Geographical mobility - Moved from abroad (%) - Asian
Geographical mobility - Moved from abroad (%) - Hispanic or Latino
Geographical mobility - Moved from abroad (%) - American Indian and Alaska Native
Geographical mobility - Moved from abroad (%) - Multirace
Geographical mobility - Moved from abroad (%) - Other Race
Place of birth for the foreign-born population - Ireland (%)
Place of birth for the foreign-born population - Denmark (%)
Place of birth for the foreign-born population - Norway (%)
Place of birth for the foreign-born population - Sweden (%)
Place of birth for the foreign-born population - United Kingdom (%)
Place of birth for the foreign-born population - England (%)
Place of birth for the foreign-born population - Scotland (%)
Place of birth for the foreign-born population - Other Northern Europe (%)
Place of birth for the foreign-born population - Austria (%)
Place of birth for the foreign-born population - Belgium (%)
Place of birth for the foreign-born population - France (%)
Place of birth for the foreign-born population - Germany (%)
Place of birth for the foreign-born population - Netherlands (%)
Place of birth for the foreign-born population - Switzerland (%)
Place of birth for the foreign-born population - Other Western Europe (%)
Place of birth for the foreign-born population - Greece (%)
Place of birth for the foreign-born population - Italy (%)
Place of birth for the foreign-born population - Portugal (%)
Place of birth for the foreign-born population - Spain (%)
Place of birth for the foreign-born population - Other Southern Europe (%)
Place of birth for the foreign-born population - Albania (%)
Place of birth for the foreign-born population - Belarus (%)
Place of birth for the foreign-born population - Bosnia and Herzegovina (%)
Place of birth for the foreign-born population - Bulgaria (%)
Place of birth for the foreign-born population - Croatia (%)
Place of birth for the foreign-born population - Czechoslovakia (%)
Place of birth for the foreign-born population - Hungary (%)
Place of birth for the foreign-born population - Latvia (%)
Place of birth for the foreign-born population - Lithuania (%)
Place of birth for the foreign-born population - North Macedonia (Macedonia) (%)
Place of birth for the foreign-born population - Moldova (%)
Place of birth for the foreign-born population - Poland (%)
Place of birth for the foreign-born population - Romania (%)
Place of birth for the foreign-born population - Russia (%)
Place of birth for the foreign-born population - Serbia (%)
Place of birth for the foreign-born population - Ukraine (%)
Place of birth for the foreign-born population - Other Eastern Europe (%)
Place of birth for the foreign-born population - China (%)
Place of birth for the foreign-born population - Hong Kong (%)
Place of birth for the foreign-born population - Taiwan (%)
Place of birth for the foreign-born population - Japan (%)
Place of birth for the foreign-born population - Korea (%)
Place of birth for the foreign-born population - Other Eastern Asia (%)
Place of birth for the foreign-born population - Afghanistan (%)
Place of birth for the foreign-born population - Bangladesh (%)
Place of birth for the foreign-born population - India (%)
Place of birth for the foreign-born population - Iran (%)
Place of birth for the foreign-born population - Kazakhstan (%)
Place of birth for the foreign-born population - Nepal (%)
Place of birth for the foreign-born population - Pakistan (%)
Place of birth for the foreign-born population - Sri Lanka (%)
Place of birth for the foreign-born population - Uzbekistan (%)
Place of birth for the foreign-born population - Other South Central Asia (%)
Place of birth for the foreign-born population - Burma (%)
Place of birth for the foreign-born population - Cambodia (%)
Place of birth for the foreign-born population - Indonesia (%)
Place of birth for the foreign-born population - Laos (%)
Place of birth for the foreign-born population - Malaysia (%)
Place of birth for the foreign-born population - Philippines (%)
Place of birth for the foreign-born population - Singapore (%)
Place of birth for the foreign-born population - Thailand (%)
Place of birth for the foreign-born population - Vietnam (%)
Place of birth for the foreign-born population - Other South Eastern Asia (%)
Place of birth for the foreign-born population - Armenia (%)
Place of birth for the foreign-born population - Iraq (%)
Place of birth for the foreign-born population - Israel (%)
Place of birth for the foreign-born population - Jordan (%)
Place of birth for the foreign-born population - Kuwait (%)
Place of birth for the foreign-born population - Lebanon (%)
Place of birth for the foreign-born population - Saudi Arabia (%)
Place of birth for the foreign-born population - Syria (%)
Place of birth for the foreign-born population - Turkey (%)
Place of birth for the foreign-born population - Yemen (%)
Place of birth for the foreign-born population - Other Western Asia (%)
Place of birth for the foreign-born population - Eritrea (%)
Place of birth for the foreign-born population - Ethiopia (%)
Place of birth for the foreign-born population - Kenya (%)
Place of birth for the foreign-born population - Somalia (%)
Place of birth for the foreign-born population - Uganda (%)
Place of birth for the foreign-born population - Zimbabwe (%)
Place of birth for the foreign-born population - Other Eastern Africa (%)
Place of birth for the foreign-born population - Cameroon (%)
Place of birth for the foreign-born population - Congo (%)
Place of birth for the foreign-born population - Democratic Republic of Congo (Zaire) (%)
Place of birth for the foreign-born population - Other Middle Africa (%)
Place of birth for the foreign-born population - Egypt (%)
Place of birth for the foreign-born population - Morocco (%)
Place of birth for the foreign-born population - Sudan (%)
Place of birth for the foreign-born population - Other Northern Africa (%)
Place of birth for the foreign-born population - South Africa (%)
Place of birth for the foreign-born population - Other Southern Africa (%)
Place of birth for the foreign-born population - Cabo Verde (%)
Place of birth for the foreign-born population - Ghana (%)
Place of birth for the foreign-born population - Liberia (%)
Place of birth for the foreign-born population - Nigeria (%)
Place of birth for the foreign-born population - Senegal (%)
Place of birth for the foreign-born population - Sierra Leone (%)
Place of birth for the foreign-born population - Other Western Africa (%)
Place of birth for the foreign-born population - Australia (%)
Place of birth for the foreign-born population - New Zealand (%)
Place of birth for the foreign-born population - Fiji (%)
Place of birth for the foreign-born population - Micronesia (%)
Place of birth for the foreign-born population - Bahamas (%)
Place of birth for the foreign-born population - Barbados (%)
Place of birth for the foreign-born population - Cuba (%)
Place of birth for the foreign-born population - Dominica (%)
Place of birth for the foreign-born population - Dominican Republic (%)
Place of birth for the foreign-born population - Grenada (%)
Place of birth for the foreign-born population - Haiti (%)
Place of birth for the foreign-born population - Jamaica (%)
Place of birth for the foreign-born population - St. Vincent and the Grenadines (%)
Place of birth for the foreign-born population - Trinidad and Tobago (%)
Place of birth for the foreign-born population - West Indies (%)
Place of birth for the foreign-born population - Other Caribbean (%)
Place of birth for the foreign-born population - Belize (%)
Place of birth for the foreign-born population - Costa Rica (%)
Place of birth for the foreign-born population - El Salvador (%)
Place of birth for the foreign-born population - Guatemala (%)
Place of birth for the foreign-born population - Honduras (%)
Place of birth for the foreign-born population - Mexico (%)
Place of birth for the foreign-born population - Nicaragua (%)
Place of birth for the foreign-born population - Panama (%)
Place of birth for the foreign-born population - Other Central America (%)
Place of birth for the foreign-born population - Argentina (%)
Place of birth for the foreign-born population - Bolivia (%)
Place of birth for the foreign-born population - Brazil (%)
Place of birth for the foreign-born population - Chile (%)
Place of birth for the foreign-born population - Colombia (%)
Place of birth for the foreign-born population - Ecuador (%)
Place of birth for the foreign-born population - Guyana (%)
Place of birth for the foreign-born population - Peru (%)
Place of birth for the foreign-born population - Uruguay (%)
Place of birth for the foreign-born population - Venezuela (%)
Place of birth for the foreign-born population - Other South America (%)
Place of birth for the foreign-born population - Canada (%)
Place of birth for the foreign-born population - Other Northern America (%)
Place of birth for the foreign-born population - Other (%)
Latest news about races in Pittsburgh, PA collected exclusively by city-data.com from local newspapers, TV, and radio stations
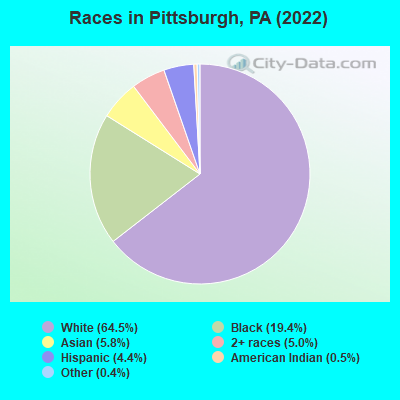
According to 2022 data, the most numerous races in Pittsburgh, PA are White alone (195,286 residents), Black alone (58,838 residents), and Hispanic (13,318 residents). 88.2% of Pittsburgh residents speak English at home. 9.4% of Pittsburgh, PA residents are foreign-born (4.3% born in Asia, 1.9% born in Europe, 1.4% born in Latin America, 1.0% born in Africa), which is 25.8% greater than the foreign-born rate of 7.0% across the entire state of Pennsylvania.
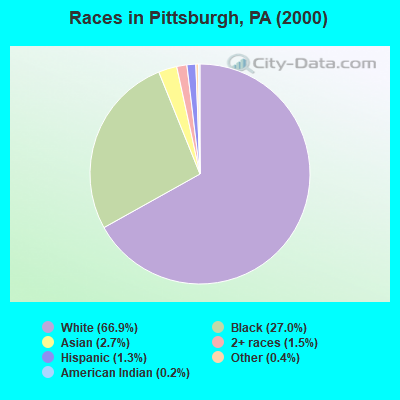
Race distribution in Pittsburgh
2000 2022
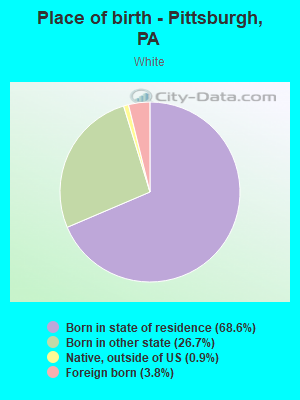
223,982 66.9% White alone 90,183 27.0% Black alone 9,160 2.7% Asian alone 4,935 1.5% Two or more races 4,425 1.3% Hispanic 1,217 0.4% Other race alone 561 0.2% American Indian alone 100 0.03% Native Hawaiian and Other
195,286 64.5% White alone 58,838 19.4% Black alone 17,569 5.8% Asian alone 15,081 5.0% Two or more races 13,318 4.4% Hispanic 1,444 0.5% American Indian alone 1,342 0.4% Other race alone 27 0.01% Native Hawaiian and Other
2000 2022
10,322,455 84.1% White alone 1,202,437 9.8% Black alone 394,088 3.2% Hispanic 218,296 1.8% Asian alone 113,097 0.9% Two or more races 13,086 0.1% Other race alone 14,904 0.1% American Indian alone 2,691 0.02% Native Hawaiian and Other
9,487,228 73.1% White alone 1,311,581 10.1% Black alone 1,115,997 8.6% Hispanic 493,942 3.8% Two or more races 487,124 3.8% Asian alone 63,582 0.5% Other race alone 10,130 0.08% American Indian alone 2,424 0.02% Native Hawaiian and Other
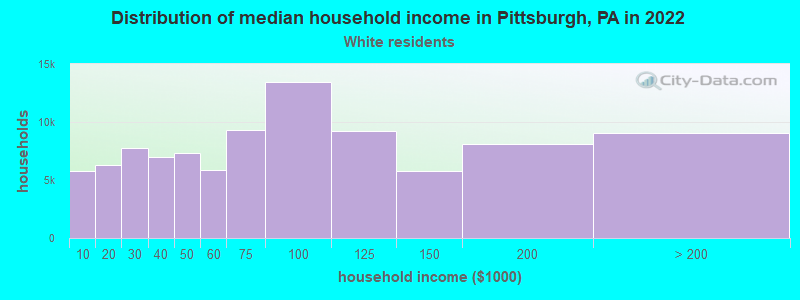
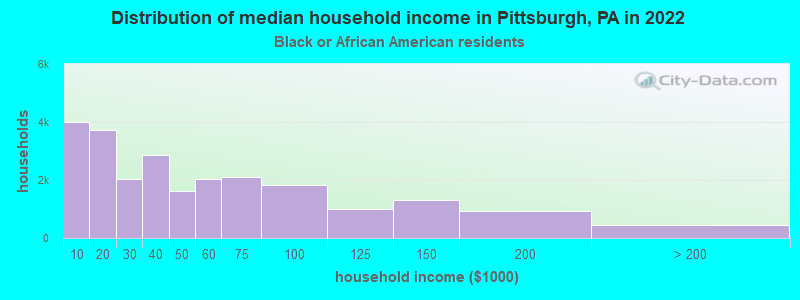
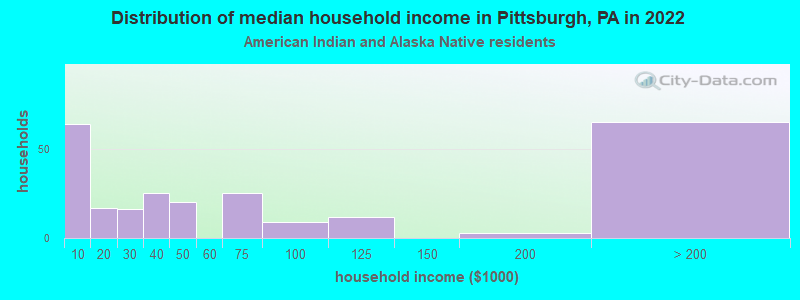
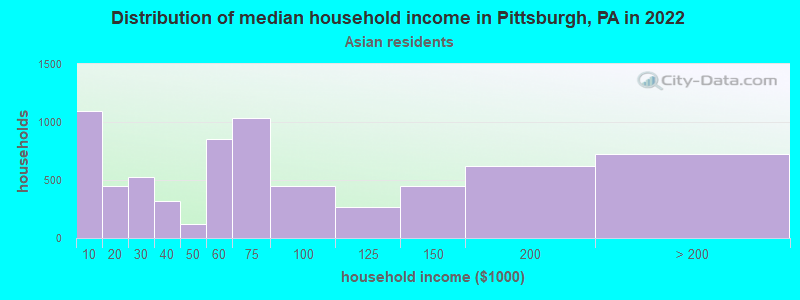
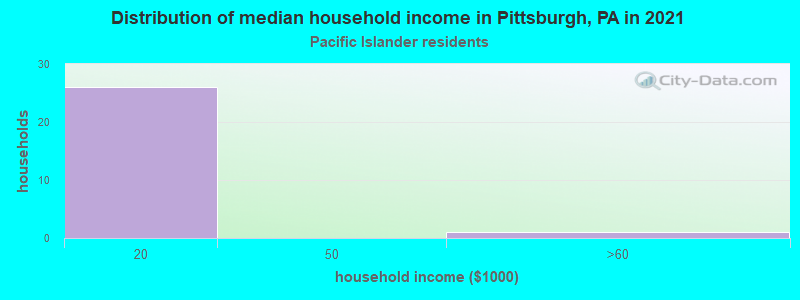
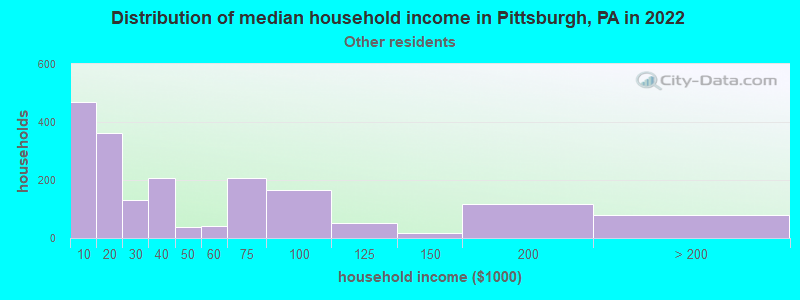
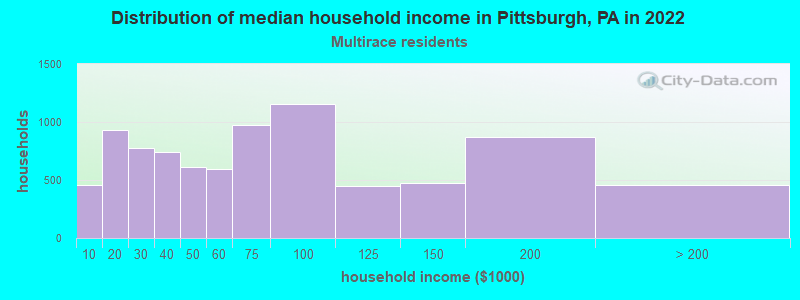
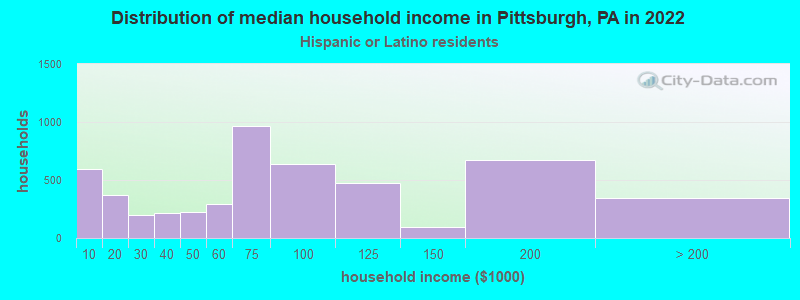
Income and house value in Pittsburgh Median household income in 2022 $71,180 White non-Hispanic householders$36,826 Black householders$60,529 Asian householders$60,407 Some other race householders$66,084 Two or more races householders$67,130 Hispanic or Latino race householdersMedian 2022 house value $214,369 White Non-Hispanic householders$160,604 Black or African American householders$198,860 American Indian or Alaska Native householders $366,703 Asian householders$470,441 Native Hawaiian and other Pacific Islander householders$214,025 Some other race householders$206,787 Two or more races householders$278,473 Hispanic or Latino householders
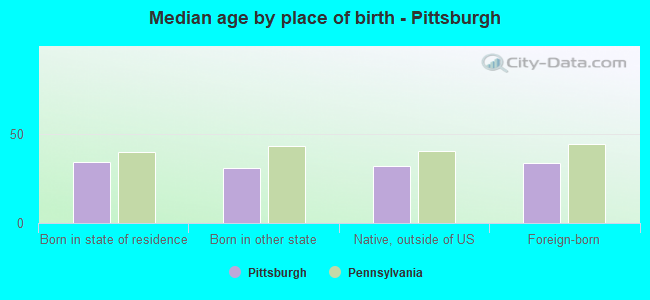
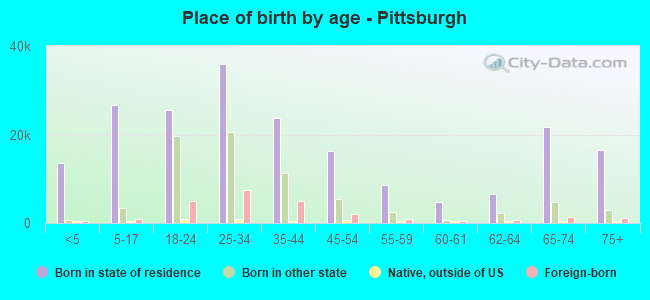
Median age by race in Pittsburgh
35.3 Median age for White residents36.3 34.3 31.3 Median age for Black or African American residents27.8 33.8 16.0 Median age for American Indian / Alaska Native residents15.7 43.1 26.4 Median age for Asian residents27.5 25.3 -666,666,666.0 Median age for Native Hawaiian / Pacific Islander residents-666,666,666.0 -666,666,666.0 31.2 Median age for Other race residents23.8 37.6 28.3 Median age for Two or more races residents28.5 28.0 35.3 Median age for White alone residents36.4 34.3 29.3 Median age for Hispanic or Latino residents28.5 30.9
Owner/renter occupied households by race in Pittsburgh
House owners and renters - White residents 54,564 57.3% Owner occupied40,580 42.7% Renter occupiedHouse owners and renters - Black or African American residents 8,229 34.3% Owner occupied15,758 65.7% Renter occupiedHouse owners and renters - American Indian / Alaska Native residents 24 6.0% Owner occupied379 94.0% Renter occupiedHouse owners and renters - Asian residents 1,001 14.5% Owner occupied5,902 85.5% Renter occupiedHouse owners and renters - Native Hawaiian / Pacific Islander residents 16 100.0% Renter occupiedHouse owners and renters - Other race residents 612 44.2% Owner occupied774 55.8% Renter occupiedHouse owners and renters - Two or more races residents 2,899 34.1% Owner occupied5,593 65.9% Renter occupiedHouse owners and renters - White alone residents 53,760 57.5% Owner occupied39,743 42.5% Renter occupiedHouse owners and renters - Hispanic or Latino residents 1,909 37.4% Owner occupied3,189 62.6% Renter occupied
Language usage in Pittsburgh
English speakers - Total 88.2% of residents of Pittsburgh speak English at home.
3.4% of residents speak Spanish at home 7,457 76.0% Speak English very well2,353 24.0% Speak English less than very well8.4% of residents speak other language at home 17,566 72.8% Speak English very well6,562 27.2% Speak English less than very well
English speakers - Born in the United States 91.6% of residents of Pittsburgh speak English at home.
2.8% of residents speak Spanish at home 1,920 93.3% Speak English very well137 6.7% Speak English less than very well5.6% of residents speak other language at home 3,667 89.8% Speak English very well417 10.2% Speak English less than very well
English speakers - Native, born elsewhere 45.2% of residents of Pittsburgh speak English at home.
35.6% of residents speak Spanish at home 1,125 74.0% Speak English very well395 26.0% Speak English less than very well19.2% of residents speak other language at home 693 84.5% Speak English very well127 15.5% Speak English less than very well
English speakers - Foreign-born 23.5% of residents of Pittsburgh speak English at home.
14.7% of residents speak Spanish at home 2,236 61.5% Speak English very well1,398 38.5% Speak English less than very well61.8% of residents speak other language at home 9,657 63.2% Speak English very well5,611 36.8% Speak English less than very well
White (Caucasian) - Speak only English Native:
97.3% (178,368)Foreign-born:
37.8% (2,874)
White (Caucasian) - Speak another language Native:
2.7% (5,028)Foreign-born:
62.2% (4,730)
Black or African American - Speak only English Native:
96.2% (51,346)Foreign-born:
56.6% (1,150)
Black or African American - Speak another language Native:
3.8% (2,012)Foreign-born:
43.4% (882)
American Indian / Alaska Native - Speak only English Native:
72.9% (579)Foreign-born:
22.9% (9)
American Indian / Alaska Native - Speak another language Native:
17.9% (142)Foreign-born:
78.5% (31)
Asian - Speak only English Native:
33.3% (1,942)Foreign-born:
13.0% (1,417)
Asian - Speak another language Native:
66.7% (3,888)Foreign-born:
87.0% (9,507)
Native Hawaiian / Pacific Islander - Speak only English Native:
98.5% (32)Foreign-born:
25.9% (7)
Native Hawaiian / Pacific Islander - Speak another language Native:
2.2% (1)Foreign-born:
100.0% (27)
Other race - Speak another language Native:
41.5% (964)Foreign-born:
100.0% (1,097)
Two or more races - Speak only English Native:
81.8% (13,846)Foreign-born:
12.5% (381)
Two or more races - Speak another language Native:
18.2% (3,072)Foreign-born:
87.5% (2,668)
White alone - Speak only English Native:
97.4% (176,350)Foreign-born:
37.9% (2,757)
White alone - Speak another language Native:
2.6% (4,778)Foreign-born:
62.1% (4,520)
Hispanic or Latino - Speak only English Native:
58.6% (5,314)Foreign-born:
7.0% (273)
Hispanic or Latino - Speak another language Native:
41.4% (3,758)Foreign-born:
93.0% (3,638)
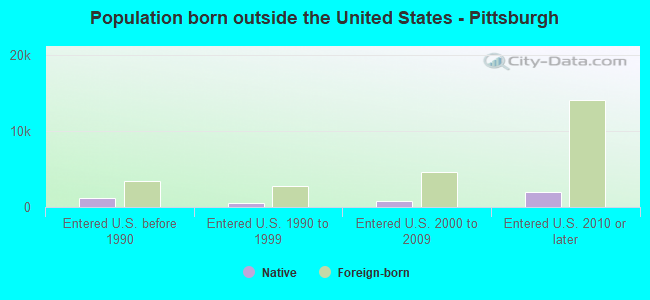
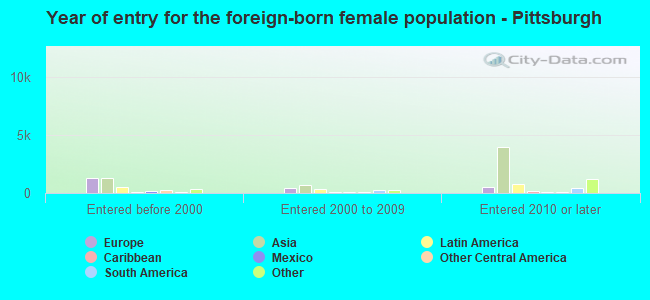
Foreign-born residents in Pittsburgh 28,374 residents are foreign born (4.3% Asia , 1.9% Europe , 1.4% Latin America , 1.0% Africa ).
This city:
9.4%Pennsylvania:
7.3%
Marital status for residents in Pittsburgh Marital status - White (Caucasian) population 15 years and over
Males 52.9% Never married35.2% Now married1.2% Separated2.8% Widowed7.8% DivorcedFemales 51.6% Never married34.1% Now married1.4% Separated6.8% Widowed6.1% DivorcedWomen who gave birth in the past 12 months Now married:
82.7% (1,626)Unmarried:
17.3% (340)
Women who did not give birth in the past 12 months Now married:
26.2% (15,162)Unmarried:
73.8% (42,604)
Marital status - Black or African American population 15 years and over
Males 66.6% Never married18.0% Now married2.2% Separated4.5% Widowed8.7% DivorcedFemales 60.0% Never married15.8% Now married3.0% Separated7.3% Widowed13.9% DivorcedWomen who gave birth in the past 12 months Now married:
36.7% (363)Unmarried:
63.3% (627)
Women who did not give birth in the past 12 months Now married:
15.6% (2,150)Unmarried:
84.4% (11,666)
Marital status - American Indian / Alaska Native population 15 years and over
Males 66.2% Never married26.2% Now married2.9% Separated0.0% Widowed4.6% DivorcedFemales 18.3% Never married33.9% Now married18.7% Separated0.0% Widowed29.1% DivorcedWomen who did not give birth in the past 12 months Now married:
49.5% (95)Unmarried:
50.5% (97)
Marital status - Asian population 15 years and over
Males 70.2% Never married28.9% Now married0.0% Separated0.4% Widowed0.5% DivorcedFemales 68.2% Never married28.0% Now married0.0% Separated1.6% Widowed2.2% DivorcedWomen who gave birth in the past 12 months Now married:
100.0% (334)Unmarried:
0.0% (0)
Women who did not give birth in the past 12 months Now married:
18.4% (1,230)Unmarried:
81.6% (5,467)
Marital status - Other race population 15 years and over
Males 65.7% Never married27.2% Now married1.4% Separated0.0% Widowed5.7% DivorcedFemales 49.1% Never married31.3% Now married2.6% Separated10.4% Widowed6.5% DivorcedWomen who gave birth in the past 12 months Now married:
100.0% (17)Unmarried:
0.0% (0)
Women who did not give birth in the past 12 months Now married:
30.3% (380)Unmarried:
69.7% (873)
Marital status - Two or more races population 15 years and over
Males 66.6% Never married27.4% Now married0.0% Separated0.6% Widowed5.4% DivorcedFemales 57.1% Never married31.8% Now married0.0% Separated2.7% Widowed8.4% DivorcedWomen who gave birth in the past 12 months Now married:
34.0% (93)Unmarried:
66.0% (180)
Women who did not give birth in the past 12 months Now married:
25.4% (1,692)Unmarried:
74.6% (4,957)
Marital status - White alone, not Hispanic / Latino population 15 years and over
Males 52.5% Never married35.6% Now married1.1% Separated2.8% Widowed7.9% DivorcedFemales 51.6% Never married34.0% Now married1.4% Separated6.9% Widowed6.1% DivorcedWomen who gave birth in the past 12 months Now married:
76.5% (1,106)Unmarried:
23.5% (340)
Women who did not give birth in the past 12 months Now married:
26.4% (14,990)Unmarried:
73.6% (41,813)
Marital status - Hispanic or Latino population 15 years and over
Males 74.1% Never married20.0% Now married3.5% Separated0.0% Widowed2.4% DivorcedFemales 50.9% Never married39.8% Now married0.0% Separated3.4% Widowed5.9% DivorcedWomen who gave birth in the past 12 months Now married:
100.0% (520)Unmarried:
0.0% (0)
Women who did not give birth in the past 12 months Now married:
31.0% (1,377)Unmarried:
69.0% (3,059)
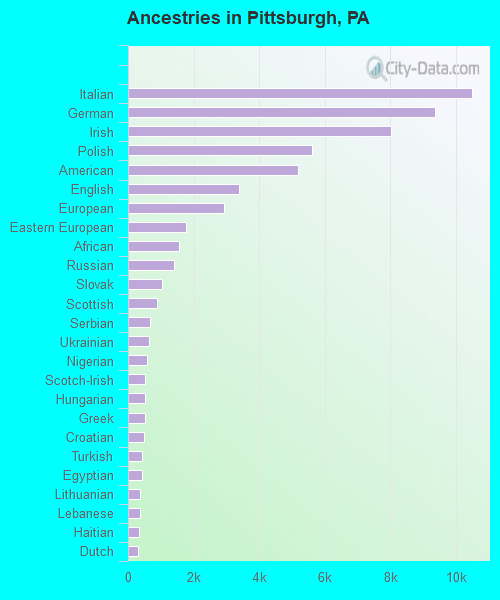
Ancestries in Pittsburgh
10,496 8.3% Italian9,364 7.4% German8,043 6.3% Irish5,615 4.4% Polish5,194 4.1% American3,379 2.7% English2,917 2.3% European1,759 1.4% Eastern European1,549 1.2% African1,397 1.1% Russian1,029 0.8% Slovak885 0.7% Scottish683 0.5% Serbian632 0.5% Ukrainian571 0.5% Nigerian521 0.4% Scotch-Irish512 0.4% Hungarian507 0.4% Greek500 0.4% Croatian429 0.3% Turkish417 0.3% Egyptian362 0.3% Lithuanian352 0.3% Lebanese328 0.3% Haitian315 0.2% Dutch299 0.2% Norwegian286 0.2% Arab279 0.2% French Canadian278 0.2% Iranian238 0.2% French227 0.2% British221 0.2% Somali214 0.2% Brazilian212 0.2% Bahamian210 0.2% Jamaican194 0.2% Swedish193 0.2% Slovene184 0.1% Israeli180 0.1% Slavic161 0.1% Czech152 0.1% Northern European140 0.1% Ethiopian140 0.1% Canadian134 0.1% Kenyan133 0.1% Austrian130 0.1% Czechoslovakian130 0.1% Trinidadian and Tobagonian127 0.1% Romanian119 0.09% Swiss106 0.08% Sudanese102 0.08% Jordanian96 0.08% Bulgarian90 0.07% Ghanaian89 0.07% Welsh88 0.07% Macedonian75 0.06% Danish72 0.06% Armenian63 0.05% Albanian61 0.05% Carpatho Rusyn57 0.04% Australian56 0.04% Syrian52 0.04% Guyanese45 0.04% Senegalese44 0.03% Iraqi44 0.03% Yugoslavian36 0.03% Scandinavian31 0.02% Moroccan24 0.02% Pennsylvania German23 0.02% U.S. Virgin Islander21 0.02% Belgian20 0.02% Cape Verdean19 0.01% Basque19 0.01% Barbadian18 0.01% Finnish16 0.01% Latvian14 0.01% Palestinian14 0.01% Celtic12 0.01% Afghan11 0.01% Portuguese
Geographical mobility in Pittsburgh Same house 1 year ago 159,002 80.8% White (Caucasian)46,320 79.4% Black or African American565 62.5% American Indian / Alaska Native10,544 61.1% Asian62 75.2% Native Hawaiian / Pacific Islander2,482 67.8% Other race18,127 80.0% Two or more races157,981 81.4% White alone, not Hispanic / Latino8,812 66.2% Hispanic or LatinoMoved within same county 19,006 9.7% White / Caucasian8,821 15.1% Black or African American146 16.1% American Indian / Alaska Native1,967 11.4% Asian20 24.3% Native Hawaiian / Pacific Islander797 21.8% Other race2,488 11.0% Two or more races18,630 9.6% White alone, not Hispanic / Latino2,076 15.6% Hispanic or LatinoMoved within same state 7,236 3.7% White / Caucasian1,680 2.9% Black or African American32 3.5% American Indian / Alaska Native512 3.0% Asian71 1.9% Other race570 2.5% Two or more races7,082 3.6% White alone, not Hispanic / Latino776 5.8% Hispanic or LatinoMoved from different state 10,334 5.3% White / Caucasian1,275 2.2% Black or African American151 16.7% American Indian / Alaska Native2,073 12.0% Asian313 8.5% Other race1,282 5.7% Two or more races9,901 5.1% White alone, not Hispanic / Latino1,015 7.6% Hispanic or LatinoMoved from abroad 1,129 0.6% White215 0.4% Black or African American39 4.3% American Indian / Alaska Native2,157 12.5% Asian184 0.8% Two or more races518 0.3% White alone, not Hispanic / Latino639 4.8% Hispanic or Latino
Children Nativity (place of birth) in Pittsburgh
Children under 6 years - Living with two parents Both parents native 7,504 100.0% NativeBoth parents foreign-born 1,148 85.7% Native192 14.3% Foreign-bornOne native, one foreign-born parent 1,028 94.7% Native57 5.3% Foreign-bornChildren under 6 years - Living with one parent Native parent 6,060 100.0% NativeForeign-born parent 196 100.0% NativeChildren 6 to 17 years - Living with two parents Both parents native 10,499 100.0% NativeBoth parents foreign-born 819 71.1% Native333 28.9% Foreign-bornOne native, one foreign-born parent 921 100.0% NativeChildren 6 to 17 years - Living with one parent Native parent 12,965 99.4% Native83 0.6% Foreign-bornForeign-born parent 774 67.4% Native374 32.6% Foreign-born
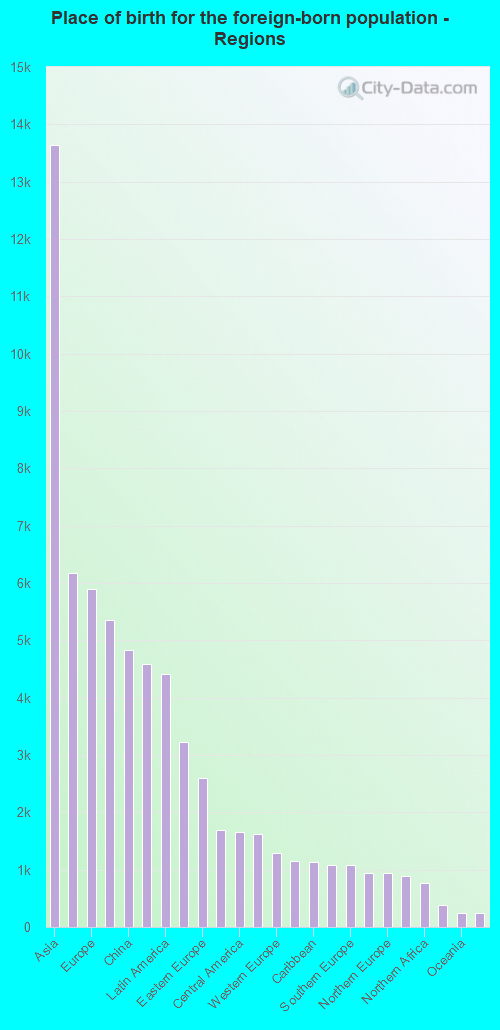
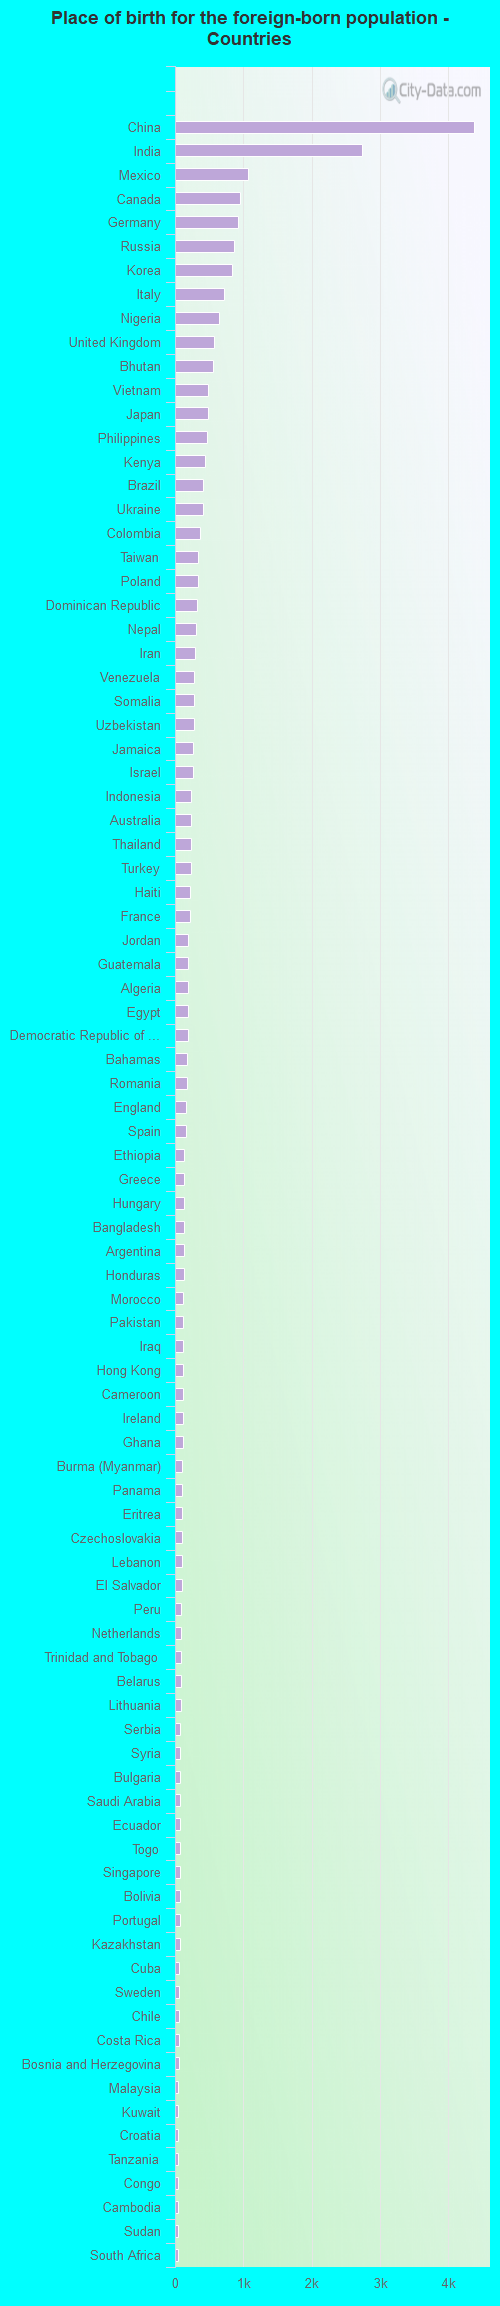
Place of birth for residents in Pittsburgh 13,637 Asia6,166 Eastern Asia5,901 Europe5,362 Americas4,830 China4,588 South Central Asia4,418 Latin America3,221 Africa2,599 Eastern Europe1,695 South Eastern Asia1,663 Central America1,624 South America1,286 Western Europe1,153 Western Asia1,130 Caribbean1,088 Eastern Africa1,080 Southern Europe944 Northern America934 Northern Europe897 Western Africa774 Northern Africa380 Middle Africa251 Oceania251 Australia and New Zealand Subregion41 Southern Africa4,376 China2,738 India1,068 Mexico944 Canada923 Germany859 Russia832 Korea712 Italy637 Nigeria569 United Kingdom558 Bhutan485 Vietnam480 Japan461 Philippines435 Kenya404 Brazil404 Ukraine361 Colombia334 Taiwan332 Poland323 Dominican Republic309 Nepal288 Iran280 Venezuela275 Somalia271 Uzbekistan261 Jamaica260 Israel239 Indonesia235 Australia232 Thailand232 Turkey219 Haiti216 France187 Jordan186 Guatemala185 Algeria184 Egypt184 Democratic Republic of Congo (Zaire)176 Bahamas169 Romania158 England156 Spain139 Ethiopia136 Greece136 Hungary136 Bangladesh130 Argentina127 Honduras124 Morocco122 Pakistan120 Iraq119 Hong Kong119 Cameroon116 Ireland110 Ghana109 Burma (Myanmar)108 Panama106 Eritrea100 Czechoslovakia98 Lebanon97 El Salvador93 Peru86 Netherlands86 Trinidad and Tobago82 Belarus82 Lithuania77 Serbia76 Syria73 Bulgaria73 Saudi Arabia72 Ecuador71 Togo70 Singapore68 Bolivia68 Portugal68 Kazakhstan63 Cuba61 Sweden61 Chile60 Costa Rica52 Bosnia and Herzegovina49 Malaysia49 Kuwait48 Croatia48 Tanzania47 Congo46 Cambodia43 Sudan41 South Africa38 Uganda33 Belgium30 Guyana25 Sri Lanka22 Switzerland21 Senegal19 Zimbabwe19 Afghanistan18 Scotland15 Latvia15 New Zealand14 Nicaragua13 Moldova12 United Arab Emirates10 Denmark9 Liberia8 Ivory Coast5 Austria
Grandparents responsible for own grandchildren in Pittsburgh
Grandparents (30 to 59 years) White / Caucasian 144 37.3% Responsible for grandchildren243 62.7% Not responsible for grandchildrenBlack or African American 192 37.0% Responsible for grandchildren328 63.0% Not responsible for grandchildrenAsian 151 100.0% Not responsible for grandchildrenOther race 17 100.0% Responsible for grandchildrenTwo or more races 27 12.4% Responsible for grandchildren191 87.6% Not responsible for grandchildrenWhite alone, not Hispanic / Latino 146 38.0% Responsible for grandchildren238 62.0% Not responsible for grandchildrenHispanic or Latino 14 58.7% Responsible for grandchildren10 41.3% Not responsible for grandchildrenGrandparents (60 years and over) White / Caucasian 267 37.6% Responsible for grandchildren443 62.4% Not responsible for grandchildrenBlack or African American 263 52.0% Responsible for grandchildren243 48.0% Not responsible for grandchildrenAsian 19 32.5% Responsible for grandchildren40 67.5% Not responsible for grandchildrenTwo or more races 4 4.2% Responsible for grandchildren95 95.8% Not responsible for grandchildrenWhite alone, not Hispanic / Latino 265 37.3% Responsible for grandchildren446 62.7% Not responsible for grandchildrenHispanic or Latino 4 57.4% Responsible for grandchildren3 42.6% Not responsible for grandchildren
Zip codes: 15201 , 15203 , 15206 , 15207 , 15208 , 15211 , 15212 , 15213 , 15214 , 15217 , 15219 , 15222 , 15224 , 15232 , 15233 , 15260, 15290.