Races in Pinehurst, North Carolina (NC) Detailed Stats
Data:
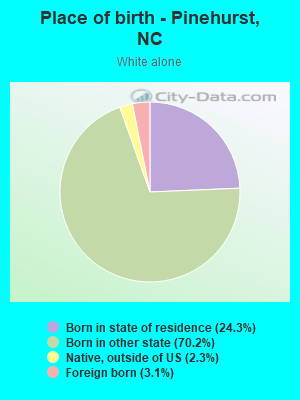
Races - White alone (%)
Races - White alone (% change since 2000)
Races - Black alone (%)
Races - Black alone (% change since 2000)
Races - American Indian alone (%)
Races - American Indian alone (% change since 2000)
Races - Asian alone (%)
Races - Asian alone (% change since 2000)
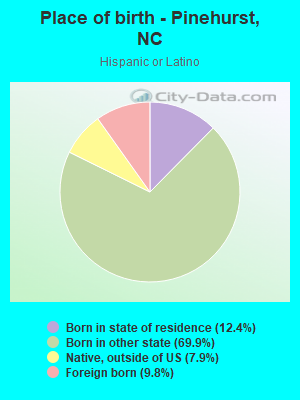
Races - Hispanic (%)
Races - Hispanic (% change since 2000)
Races - Native Hawaiian and Other Pacific Islander alone (%)
Races - Native Hawaiian and Other Pacific Islander alone (% change since 2000)
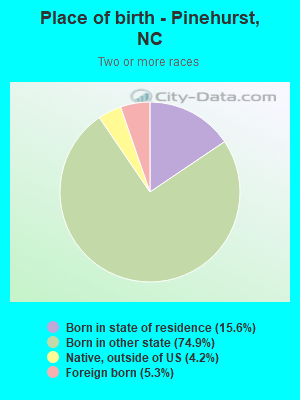
Races - Two or more races(%)
Races - Two or more races(% change since 2000)
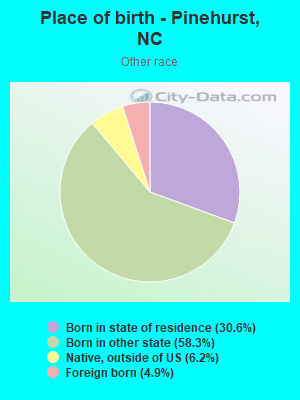
Races - Other race alone (%)
Races - Other race alone (% change since 2000)
Racial diversity
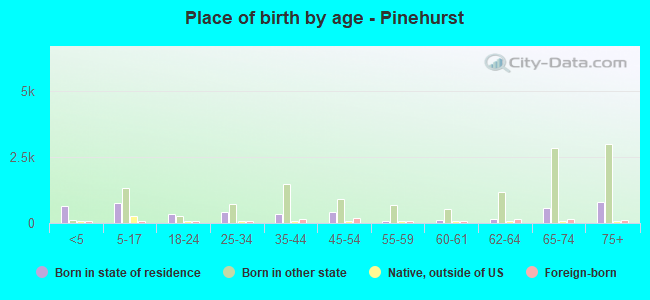
Place of birth - Born in state of residence (%)
Place of birth - Born in state of residence (%) - White
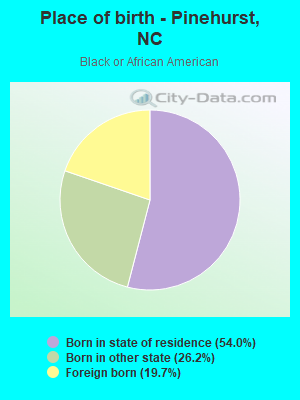
Place of birth - Born in state of residence (%) - Black or African American
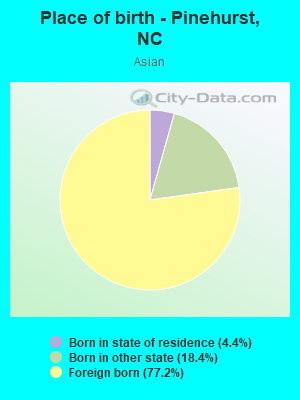
Place of birth - Born in state of residence (%) - Asian
Place of birth - Born in state of residence (%) - Hispanic or Latino
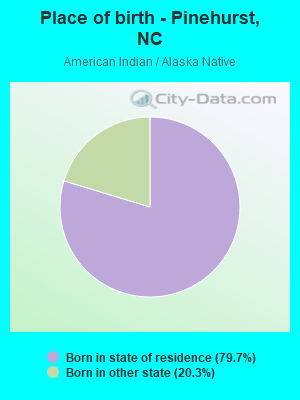
Place of birth - Born in state of residence (%) - American Indian and Alaska Native
Place of birth - Born in state of residence (%) - Multirace
Place of birth - Born in state of residence (%) - Other Race
Place of birth - Born in other state (%)
Place of birth - Born in other state (%) - White
Place of birth - Born in other state (%) - Black or African American
Place of birth - Born in other state (%) - Asian
Place of birth - Born in other state (%) - Hispanic or Latino
Place of birth - Born in other state (%) - American Indian and Alaska Native
Place of birth - Born in other state (%) - Multirace
Place of birth - Born in other state (%) - Other Race
Place of birth - Native, outside of US (%)
Place of birth - Native, outside of US (%) - White
Place of birth - Native, outside of US (%) - Black or African American
Place of birth - Native, outside of US (%) - Asian
Place of birth - Native, outside of US (%) - Hispanic or Latino
Place of birth - Native, outside of US (%) - American Indian and Alaska Native
Place of birth - Native, outside of US (%) - Multirace
Place of birth - Native, outside of US (%) - Other Race
Place of birth - Foreign born (%)
Place of birth - Foreign born (%) - White
Place of birth - Foreign born (%) - Black or African American
Place of birth - Foreign born (%) - Asian
Place of birth - Foreign born (%) - Hispanic or Latino
Place of birth - Foreign born (%) - American Indian and Alaska Native
Place of birth - Foreign born (%) - Multirace
Place of birth - Foreign born (%) - Other Race
Residents speaking English at home (%)
Residents speaking English at home - Born in the United States (%)
Residents speaking English at home - Native, born elsewhere (%)
Residents speaking English at home - Foreign born (%)
Residents speaking Spanish at home (%)
Residents speaking Spanish at home - Born in the United States (%)
Residents speaking Spanish at home - Native, born elsewhere (%)
Residents speaking Spanish at home - Foreign born (%)
Residents speaking other language at home (%)
Residents speaking other language at home - Born in the United States (%)
Residents speaking other language at home - Native, born elsewhere (%)
Residents speaking other language at home - Foreign born (%)
Marital status - Never married (%)
Marital status - Now married (%)
Marital status - Separated (%)
Marital status - Widowed (%)
Marital status - Divorced (%)
Ancestries Reported - Arab (%)
Ancestries Reported - Czech (%)
Ancestries Reported - Danish (%)
Ancestries Reported - Dutch (%)
Ancestries Reported - English (%)
Ancestries Reported - French (%)
Ancestries Reported - French Canadian (%)
Ancestries Reported - German (%)
Ancestries Reported - Greek (%)
Ancestries Reported - Hungarian (%)
Ancestries Reported - Irish (%)
Ancestries Reported - Italian (%)
Ancestries Reported - Lithuanian (%)
Ancestries Reported - Norwegian (%)
Ancestries Reported - Polish (%)
Ancestries Reported - Portuguese (%)
Ancestries Reported - Russian (%)
Ancestries Reported - Scotch-Irish (%)
Ancestries Reported - Scottish (%)
Ancestries Reported - Slovak (%)
Ancestries Reported - Subsaharan African (%)
Ancestries Reported - Swedish (%)
Ancestries Reported - Swiss (%)
Ancestries Reported - Ukrainian (%)
Ancestries Reported - United States (%)
Ancestries Reported - Welsh (%)
Ancestries Reported - West Indian (%)
Ancestries Reported - Other (%)
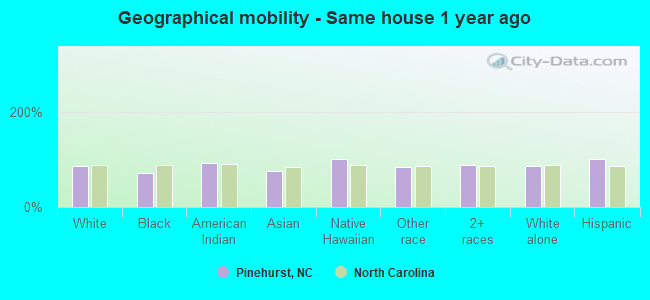
Geographical mobility - Same house 1 year ago (%)
Geographical mobility - Same house 1 year ago (%) - White
Geographical mobility - Same house 1 year ago (%) - Black or African American
Geographical mobility - Same house 1 year ago (%) - Asian
Geographical mobility - Same house 1 year ago (%) - Hispanic or Latino
Geographical mobility - Same house 1 year ago (%) - American Indian and Alaska Native
Geographical mobility - Same house 1 year ago (%) - Multirace
Geographical mobility - Same house 1 year ago (%) - Other Race
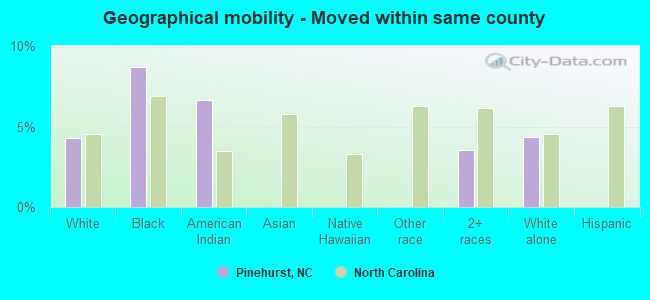
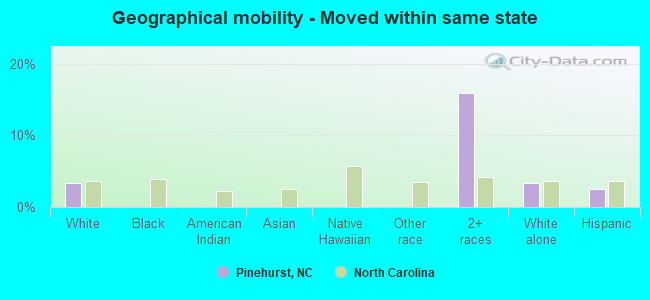
Geographical mobility - Moved within same county (%)
Geographical mobility - Moved within same county (%) - White
Geographical mobility - Moved within same county (%) - Black or African American
Geographical mobility - Moved within same county (%) - Asian
Geographical mobility - Moved within same county (%) - Hispanic or Latino
Geographical mobility - Moved within same county (%) - American Indian and Alaska Native
Geographical mobility - Moved within same county (%) - Multirace
Geographical mobility - Moved within same county (%) - Other Race
Geographical mobility - Moved from different county within same state (%)
Geographical mobility - Moved from different county within same state (%) - White
Geographical mobility - Moved from different county within same state (%) - Black or African American
Geographical mobility - Moved from different county within same state (%) - Asian
Geographical mobility - Moved from different county within same state (%) - Hispanic or Latino
Geographical mobility - Moved from different county within same state (%) - American Indian and Alaska Native
Geographical mobility - Moved from different county within same state (%) - Multirace
Geographical mobility - Moved from different county within same state (%) - Other Race
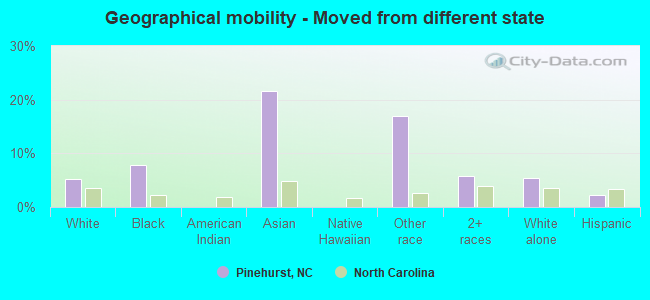
Geographical mobility - Moved from different state (%)
Geographical mobility - Moved from different state (%) - White
Geographical mobility - Moved from different state (%) - Black or African American
Geographical mobility - Moved from different state (%) - Asian
Geographical mobility - Moved from different state (%) - Hispanic or Latino
Geographical mobility - Moved from different state (%) - American Indian and Alaska Native
Geographical mobility - Moved from different state (%) - Multirace
Geographical mobility - Moved from different state (%) - Other Race
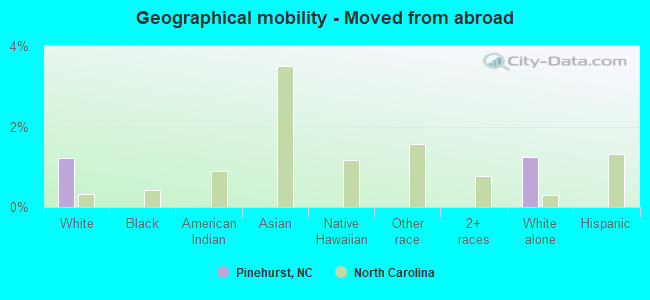
Geographical mobility - Moved from abroad (%)
Geographical mobility - Moved from abroad (%) - White
Geographical mobility - Moved from abroad (%) - Black or African American
Geographical mobility - Moved from abroad (%) - Asian
Geographical mobility - Moved from abroad (%) - Hispanic or Latino
Geographical mobility - Moved from abroad (%) - American Indian and Alaska Native
Geographical mobility - Moved from abroad (%) - Multirace
Geographical mobility - Moved from abroad (%) - Other Race
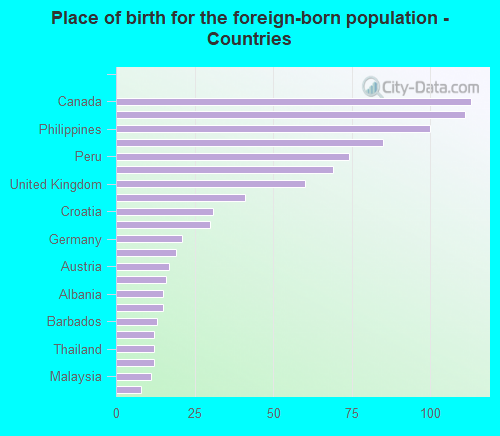
Place of birth for the foreign-born population - Ireland (%)
Place of birth for the foreign-born population - Denmark (%)
Place of birth for the foreign-born population - Norway (%)
Place of birth for the foreign-born population - Sweden (%)
Place of birth for the foreign-born population - United Kingdom (%)
Place of birth for the foreign-born population - England (%)
Place of birth for the foreign-born population - Scotland (%)
Place of birth for the foreign-born population - Other Northern Europe (%)
Place of birth for the foreign-born population - Austria (%)
Place of birth for the foreign-born population - Belgium (%)
Place of birth for the foreign-born population - France (%)
Place of birth for the foreign-born population - Germany (%)
Place of birth for the foreign-born population - Netherlands (%)
Place of birth for the foreign-born population - Switzerland (%)
Place of birth for the foreign-born population - Other Western Europe (%)
Place of birth for the foreign-born population - Greece (%)
Place of birth for the foreign-born population - Italy (%)
Place of birth for the foreign-born population - Portugal (%)
Place of birth for the foreign-born population - Spain (%)
Place of birth for the foreign-born population - Other Southern Europe (%)
Place of birth for the foreign-born population - Albania (%)
Place of birth for the foreign-born population - Belarus (%)
Place of birth for the foreign-born population - Bosnia and Herzegovina (%)
Place of birth for the foreign-born population - Bulgaria (%)
Place of birth for the foreign-born population - Croatia (%)
Place of birth for the foreign-born population - Czechoslovakia (%)
Place of birth for the foreign-born population - Hungary (%)
Place of birth for the foreign-born population - Latvia (%)
Place of birth for the foreign-born population - Lithuania (%)
Place of birth for the foreign-born population - North Macedonia (Macedonia) (%)
Place of birth for the foreign-born population - Moldova (%)
Place of birth for the foreign-born population - Poland (%)
Place of birth for the foreign-born population - Romania (%)
Place of birth for the foreign-born population - Russia (%)
Place of birth for the foreign-born population - Serbia (%)
Place of birth for the foreign-born population - Ukraine (%)
Place of birth for the foreign-born population - Other Eastern Europe (%)
Place of birth for the foreign-born population - China (%)
Place of birth for the foreign-born population - Hong Kong (%)
Place of birth for the foreign-born population - Taiwan (%)
Place of birth for the foreign-born population - Japan (%)
Place of birth for the foreign-born population - Korea (%)
Place of birth for the foreign-born population - Other Eastern Asia (%)
Place of birth for the foreign-born population - Afghanistan (%)
Place of birth for the foreign-born population - Bangladesh (%)
Place of birth for the foreign-born population - India (%)
Place of birth for the foreign-born population - Iran (%)
Place of birth for the foreign-born population - Kazakhstan (%)
Place of birth for the foreign-born population - Nepal (%)
Place of birth for the foreign-born population - Pakistan (%)
Place of birth for the foreign-born population - Sri Lanka (%)
Place of birth for the foreign-born population - Uzbekistan (%)
Place of birth for the foreign-born population - Other South Central Asia (%)
Place of birth for the foreign-born population - Burma (%)
Place of birth for the foreign-born population - Cambodia (%)
Place of birth for the foreign-born population - Indonesia (%)
Place of birth for the foreign-born population - Laos (%)
Place of birth for the foreign-born population - Malaysia (%)
Place of birth for the foreign-born population - Philippines (%)
Place of birth for the foreign-born population - Singapore (%)
Place of birth for the foreign-born population - Thailand (%)
Place of birth for the foreign-born population - Vietnam (%)
Place of birth for the foreign-born population - Other South Eastern Asia (%)
Place of birth for the foreign-born population - Armenia (%)
Place of birth for the foreign-born population - Iraq (%)
Place of birth for the foreign-born population - Israel (%)
Place of birth for the foreign-born population - Jordan (%)
Place of birth for the foreign-born population - Kuwait (%)
Place of birth for the foreign-born population - Lebanon (%)
Place of birth for the foreign-born population - Saudi Arabia (%)
Place of birth for the foreign-born population - Syria (%)
Place of birth for the foreign-born population - Turkey (%)
Place of birth for the foreign-born population - Yemen (%)
Place of birth for the foreign-born population - Other Western Asia (%)
Place of birth for the foreign-born population - Eritrea (%)
Place of birth for the foreign-born population - Ethiopia (%)
Place of birth for the foreign-born population - Kenya (%)
Place of birth for the foreign-born population - Somalia (%)
Place of birth for the foreign-born population - Uganda (%)
Place of birth for the foreign-born population - Zimbabwe (%)
Place of birth for the foreign-born population - Other Eastern Africa (%)
Place of birth for the foreign-born population - Cameroon (%)
Place of birth for the foreign-born population - Congo (%)
Place of birth for the foreign-born population - Democratic Republic of Congo (Zaire) (%)
Place of birth for the foreign-born population - Other Middle Africa (%)
Place of birth for the foreign-born population - Egypt (%)
Place of birth for the foreign-born population - Morocco (%)
Place of birth for the foreign-born population - Sudan (%)
Place of birth for the foreign-born population - Other Northern Africa (%)
Place of birth for the foreign-born population - South Africa (%)
Place of birth for the foreign-born population - Other Southern Africa (%)
Place of birth for the foreign-born population - Cabo Verde (%)
Place of birth for the foreign-born population - Ghana (%)
Place of birth for the foreign-born population - Liberia (%)
Place of birth for the foreign-born population - Nigeria (%)
Place of birth for the foreign-born population - Senegal (%)
Place of birth for the foreign-born population - Sierra Leone (%)
Place of birth for the foreign-born population - Other Western Africa (%)
Place of birth for the foreign-born population - Australia (%)
Place of birth for the foreign-born population - New Zealand (%)
Place of birth for the foreign-born population - Fiji (%)
Place of birth for the foreign-born population - Micronesia (%)
Place of birth for the foreign-born population - Bahamas (%)
Place of birth for the foreign-born population - Barbados (%)
Place of birth for the foreign-born population - Cuba (%)
Place of birth for the foreign-born population - Dominica (%)
Place of birth for the foreign-born population - Dominican Republic (%)
Place of birth for the foreign-born population - Grenada (%)
Place of birth for the foreign-born population - Haiti (%)
Place of birth for the foreign-born population - Jamaica (%)
Place of birth for the foreign-born population - St. Vincent and the Grenadines (%)
Place of birth for the foreign-born population - Trinidad and Tobago (%)
Place of birth for the foreign-born population - West Indies (%)
Place of birth for the foreign-born population - Other Caribbean (%)
Place of birth for the foreign-born population - Belize (%)
Place of birth for the foreign-born population - Costa Rica (%)
Place of birth for the foreign-born population - El Salvador (%)
Place of birth for the foreign-born population - Guatemala (%)
Place of birth for the foreign-born population - Honduras (%)
Place of birth for the foreign-born population - Mexico (%)
Place of birth for the foreign-born population - Nicaragua (%)
Place of birth for the foreign-born population - Panama (%)
Place of birth for the foreign-born population - Other Central America (%)
Place of birth for the foreign-born population - Argentina (%)
Place of birth for the foreign-born population - Bolivia (%)
Place of birth for the foreign-born population - Brazil (%)
Place of birth for the foreign-born population - Chile (%)
Place of birth for the foreign-born population - Colombia (%)
Place of birth for the foreign-born population - Ecuador (%)
Place of birth for the foreign-born population - Guyana (%)
Place of birth for the foreign-born population - Peru (%)
Place of birth for the foreign-born population - Uruguay (%)
Place of birth for the foreign-born population - Venezuela (%)
Place of birth for the foreign-born population - Other South America (%)
Place of birth for the foreign-born population - Canada (%)
Place of birth for the foreign-born population - Other Northern America (%)
Place of birth for the foreign-born population - Other (%)
Latest news about races in Pinehurst, NC collected exclusively by city-data.com from local newspapers, TV, and radio stations
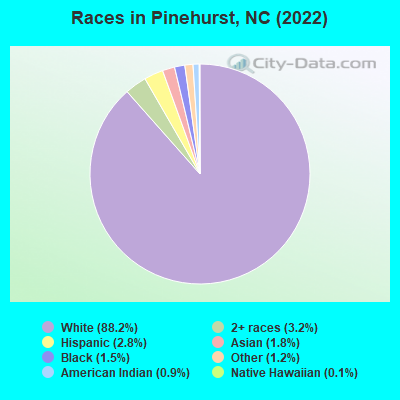
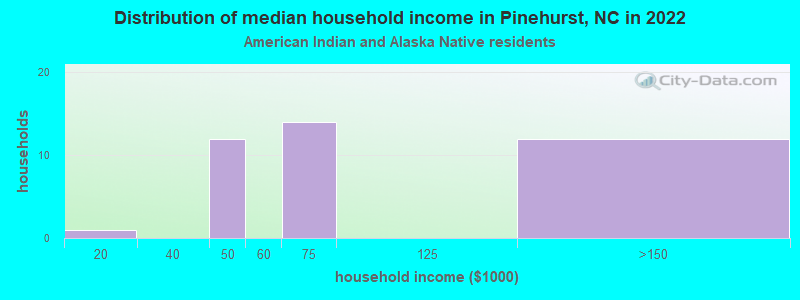
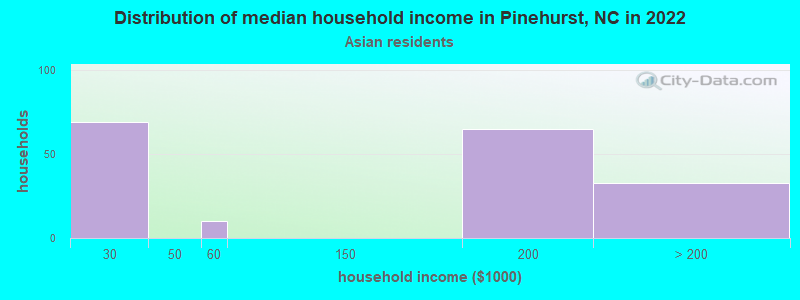
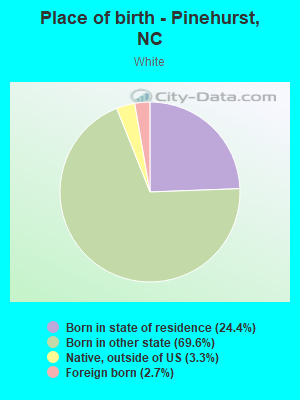
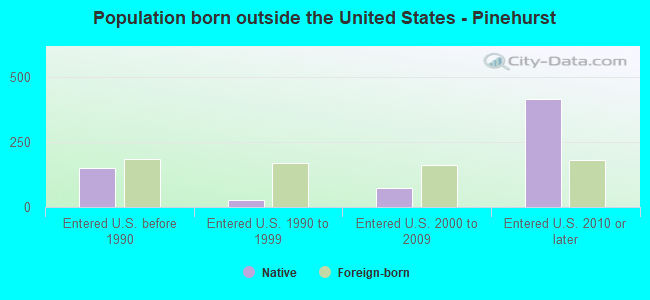
According to 2022 data, the most numerous races in Pinehurst, NC are White alone (16,310 residents), Black alone (269 residents), and Hispanic (517 residents). 95.9% of Pinehurst residents speak English at home. 5.1% of Pinehurst, NC residents are foreign-born (1.9% born in Europe, 1.7% born in Asia, 0.6% born in Latin America, 0.6% born in North America), which is 56.4% less than the foreign-born rate of 8.0% across the entire state of North Carolina.
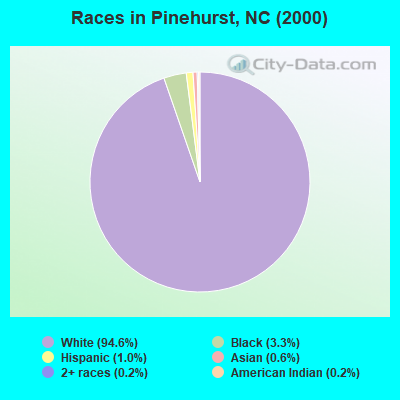
Race distribution in Pinehurst
2000 2022
5,647,155 70.2% White alone 1,723,301 21.4% Black alone 378,963 4.7% Hispanic 112,416 1.4% Asian alone 95,333 1.2% American Indian alone 79,965 1.0% Two or more races 9,015 0.1% Other race alone 3,165 0.04% Native Hawaiian and Other
6,497,519 60.7% White alone 2,155,650 20.1% Black alone 1,114,799 10.4% Hispanic 438,061 4.1% Two or more races 341,052 3.2% Asian alone 91,758 0.9% American Indian alone 50,180 0.5% Other race alone 9,954 0.09% Native Hawaiian and Other
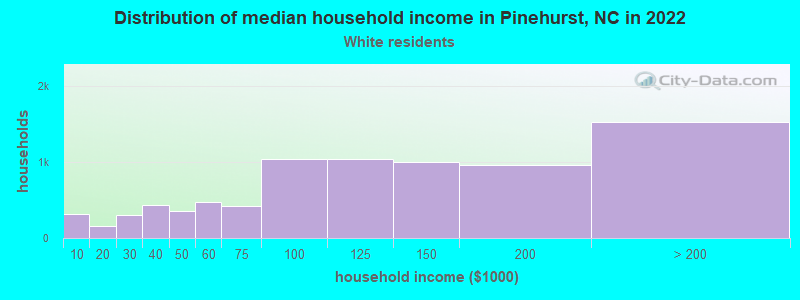
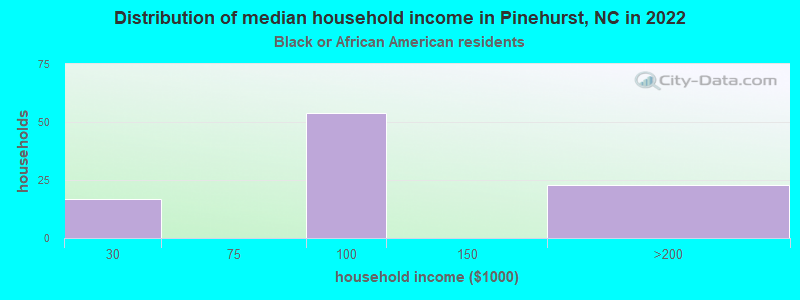
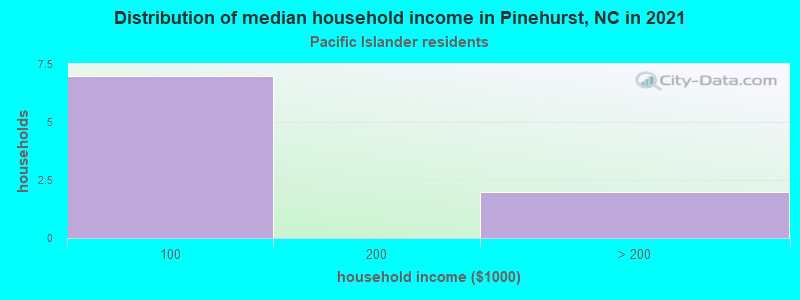
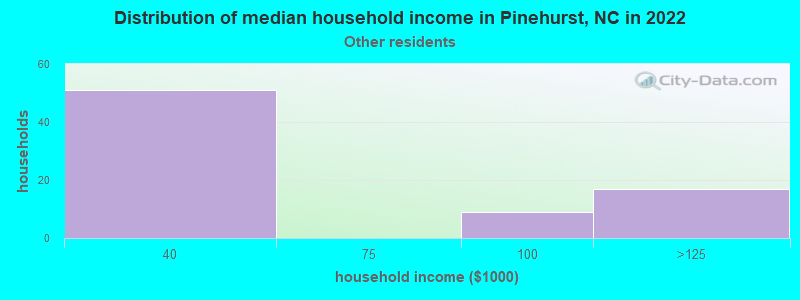
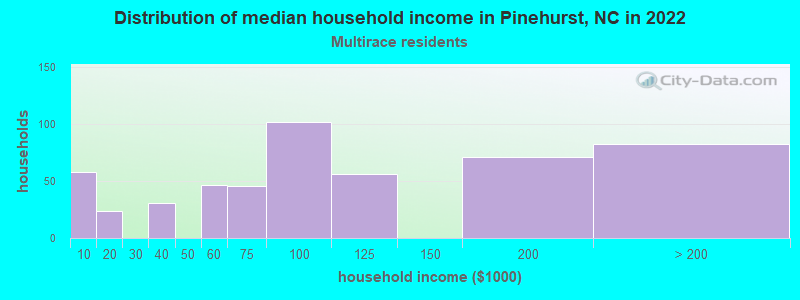
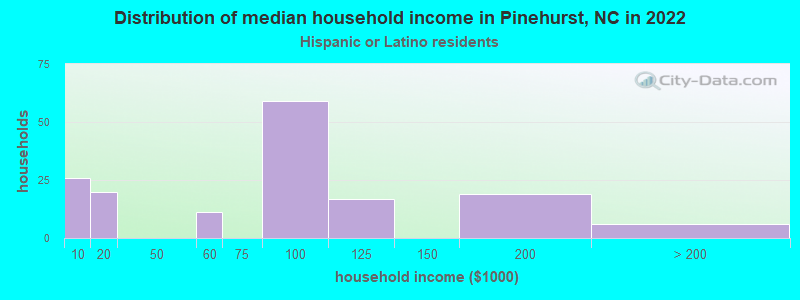
Income and house value in Pinehurst Median household income in 2022 $112,201 White non-Hispanic householders$125,957 Black householders$50,811 American Indian and Alaska Native householders$119,638 Two or more races householders$138,091 Hispanic or Latino race householdersMedian 2022 house value $466,687 White Non-Hispanic householders$519,239 Black or African American householders$282,878 Some other race householders$565,757 Two or more races householders$357,810 Hispanic or Latino householders
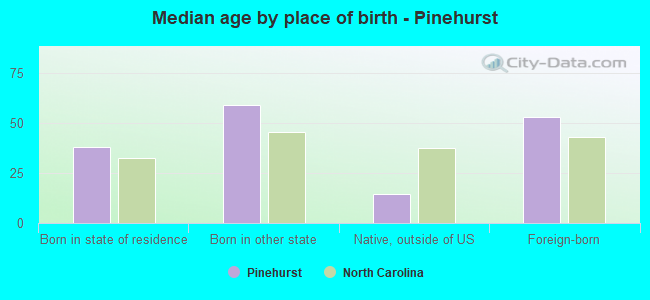
Median age by race in Pinehurst
60.4 Median age for White residents54.9 62.4 54.0 Median age for Black or African American residents73.4 48.1 19.6 Median age for American Indian / Alaska Native residents15.6 46.5 36.2 Median age for Asian residents27.4 55.4 30.4 Median age for Native Hawaiian / Pacific Islander residents32.2 17.9 45.1 Median age for Other race residents60.7 23.0 47.9 Median age for Two or more races residents50.9 46.8 61.6 Median age for White alone residents56.3 63.3 33.8 Median age for Hispanic or Latino residents11.2 49.7
Owner/renter occupied households by race in Pinehurst
House owners and renters - White residents 6,942 87.6% Owner occupied979 12.4% Renter occupiedHouse owners and renters - Black or African American residents 100 100.0% Owner occupiedHouse owners and renters - American Indian / Alaska Native residents 26 62.7% Owner occupied15 37.3% Renter occupiedHouse owners and renters - Asian residents 188 100.0% Owner occupiedHouse owners and renters - Native Hawaiian / Pacific Islander residents 6 100.0% Owner occupiedHouse owners and renters - Other race residents 64 90.1% Owner occupied7 9.9% Renter occupiedHouse owners and renters - Two or more races residents 328 70.3% Owner occupied138 29.7% Renter occupiedHouse owners and renters - White alone residents 6,907 88.1% Owner occupied937 11.9% Renter occupiedHouse owners and renters - Hispanic or Latino residents 114 93.8% Owner occupied8 6.2% Renter occupied
Language usage in Pinehurst
English speakers - Total 95.9% of residents of Pinehurst speak English at home.
0.8% of residents speak Spanish at home 121 85.8% Speak English very well20 14.2% Speak English less than very well3.7% of residents speak other language at home 568 85.8% Speak English very well94 14.2% Speak English less than very well
English speakers - Born in the United States 97.6% of residents of Pinehurst speak English at home.
0.4% of residents speak Spanish at home 56 100.0% Speak English very well1.5% of residents speak other language at home 175 87.1% Speak English very well26 12.9% Speak English less than very well
English speakers - Native, born elsewhere 79.8% of residents of Pinehurst speak English at home.
3.8% of residents speak Spanish at home 22 100.0% Speak English very well1.9% of residents speak other language at home 11 100.0% Speak English very well
English speakers - Foreign-born 61.7% of residents of Pinehurst speak English at home.
3.8% of residents speak Spanish at home 16 51.6% Speak English very well15 48.4% Speak English less than very well50.2% of residents speak other language at home 347 84.0% Speak English very well66 16.0% Speak English less than very well
White (Caucasian) - Speak only English Native:
97.6% (15,148)Foreign-born:
75.5% (346)
White (Caucasian) - Speak another language Native:
2.1% (327)Foreign-born:
28.1% (129)
Asian - Speak only English Native:
80.1% (68)Foreign-born:
22.2% (64)
Asian - Speak another language Native:
19.6% (17)Foreign-born:
77.7% (224)
Native Hawaiian / Pacific Islander - Speak another language Native:
91.8% (16)Foreign-born:
53.9% (4)
Other race - Speak another language Native:
15.1% (28)Foreign-born:
100.0% (15)
Two or more races - Speak only English Native:
93.7% (851)Foreign-born:
91.1% (83)
Two or more races - Speak another language Native:
3.8% (34)Foreign-born:
1.6% (1)
White alone - Speak only English Native:
98.2% (14,972)Foreign-born:
67.2% (350)
White alone - Speak another language Native:
1.8% (281)Foreign-born:
26.1% (136)
Hispanic or Latino - Speak only English Native:
96.3% (412)Foreign-born:
100.0% (63)
Hispanic or Latino - Speak another language Native:
13.0% (56)Foreign-born:
38.5% (24)
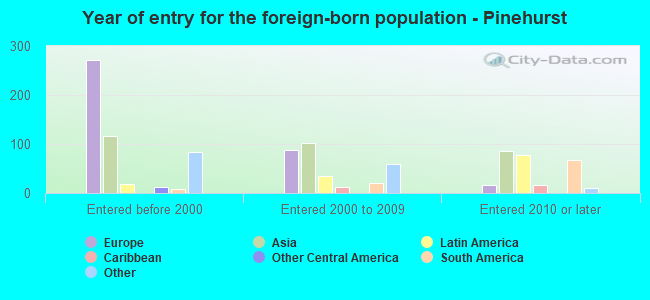
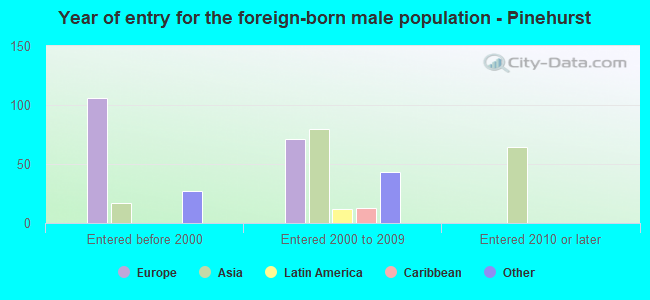
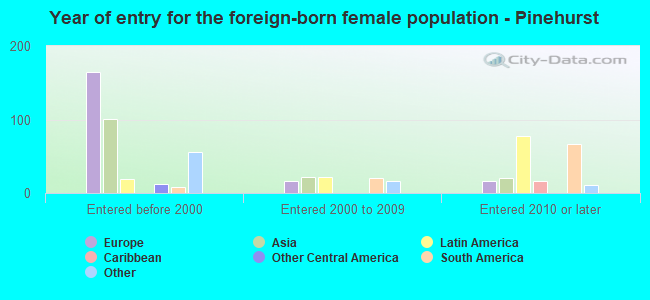
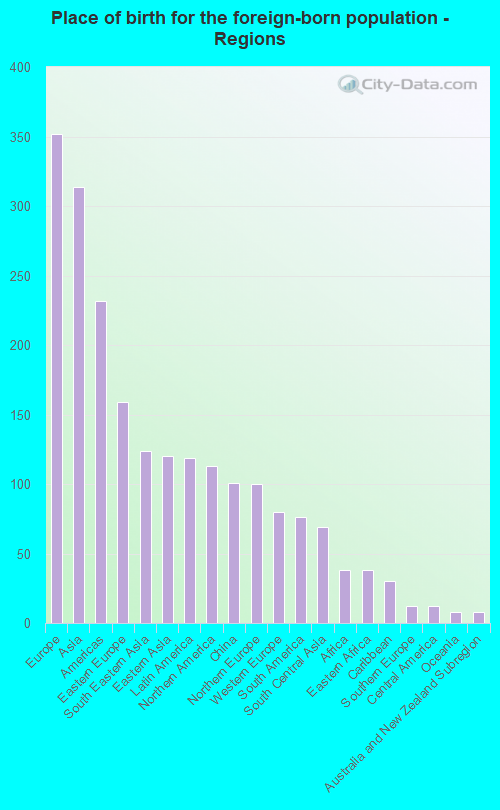
Foreign-born residents in Pinehurst 946 residents are foreign born (1.9% Europe , 1.7% Asia , 0.6% Latin America , 0.6% North America ).
This city:
5.1%North Carolina:
8.3%
Marital status for residents in Pinehurst Marital status - White (Caucasian) population 15 years and over
Males 11.2% Never married76.5% Now married2.8% Separated4.4% Widowed5.1% DivorcedFemales 10.0% Never married64.8% Now married0.9% Separated15.7% Widowed8.5% DivorcedWomen who gave birth in the past 12 months Now married:
100.0% (119)Unmarried:
0.0% (0)
Women who did not give birth in the past 12 months Now married:
63.3% (1,335)Unmarried:
36.7% (773)
Marital status - Black or African American population 15 years and over
Males 25.7% Never married52.2% Now married0.0% Separated4.4% Widowed17.6% DivorcedFemales 30.1% Never married35.3% Now married3.7% Separated18.4% Widowed12.5% DivorcedWomen who did not give birth in the past 12 months Now married:
31.4% (16)Unmarried:
68.6% (35)
Marital status - American Indian / Alaska Native population 15 years and over
Males 66.7% Never married33.3% Now married0.0% Separated0.0% Widowed0.0% DivorcedFemales 34.1% Never married20.9% Now married0.0% Separated6.6% Widowed38.5% DivorcedWomen who did not give birth in the past 12 months Now married:
28.1% (19)Unmarried:
71.9% (49)
Marital status - Asian population 15 years and over
Males 60.7% Never married32.8% Now married6.6% Separated0.0% Widowed0.0% DivorcedFemales 4.7% Never married95.3% Now married0.0% Separated0.0% Widowed0.0% DivorcedWomen who did not give birth in the past 12 months Now married:
87.1% (57)Unmarried:
12.9% (8)
Marital status - Native Hawaiian / Pacific Islander population 15 years and over
Males 0.0% Never married100.0% Now married0.0% Separated0.0% Widowed0.0% DivorcedFemales 0.0% Never married100.0% Now married0.0% Separated0.0% Widowed0.0% DivorcedWomen who did not give birth in the past 12 months Now married:
100.0% (4)Unmarried:
0.0% (0)
Marital status - Other race population 15 years and over
Males 55.0% Never married32.5% Now married0.0% Separated12.5% Widowed0.0% DivorcedFemales 26.3% Never married73.7% Now married0.0% Separated0.0% Widowed0.0% DivorcedWomen who gave birth in the past 12 months Now married:
100.0% (10)Unmarried:
0.0% (0)
Women who did not give birth in the past 12 months Now married:
67.7% (29)Unmarried:
32.3% (14)
Marital status - Two or more races population 15 years and over
Males 27.7% Never married57.7% Now married3.8% Separated6.7% Widowed4.1% DivorcedFemales 0.0% Never married88.6% Now married0.0% Separated11.4% Widowed0.0% DivorcedWomen who gave birth in the past 12 months Now married:
100.0% (26)Unmarried:
0.0% (0)
Women who did not give birth in the past 12 months Now married:
100.0% (137)Unmarried:
0.0% (0)
Marital status - White alone, not Hispanic / Latino population 15 years and over
Males 11.2% Never married76.5% Now married2.8% Separated4.4% Widowed5.1% DivorcedFemales 10.0% Never married64.9% Now married0.8% Separated15.7% Widowed8.5% DivorcedWomen who gave birth in the past 12 months Now married:
100.0% (100)Unmarried:
0.0% (0)
Women who did not give birth in the past 12 months Now married:
63.5% (1,334)Unmarried:
36.5% (766)
Marital status - Hispanic or Latino population 15 years and over
Males 0.0% Never married100.0% Now married0.0% Separated0.0% Widowed0.0% DivorcedFemales 6.4% Never married74.8% Now married5.4% Separated9.4% Widowed4.0% DivorcedWomen who gave birth in the past 12 months Now married:
100.0% (28)Unmarried:
0.0% (0)
Women who did not give birth in the past 12 months Now married:
84.3% (76)Unmarried:
15.7% (14)
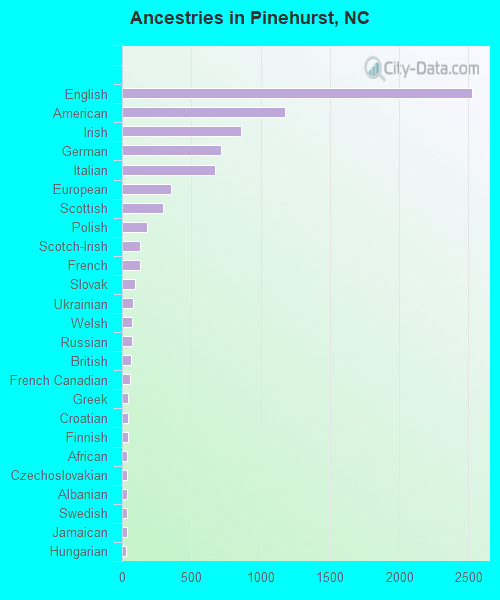
Ancestries in Pinehurst
2,523 27.4% English1,178 12.8% American858 9.3% Irish712 7.7% German673 7.3% Italian357 3.9% European299 3.2% Scottish183 2.0% Polish131 1.4% Scotch-Irish130 1.4% French93 1.0% Slovak83 0.9% Ukrainian73 0.8% Welsh70 0.8% Russian68 0.7% British55 0.6% French Canadian45 0.5% Greek43 0.5% Croatian40 0.4% Finnish37 0.4% African37 0.4% Czechoslovakian36 0.4% Albanian35 0.4% Swedish34 0.4% Jamaican29 0.3% Hungarian26 0.3% Norwegian23 0.2% Latvian18 0.2% Dutch18 0.2% Canadian18 0.2% Slovene18 0.2% Austrian18 0.2% Swiss15 0.2% Czech14 0.2% Eastern European11 0.1% Pennsylvania German11 0.1% Slavic10 0.1% Serbian8 0.09% Lithuanian
Children Nativity (place of birth) in Pinehurst
Children under 6 years - Living with two parents Both parents native 665 100.0% NativeOne native, one foreign-born parent 25 100.0% NativeChildren under 6 years - Living with one parent Native parent 206 100.0% Native
Children 6 to 17 years - Living with two parents Both parents native 1,439 100.0% NativeBoth parents foreign-born 44 100.0% NativeOne native, one foreign-born parent 173 100.0% NativeChildren 6 to 17 years - Living with one parent Native parent 214 100.0% Native