Races in Pewaukee, Wisconsin (WI) Detailed Stats
Ancestries, Foreign-born residents, place of birth
Settings
X


Recent posts about races in Pewaukee, Wisconsin on our local forum with over 2,400,000 registered users:
 | Living in the Pewaukee Area of Wisconsin (8 replies) |
| Pewaukee, Cedarburg, Monomonee Falls feedback (4 replies) |
| two rivers, wi- thoughts for family of lgbt member (48 replies) |
| Moving to Milwaukee with kids from SC. Mequon or Brookfield? (10 replies) |
| Relocation to Milwaukee area -- guidance? (11 replies) |
| Whats Milwaukee Like (111 replies) |
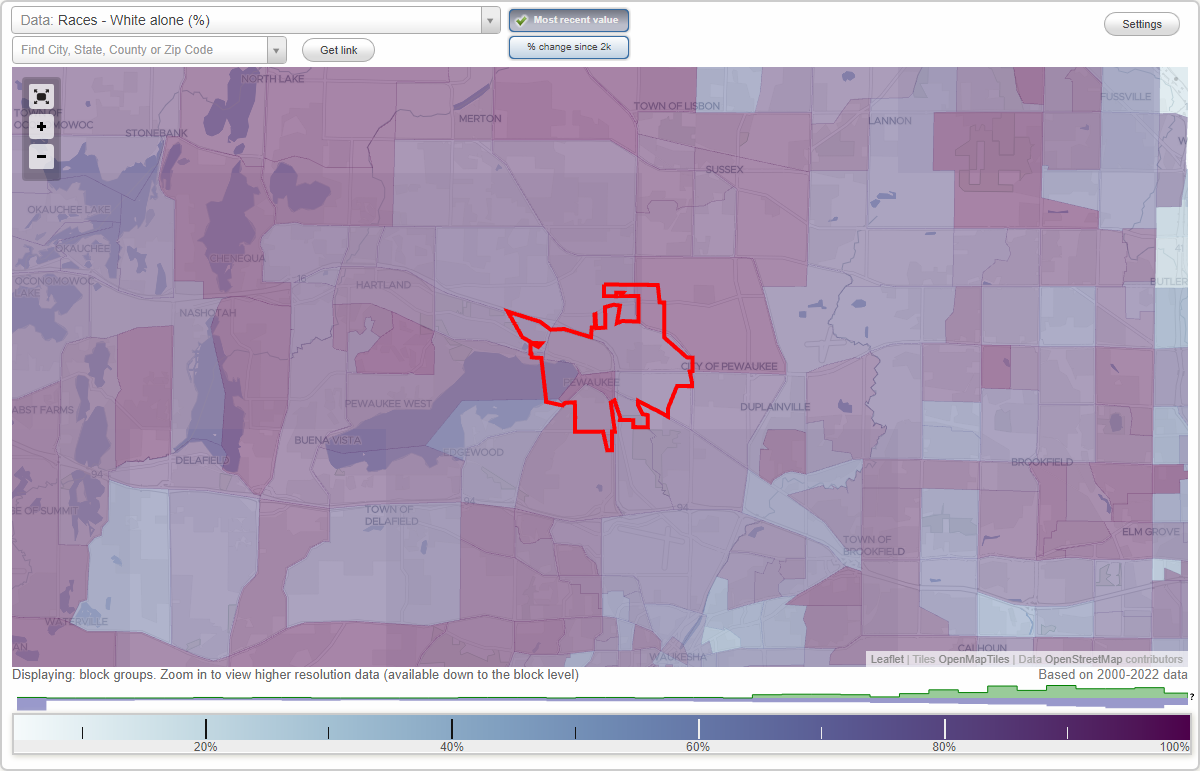
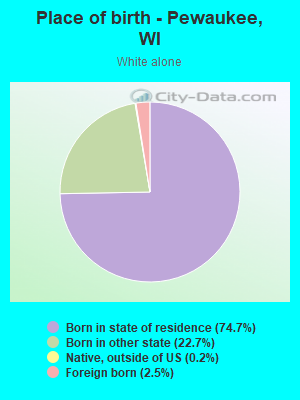
According to 2022 data, the most numerous races in Pewaukee, WI are White alone (13,707 residents), Hispanic (780 residents), and Black alone (188 residents). 92.8% of Pewaukee residents speak English at home. 4.7% of Pewaukee, WI residents are foreign-born (2.0% born in Europe, 2.0% born in Asia, 0.6% born in Latin America), which is 6.7% less than the foreign-born rate of 5.0% across the entire state of Wisconsin.
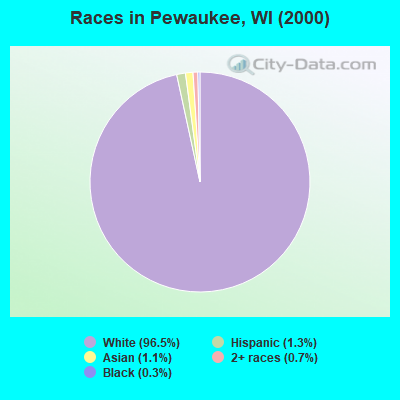
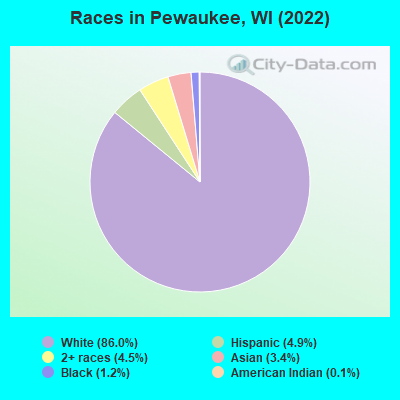
Race distribution in Pewaukee
2000
2022

- 11,36996.5%White alone
- 1531.3%Hispanic
- 1241.1%Asian alone
- 860.7%Two or more races
- 380.3%Black alone
- 90.08%American Indian alone
- 30.03%Other race alone
- 10.01%Native Hawaiian and Other
Pacific Islander alone
-
- 13,70786.0%White alone
- 7804.9%Hispanic
- 7254.5%Two or more races
- 5473.4%Asian alone
- 1881.2%Black alone
- 200.1%American Indian alone
- 40.03%Other race alone
2000
2022
-
- 4,681,63087.3%White alone
- 300,2455.6%Black alone
- 192,9213.6%Hispanic
- 87,9951.6%Asian alone
- 51,9211.0%Two or more races
- 43,9800.8%American Indian alone
- 3,6370.07%Other race alone
- 1,3460.03%Native Hawaiian and Other
Pacific Islander alone

-
- 4,654,03179.0%White alone
- 447,0227.6%Hispanic
- 345,6785.9%Black alone
- 217,5323.7%Two or more races
- 172,2422.9%Asian alone
- 33,7620.6%American Indian alone
- 19,6800.3%Other race alone
- 2,5920.04%Native Hawaiian and Other
Pacific Islander alone

Income and house value in Pewaukee
- Median household income in 2022
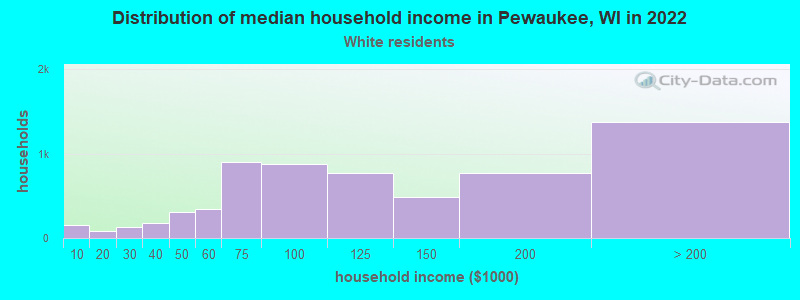
- $105,827White non-Hispanic householders
- $186,672Asian householders
- $160,370Two or more races householders
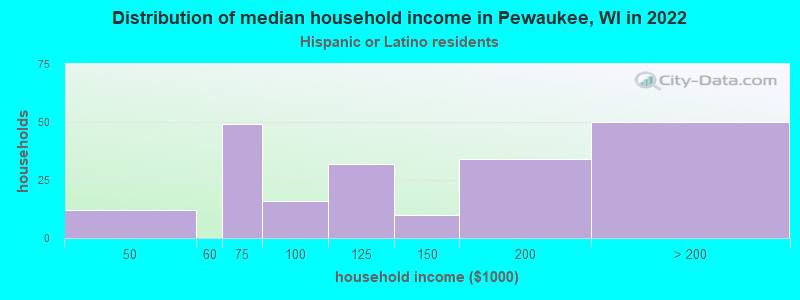
- $95,149Hispanic or Latino race householders
- Median 2022 house value
- $436,369White Non-Hispanic householders
- $588,926Black or African American householders
- $40,086American Indian or Alaska Native householders
- $670,932Asian householders
- $339,474Some other race householders
- $396,741Two or more races householders
- $365,130Hispanic or Latino householders
Household income for White non-Hispanic householders
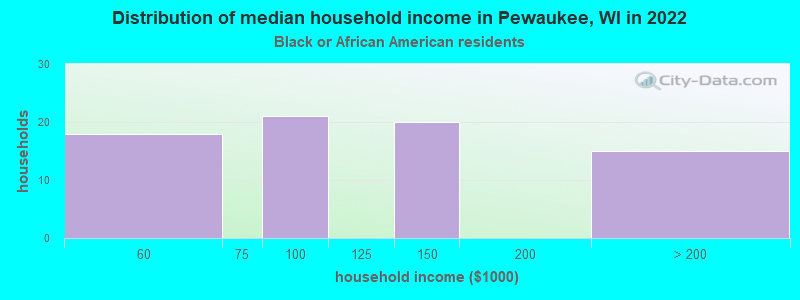
Household income for Black householders
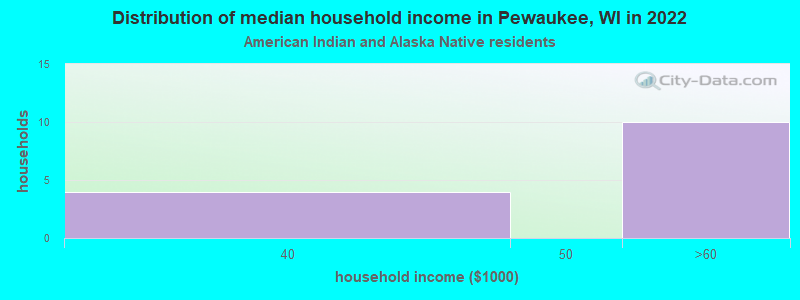
Household income for American Indian and Alaska Native householders
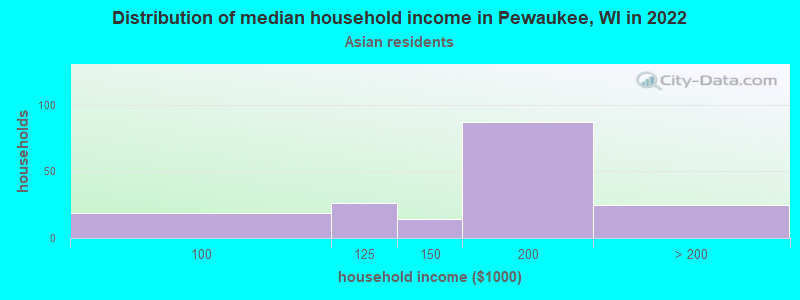
Household income for Asian householders
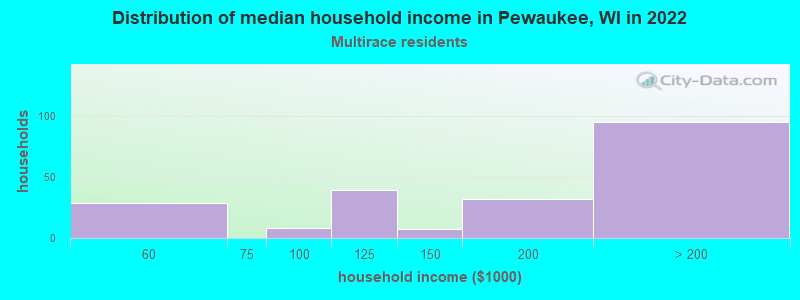
Household income for Two or more races householders
Household income for Hispanic or Latino race householders
Median age by race in Pewaukee
- 47.8Median age for White residents
- 44.9Males
- 50.1Females
- 47.1Median age for Black or African American residents
- 39.3Males
- 46.3Females
- 61.6Median age for American Indian / Alaska Native residents
- -1,272,916,665.4Males
- -689,393,938.7Females
- 38.1Median age for Asian residents
- 34.5Males
- 40.2Females
- -825,688,072.6Median age for Native Hawaiian / Pacific Islander residents
- -862,745,097.2Males
- -666,666,666.0Females
- -660,240,963.2Median age for Other race residents
- -672,116,257.3Males
- -668,202,764.3Females
- 15.3Median age for Two or more races residents
- 22.3Males
- 9.3Females
- 48.6Median age for White alone residents
- 45.3Males
- 51.6Females
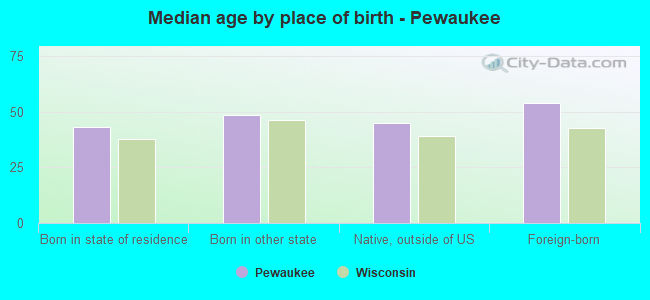
- 25.8Median age for Hispanic or Latino residents
- 27.9Males
- 17.4Females
Owner/renter occupied households by race in Pewaukee
- House owners and renters - White residents
- 5,42185.3%Owner occupied
- 93214.7%Renter occupied
- House owners and renters - Black or African American residents
- 7591.2%Owner occupied
- 78.8%Renter occupied
- House owners and renters - American Indian / Alaska Native residents
- 538.9%Owner occupied
- 761.1%Renter occupied
- House owners and renters - Asian residents
- 15592.3%Owner occupied
- 137.7%Renter occupied
- House owners and renters - Other race residents
- 31100.0%Owner occupied
- House owners and renters - Two or more races residents
- 15972.6%Owner occupied
- 6027.4%Renter occupied
- House owners and renters - White alone residents
- 5,34885.0%Owner occupied
- 94015.0%Renter occupied
- House owners and renters - Hispanic or Latino residents
- 15576.6%Owner occupied
- 4723.4%Renter occupied
Language usage in Pewaukee
- English speakers - Total
- 92.8% of residents of Pewaukee speak English at home.
- 2.0% of residents speak Spanish at home
- 20267.3%Speak English very well
- 9832.7%Speak English less than very well
- 5.2% of residents speak other language at home
- 60377.5%Speak English very well
- 17522.5%Speak English less than very well
- English speakers - Born in the United States
- 94.1% of residents of Pewaukee speak English at home.
- 4.3% of residents speak Spanish at home
- 10063.7%Speak English very well
- 5736.3%Speak English less than very well
- 1.8% of residents speak other language at home
- 64100.0%Speak English very well
- English speakers - Native, born elsewhere
- 22.2% of residents of Pewaukee speak English at home.
- 65.1% of residents speak Spanish at home
- 819.5%Speak English very well
- 3380.5%Speak English less than very well
- 49.2% of residents speak other language at home
- 31100.0%Speak English very well
- English speakers - Foreign-born
- 21.9% of residents of Pewaukee speak English at home.
- 8.2% of residents speak Spanish at home
- 4777.0%Speak English very well
- 1423.0%Speak English less than very well
- 72.2% of residents speak other language at home
- 40675.5%Speak English very well
- 13224.5%Speak English less than very well
White (Caucasian) - Speak only English
| Native: | 97.9% (12,713) |
| Foreign-born: | 24.7% (87) |
White (Caucasian) - Speak another language
| Native: | 2.1% (277) |
| Foreign-born: | 76.0% (269) |
Black or African American - Speak only English
| Native: | 91.3% (112) |
| Foreign-born: | 76.6% (14) |
Asian - Speak only English
| Native: | 70.7% (140) |
| Foreign-born: | 14.0% (45) |
Asian - Speak another language
| Native: | 31.5% (62) |
| Foreign-born: | 86.4% (275) |
White alone - Speak only English
| Native: | 97.9% (12,454) |
| Foreign-born: | 28.0% (96) |
White alone - Speak another language
| Native: | 2.1% (273) |
| Foreign-born: | 73.4% (252) |
Hispanic or Latino - Speak another language
| Native: | 22.1% (152) |
| Foreign-born: | 100.0% (62) |
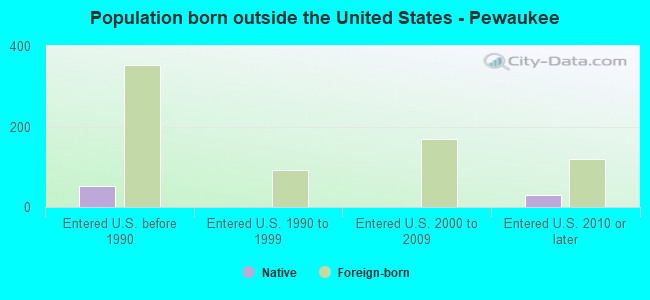
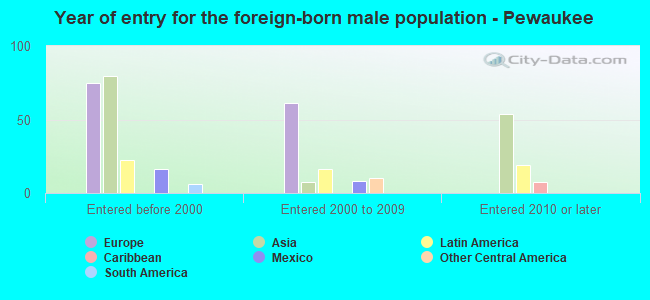
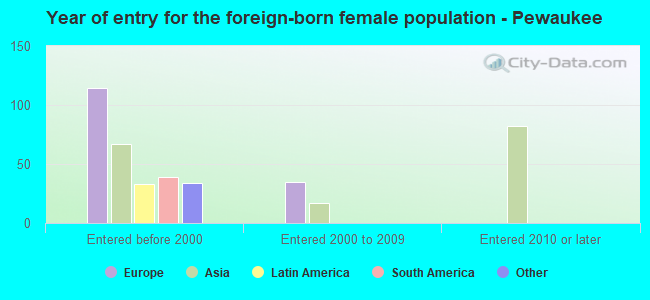
Foreign-born residents in Pewaukee
747 residents are foreign born (2.0% Europe, 2.0% Asia, 0.6% Latin America).
| This city: | 4.7% |
| Wisconsin: | 5.0% |
Marital status for residents in Pewaukee
Marital status - White (Caucasian) population 15 years and over
- Males
- 23.4%Never married
- 69.4%Now married
- 0.2%Separated
- 2.1%Widowed
- 5.0%Divorced
- Females
- 14.2%Never married
- 66.1%Now married
- 0.0%Separated
- 6.0%Widowed
- 13.7%Divorced
Women who gave birth in the past 12 months
| Now married: | 85.6% (143) |
| Unmarried: | 14.4% (24) |
Women who did not give birth in the past 12 months
| Now married: | 66.4% (1,552) |
| Unmarried: | 33.6% (786) |
Marital status - Black or African American population 15 years and over
- Males
- 19.7%Never married
- 80.3%Now married
- 0.0%Separated
- 0.0%Widowed
- 0.0%Divorced
- Females
- 0.0%Never married
- 84.2%Now married
- 0.0%Separated
- 0.0%Widowed
- 15.8%Divorced
Women who did not give birth in the past 12 months
| Now married: | 76.5% (38) |
| Unmarried: | 23.5% (12) |
Marital status - American Indian / Alaska Native population 15 years and over
- Males
- 100.0%Never married
- 0.0%Now married
- 0.0%Separated
- 0.0%Widowed
- 0.0%Divorced
- Females
- 0.0%Never married
- 66.7%Now married
- 0.0%Separated
- 0.0%Widowed
- 33.3%Divorced
Women who did not give birth in the past 12 months
| Now married: | 100.0% (8) |
| Unmarried: | 0.0% (0) |
Marital status - Asian population 15 years and over
- Males
- 14.1%Never married
- 85.9%Now married
- 0.0%Separated
- 0.0%Widowed
- 0.0%Divorced
- Females
- 13.0%Never married
- 79.9%Now married
- 0.0%Separated
- 7.1%Widowed
- 0.0%Divorced
Women who did not give birth in the past 12 months
| Now married: | 80.6% (109) |
| Unmarried: | 19.4% (26) |
Marital status - Two or more races population 15 years and over
- Males
- 16.9%Never married
- 48.9%Now married
- 0.0%Separated
- 0.0%Widowed
- 34.2%Divorced
- Females
- 34.7%Never married
- 57.7%Now married
- 0.0%Separated
- 0.0%Widowed
- 7.7%Divorced
Women who gave birth in the past 12 months
| Now married: | 100.0% (4) |
| Unmarried: | 0.0% (0) |
Women who did not give birth in the past 12 months
| Now married: | 56.3% (95) |
| Unmarried: | 43.7% (74) |
Marital status - White alone, not Hispanic / Latino population 15 years and over
- Males
- 22.5%Never married
- 70.1%Now married
- 0.2%Separated
- 2.1%Widowed
- 5.2%Divorced
- Females
- 14.0%Never married
- 66.2%Now married
- 0.0%Separated
- 6.1%Widowed
- 13.7%Divorced
Women who gave birth in the past 12 months
| Now married: | 89.2% (145) |
| Unmarried: | 10.8% (18) |
Women who did not give birth in the past 12 months
| Now married: | 66.2% (1,535) |
| Unmarried: | 33.8% (784) |
Marital status - Hispanic or Latino population 15 years and over
- Males
- 30.5%Never married
- 42.2%Now married
- 0.0%Separated
- 0.0%Widowed
- 27.3%Divorced
- Females
- 45.0%Never married
- 38.4%Now married
- 0.0%Separated
- 0.0%Widowed
- 16.6%Divorced
Women who gave birth in the past 12 months
| Now married: | 0.0% (0) |
| Unmarried: | 100.0% (7) |
Women who did not give birth in the past 12 months
| Now married: | 45.1% (44) |
| Unmarried: | 54.9% (54) |
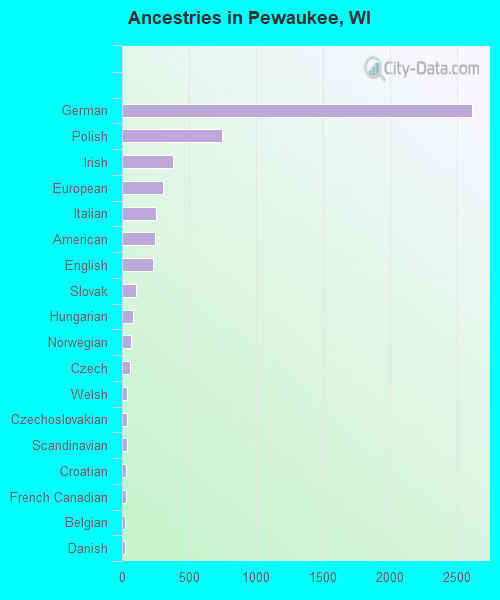
Ancestries in Pewaukee

- 2,60939.8%German
- 74311.3%Polish
- 3845.9%Irish
- 3084.7%European
- 2573.9%Italian
- 2473.8%American
- 2293.5%English
- 1061.6%Slovak
- 791.2%Hungarian
- 691.1%Norwegian
- 600.9%Czech
- 390.6%Welsh
- 380.6%Czechoslovakian
- 370.6%Scandinavian
- 320.5%Croatian
- 320.5%French Canadian
- 260.4%Belgian
- 250.4%Danish
- 220.3%Dutch
- 170.3%Finnish
- 160.2%Austrian
- 120.2%Latvian
- 100.2%Maltese
- 100.2%Swiss
- 80.1%Lithuanian
- 70.1%Greek
- 60.09%Scotch-Irish
- 40.06%Northern European
- 40.06%Russian
- 40.06%Serbian
- 30.05%Scottish
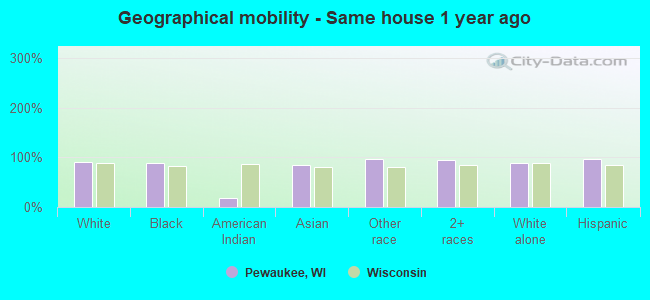
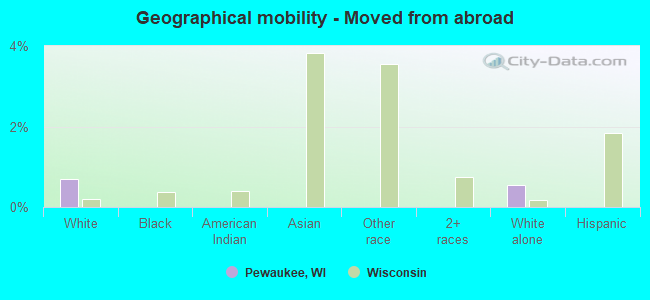
Geographical mobility in Pewaukee

- Same house 1 year ago
- 12,44789.6%White (Caucasian)
- 14188.8%Black or African American
- 418.5%American Indian / Alaska Native
- 46584.5%Asian
- 1896.0%Other race
- 98494.9%Two or more races
- 12,13389.4%White alone, not Hispanic / Latino
- 73996.2%Hispanic or Latino
-
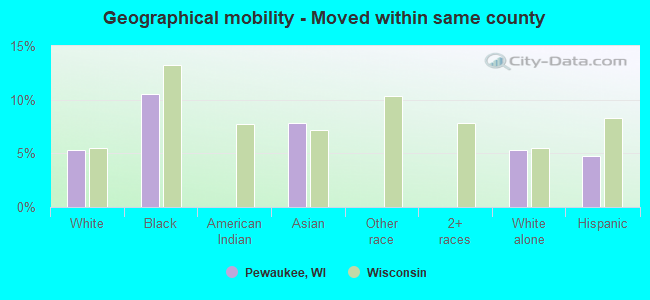
- Moved within same county
- 7365.3%White / Caucasian
- 1710.5%Black or African American
- 437.9%Asian
- 7265.3%White alone, not Hispanic / Latino
- 364.7%Hispanic or Latino
-
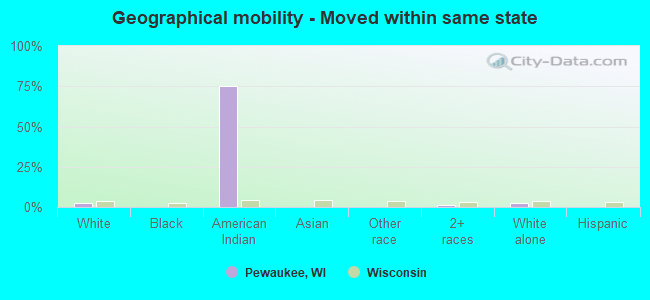
- Moved within same state
- 3452.5%White / Caucasian
- 1775.1%American Indian / Alaska Native
- 151.4%Two or more races
- 3502.6%White alone, not Hispanic / Latino
-
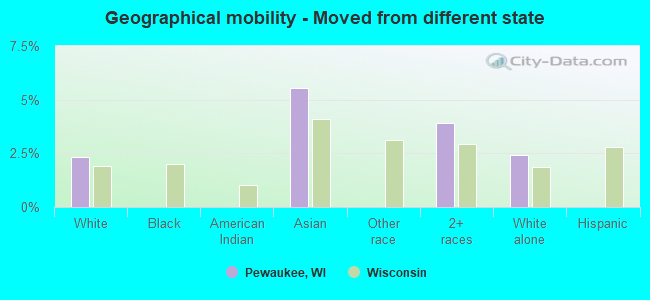
- Moved from different state
- 3272.4%White / Caucasian
- 305.5%Asian
- 413.9%Two or more races
- 3302.4%White alone, not Hispanic / Latino
-
- Moved from abroad
- 960.7%White
- 750.5%White alone, not Hispanic / Latino
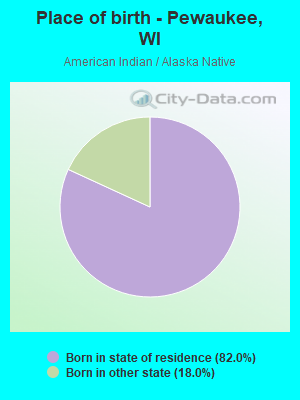
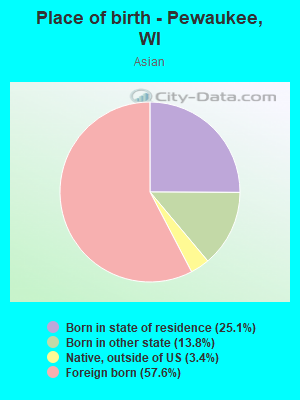
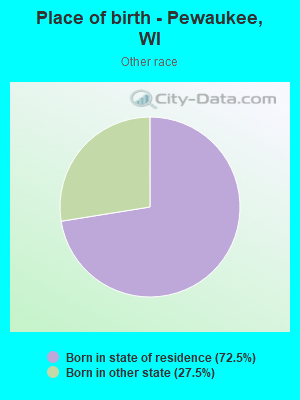
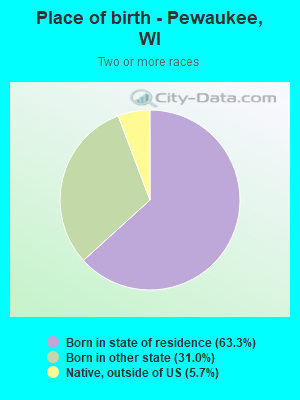
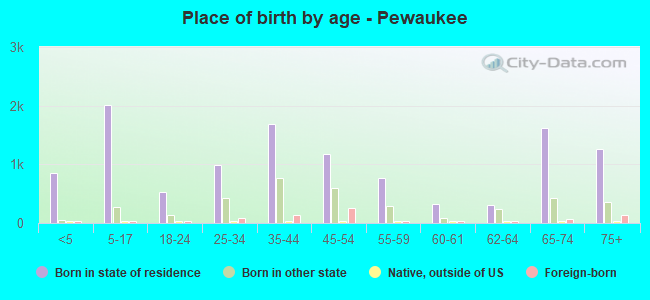
Children Nativity (place of birth) in Pewaukee
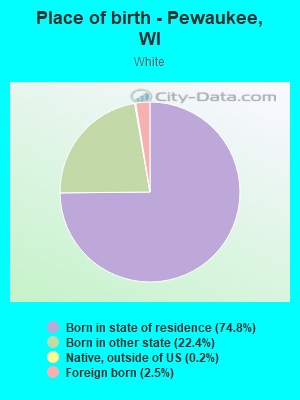
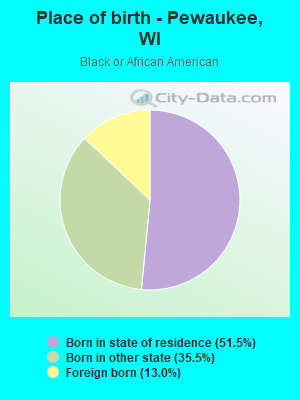
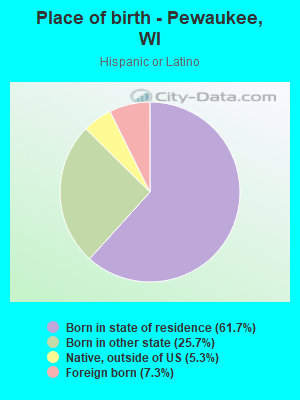
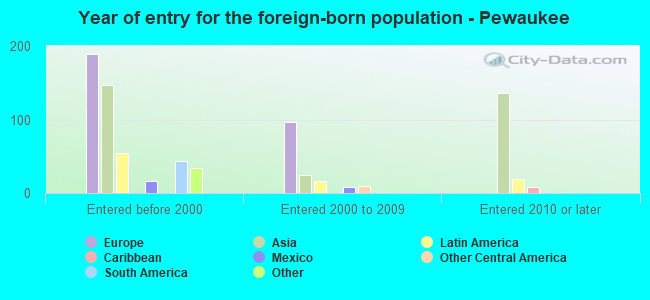
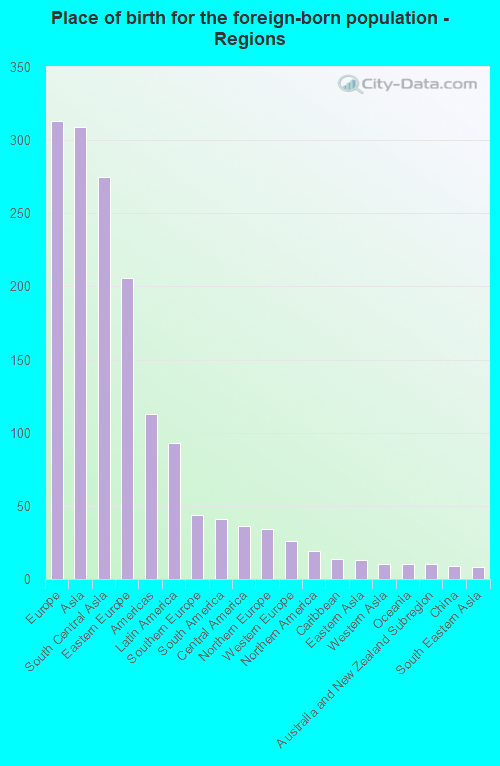
Place of birth for residents in Pewaukee
![Place of birth for the foreign-born population - Regions]()
- 313Europe
- 309Asia
- 275South Central Asia
- 206Eastern Europe
- 113Americas
- 93Latin America
- 44Southern Europe
- 41South America
- 36Central America
- 34Northern Europe
- 26Western Europe
- 19Northern America
- 14Caribbean
- 13Eastern Asia
- 10Western Asia
- 10Oceania
- 10Australia and New Zealand Subregion
- 9China
- 8South Eastern Asia
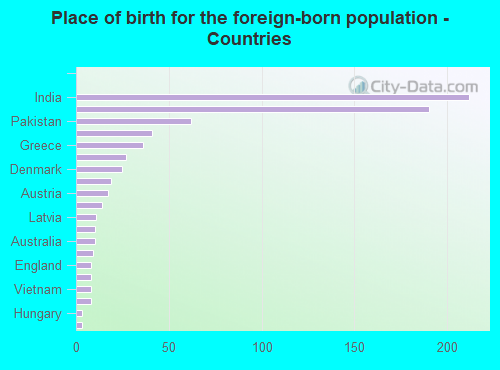
![Place of birth for the foreign-born population - Countries]()
- 212India
- 190Poland
- 62Pakistan
- 41Argentina
- 36Greece
- 27Mexico
- 25Denmark
- 19Canada
- 17Austria
- 14Jamaica
- 11Latvia
- 10Israel
- 10Australia
- 9China
- 8England
- 8Germany
- 8Vietnam
- 8Guatemala
- 3Hungary
- 3Japan
Grandparents responsible for own grandchildren in Pewaukee
Zip codes: 53702.