Races in Petersburg, Virginia (VA) Detailed Stats
Data:
Races - White alone (%)
Races - White alone (% change since 2000)
Races - Black alone (%)
Races - Black alone (% change since 2000)
Races - American Indian alone (%)
Races - American Indian alone (% change since 2000)
Races - Asian alone (%)
Races - Asian alone (% change since 2000)
Races - Hispanic (%)
Races - Hispanic (% change since 2000)
Races - Native Hawaiian and Other Pacific Islander alone (%)
Races - Native Hawaiian and Other Pacific Islander alone (% change since 2000)
Races - Two or more races(%)
Races - Two or more races(% change since 2000)
Races - Other race alone (%)
Races - Other race alone (% change since 2000)
Racial diversity
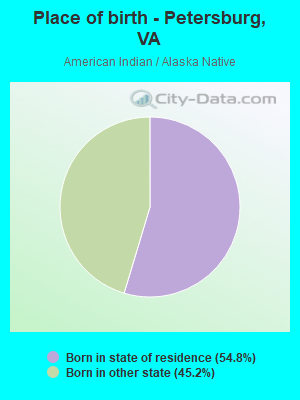
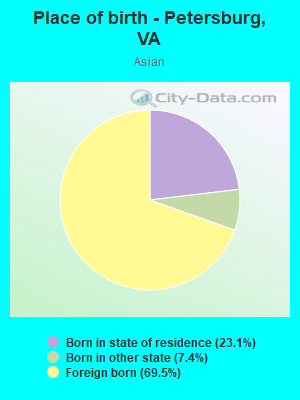
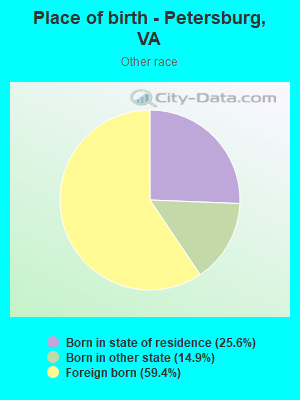
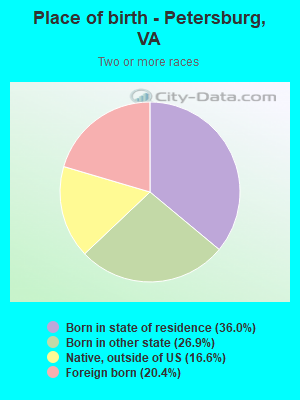
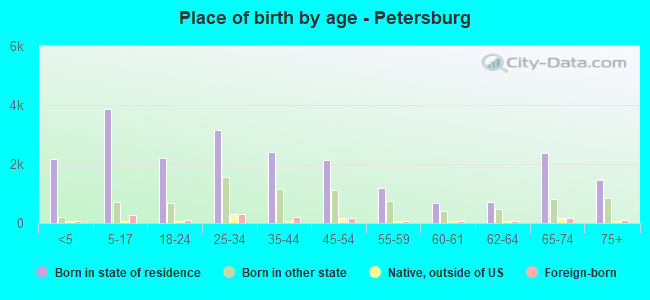
Place of birth - Born in state of residence (%)
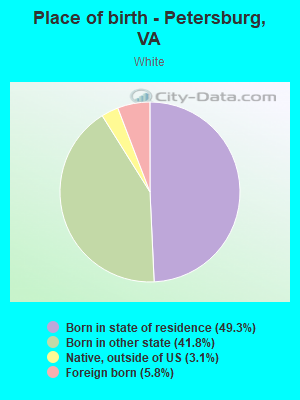
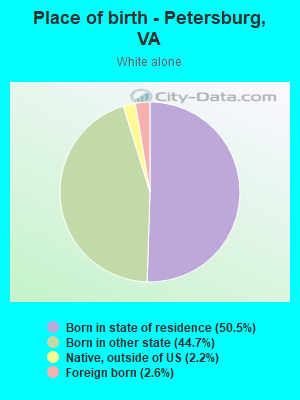
Place of birth - Born in state of residence (%) - White
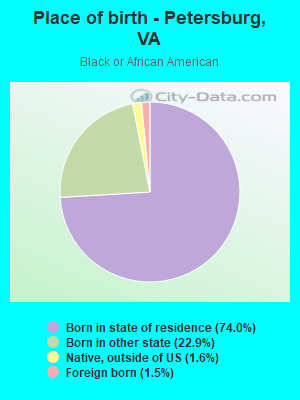
Place of birth - Born in state of residence (%) - Black or African American
Place of birth - Born in state of residence (%) - Asian
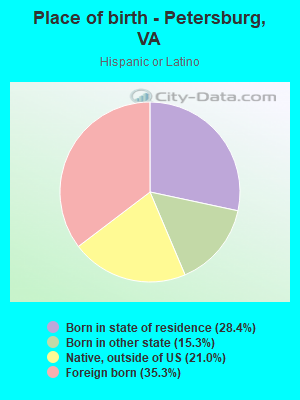
Place of birth - Born in state of residence (%) - Hispanic or Latino
Place of birth - Born in state of residence (%) - American Indian and Alaska Native
Place of birth - Born in state of residence (%) - Multirace
Place of birth - Born in state of residence (%) - Other Race
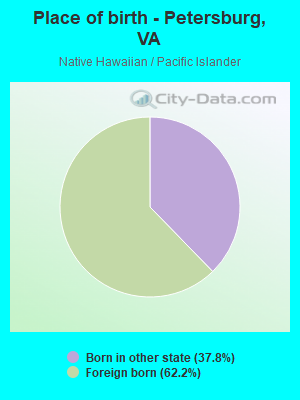
Place of birth - Born in other state (%)
Place of birth - Born in other state (%) - White
Place of birth - Born in other state (%) - Black or African American
Place of birth - Born in other state (%) - Asian
Place of birth - Born in other state (%) - Hispanic or Latino
Place of birth - Born in other state (%) - American Indian and Alaska Native
Place of birth - Born in other state (%) - Multirace
Place of birth - Born in other state (%) - Other Race
Place of birth - Native, outside of US (%)
Place of birth - Native, outside of US (%) - White
Place of birth - Native, outside of US (%) - Black or African American
Place of birth - Native, outside of US (%) - Asian
Place of birth - Native, outside of US (%) - Hispanic or Latino
Place of birth - Native, outside of US (%) - American Indian and Alaska Native
Place of birth - Native, outside of US (%) - Multirace
Place of birth - Native, outside of US (%) - Other Race
Place of birth - Foreign born (%)
Place of birth - Foreign born (%) - White
Place of birth - Foreign born (%) - Black or African American
Place of birth - Foreign born (%) - Asian
Place of birth - Foreign born (%) - Hispanic or Latino
Place of birth - Foreign born (%) - American Indian and Alaska Native
Place of birth - Foreign born (%) - Multirace
Place of birth - Foreign born (%) - Other Race
Residents speaking English at home (%)
Residents speaking English at home - Born in the United States (%)
Residents speaking English at home - Native, born elsewhere (%)
Residents speaking English at home - Foreign born (%)
Residents speaking Spanish at home (%)
Residents speaking Spanish at home - Born in the United States (%)
Residents speaking Spanish at home - Native, born elsewhere (%)
Residents speaking Spanish at home - Foreign born (%)
Residents speaking other language at home (%)
Residents speaking other language at home - Born in the United States (%)
Residents speaking other language at home - Native, born elsewhere (%)
Residents speaking other language at home - Foreign born (%)
Marital status - Never married (%)
Marital status - Now married (%)
Marital status - Separated (%)
Marital status - Widowed (%)
Marital status - Divorced (%)
Ancestries Reported - Arab (%)
Ancestries Reported - Czech (%)
Ancestries Reported - Danish (%)
Ancestries Reported - Dutch (%)
Ancestries Reported - English (%)
Ancestries Reported - French (%)
Ancestries Reported - French Canadian (%)
Ancestries Reported - German (%)
Ancestries Reported - Greek (%)
Ancestries Reported - Hungarian (%)
Ancestries Reported - Irish (%)
Ancestries Reported - Italian (%)
Ancestries Reported - Lithuanian (%)
Ancestries Reported - Norwegian (%)
Ancestries Reported - Polish (%)
Ancestries Reported - Portuguese (%)
Ancestries Reported - Russian (%)
Ancestries Reported - Scotch-Irish (%)
Ancestries Reported - Scottish (%)
Ancestries Reported - Slovak (%)
Ancestries Reported - Subsaharan African (%)
Ancestries Reported - Swedish (%)
Ancestries Reported - Swiss (%)
Ancestries Reported - Ukrainian (%)
Ancestries Reported - United States (%)
Ancestries Reported - Welsh (%)
Ancestries Reported - West Indian (%)
Ancestries Reported - Other (%)
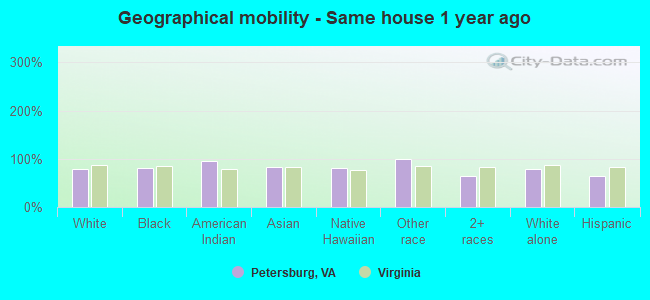
Geographical mobility - Same house 1 year ago (%)
Geographical mobility - Same house 1 year ago (%) - White
Geographical mobility - Same house 1 year ago (%) - Black or African American
Geographical mobility - Same house 1 year ago (%) - Asian
Geographical mobility - Same house 1 year ago (%) - Hispanic or Latino
Geographical mobility - Same house 1 year ago (%) - American Indian and Alaska Native
Geographical mobility - Same house 1 year ago (%) - Multirace
Geographical mobility - Same house 1 year ago (%) - Other Race
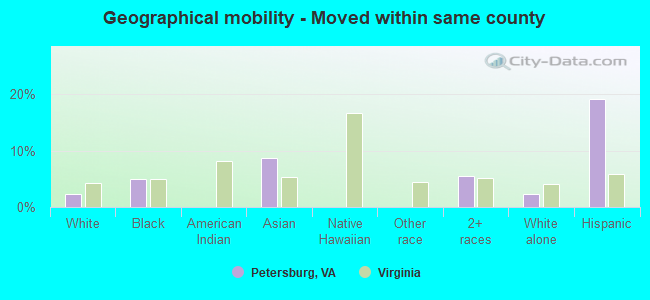
Geographical mobility - Moved within same county (%)
Geographical mobility - Moved within same county (%) - White
Geographical mobility - Moved within same county (%) - Black or African American
Geographical mobility - Moved within same county (%) - Asian
Geographical mobility - Moved within same county (%) - Hispanic or Latino
Geographical mobility - Moved within same county (%) - American Indian and Alaska Native
Geographical mobility - Moved within same county (%) - Multirace
Geographical mobility - Moved within same county (%) - Other Race
Geographical mobility - Moved from different county within same state (%)
Geographical mobility - Moved from different county within same state (%) - White
Geographical mobility - Moved from different county within same state (%) - Black or African American
Geographical mobility - Moved from different county within same state (%) - Asian
Geographical mobility - Moved from different county within same state (%) - Hispanic or Latino
Geographical mobility - Moved from different county within same state (%) - American Indian and Alaska Native
Geographical mobility - Moved from different county within same state (%) - Multirace
Geographical mobility - Moved from different county within same state (%) - Other Race
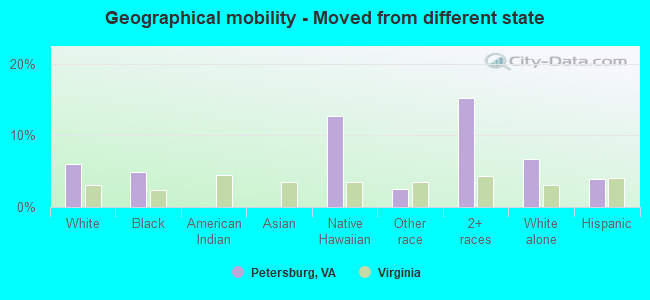
Geographical mobility - Moved from different state (%)
Geographical mobility - Moved from different state (%) - White
Geographical mobility - Moved from different state (%) - Black or African American
Geographical mobility - Moved from different state (%) - Asian
Geographical mobility - Moved from different state (%) - Hispanic or Latino
Geographical mobility - Moved from different state (%) - American Indian and Alaska Native
Geographical mobility - Moved from different state (%) - Multirace
Geographical mobility - Moved from different state (%) - Other Race
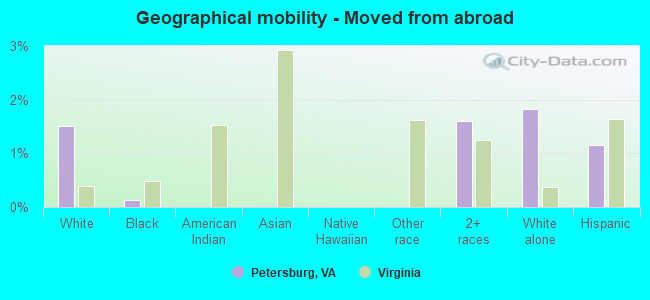
Geographical mobility - Moved from abroad (%)
Geographical mobility - Moved from abroad (%) - White
Geographical mobility - Moved from abroad (%) - Black or African American
Geographical mobility - Moved from abroad (%) - Asian
Geographical mobility - Moved from abroad (%) - Hispanic or Latino
Geographical mobility - Moved from abroad (%) - American Indian and Alaska Native
Geographical mobility - Moved from abroad (%) - Multirace
Geographical mobility - Moved from abroad (%) - Other Race
Place of birth for the foreign-born population - Ireland (%)
Place of birth for the foreign-born population - Denmark (%)
Place of birth for the foreign-born population - Norway (%)
Place of birth for the foreign-born population - Sweden (%)
Place of birth for the foreign-born population - United Kingdom (%)
Place of birth for the foreign-born population - England (%)
Place of birth for the foreign-born population - Scotland (%)
Place of birth for the foreign-born population - Other Northern Europe (%)
Place of birth for the foreign-born population - Austria (%)
Place of birth for the foreign-born population - Belgium (%)
Place of birth for the foreign-born population - France (%)
Place of birth for the foreign-born population - Germany (%)
Place of birth for the foreign-born population - Netherlands (%)
Place of birth for the foreign-born population - Switzerland (%)
Place of birth for the foreign-born population - Other Western Europe (%)
Place of birth for the foreign-born population - Greece (%)
Place of birth for the foreign-born population - Italy (%)
Place of birth for the foreign-born population - Portugal (%)
Place of birth for the foreign-born population - Spain (%)
Place of birth for the foreign-born population - Other Southern Europe (%)
Place of birth for the foreign-born population - Albania (%)
Place of birth for the foreign-born population - Belarus (%)
Place of birth for the foreign-born population - Bosnia and Herzegovina (%)
Place of birth for the foreign-born population - Bulgaria (%)
Place of birth for the foreign-born population - Croatia (%)
Place of birth for the foreign-born population - Czechoslovakia (%)
Place of birth for the foreign-born population - Hungary (%)
Place of birth for the foreign-born population - Latvia (%)
Place of birth for the foreign-born population - Lithuania (%)
Place of birth for the foreign-born population - North Macedonia (Macedonia) (%)
Place of birth for the foreign-born population - Moldova (%)
Place of birth for the foreign-born population - Poland (%)
Place of birth for the foreign-born population - Romania (%)
Place of birth for the foreign-born population - Russia (%)
Place of birth for the foreign-born population - Serbia (%)
Place of birth for the foreign-born population - Ukraine (%)
Place of birth for the foreign-born population - Other Eastern Europe (%)
Place of birth for the foreign-born population - China (%)
Place of birth for the foreign-born population - Hong Kong (%)
Place of birth for the foreign-born population - Taiwan (%)
Place of birth for the foreign-born population - Japan (%)
Place of birth for the foreign-born population - Korea (%)
Place of birth for the foreign-born population - Other Eastern Asia (%)
Place of birth for the foreign-born population - Afghanistan (%)
Place of birth for the foreign-born population - Bangladesh (%)
Place of birth for the foreign-born population - India (%)
Place of birth for the foreign-born population - Iran (%)
Place of birth for the foreign-born population - Kazakhstan (%)
Place of birth for the foreign-born population - Nepal (%)
Place of birth for the foreign-born population - Pakistan (%)
Place of birth for the foreign-born population - Sri Lanka (%)
Place of birth for the foreign-born population - Uzbekistan (%)
Place of birth for the foreign-born population - Other South Central Asia (%)
Place of birth for the foreign-born population - Burma (%)
Place of birth for the foreign-born population - Cambodia (%)
Place of birth for the foreign-born population - Indonesia (%)
Place of birth for the foreign-born population - Laos (%)
Place of birth for the foreign-born population - Malaysia (%)
Place of birth for the foreign-born population - Philippines (%)
Place of birth for the foreign-born population - Singapore (%)
Place of birth for the foreign-born population - Thailand (%)
Place of birth for the foreign-born population - Vietnam (%)
Place of birth for the foreign-born population - Other South Eastern Asia (%)
Place of birth for the foreign-born population - Armenia (%)
Place of birth for the foreign-born population - Iraq (%)
Place of birth for the foreign-born population - Israel (%)
Place of birth for the foreign-born population - Jordan (%)
Place of birth for the foreign-born population - Kuwait (%)
Place of birth for the foreign-born population - Lebanon (%)
Place of birth for the foreign-born population - Saudi Arabia (%)
Place of birth for the foreign-born population - Syria (%)
Place of birth for the foreign-born population - Turkey (%)
Place of birth for the foreign-born population - Yemen (%)
Place of birth for the foreign-born population - Other Western Asia (%)
Place of birth for the foreign-born population - Eritrea (%)
Place of birth for the foreign-born population - Ethiopia (%)
Place of birth for the foreign-born population - Kenya (%)
Place of birth for the foreign-born population - Somalia (%)
Place of birth for the foreign-born population - Uganda (%)
Place of birth for the foreign-born population - Zimbabwe (%)
Place of birth for the foreign-born population - Other Eastern Africa (%)
Place of birth for the foreign-born population - Cameroon (%)
Place of birth for the foreign-born population - Congo (%)
Place of birth for the foreign-born population - Democratic Republic of Congo (Zaire) (%)
Place of birth for the foreign-born population - Other Middle Africa (%)
Place of birth for the foreign-born population - Egypt (%)
Place of birth for the foreign-born population - Morocco (%)
Place of birth for the foreign-born population - Sudan (%)
Place of birth for the foreign-born population - Other Northern Africa (%)
Place of birth for the foreign-born population - South Africa (%)
Place of birth for the foreign-born population - Other Southern Africa (%)
Place of birth for the foreign-born population - Cabo Verde (%)
Place of birth for the foreign-born population - Ghana (%)
Place of birth for the foreign-born population - Liberia (%)
Place of birth for the foreign-born population - Nigeria (%)
Place of birth for the foreign-born population - Senegal (%)
Place of birth for the foreign-born population - Sierra Leone (%)
Place of birth for the foreign-born population - Other Western Africa (%)
Place of birth for the foreign-born population - Australia (%)
Place of birth for the foreign-born population - New Zealand (%)
Place of birth for the foreign-born population - Fiji (%)
Place of birth for the foreign-born population - Micronesia (%)
Place of birth for the foreign-born population - Bahamas (%)
Place of birth for the foreign-born population - Barbados (%)
Place of birth for the foreign-born population - Cuba (%)
Place of birth for the foreign-born population - Dominica (%)
Place of birth for the foreign-born population - Dominican Republic (%)
Place of birth for the foreign-born population - Grenada (%)
Place of birth for the foreign-born population - Haiti (%)
Place of birth for the foreign-born population - Jamaica (%)
Place of birth for the foreign-born population - St. Vincent and the Grenadines (%)
Place of birth for the foreign-born population - Trinidad and Tobago (%)
Place of birth for the foreign-born population - West Indies (%)
Place of birth for the foreign-born population - Other Caribbean (%)
Place of birth for the foreign-born population - Belize (%)
Place of birth for the foreign-born population - Costa Rica (%)
Place of birth for the foreign-born population - El Salvador (%)
Place of birth for the foreign-born population - Guatemala (%)
Place of birth for the foreign-born population - Honduras (%)
Place of birth for the foreign-born population - Mexico (%)
Place of birth for the foreign-born population - Nicaragua (%)
Place of birth for the foreign-born population - Panama (%)
Place of birth for the foreign-born population - Other Central America (%)
Place of birth for the foreign-born population - Argentina (%)
Place of birth for the foreign-born population - Bolivia (%)
Place of birth for the foreign-born population - Brazil (%)
Place of birth for the foreign-born population - Chile (%)
Place of birth for the foreign-born population - Colombia (%)
Place of birth for the foreign-born population - Ecuador (%)
Place of birth for the foreign-born population - Guyana (%)
Place of birth for the foreign-born population - Peru (%)
Place of birth for the foreign-born population - Uruguay (%)
Place of birth for the foreign-born population - Venezuela (%)
Place of birth for the foreign-born population - Other South America (%)
Place of birth for the foreign-born population - Canada (%)
Place of birth for the foreign-born population - Other Northern America (%)
Place of birth for the foreign-born population - Other (%)
Latest news about races in Petersburg, VA collected exclusively by city-data.com from local newspapers, TV, and radio stations
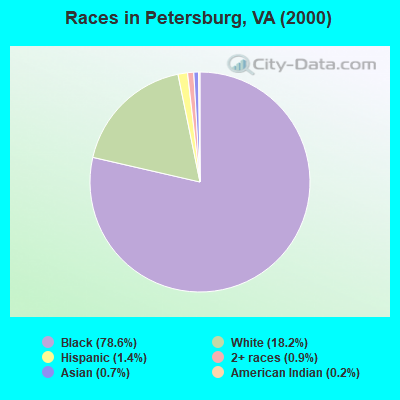
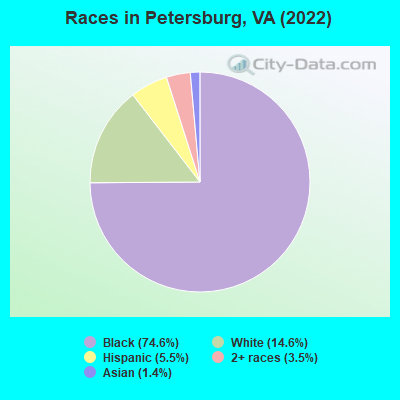
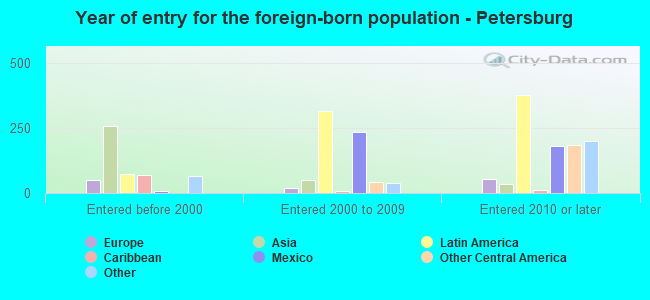
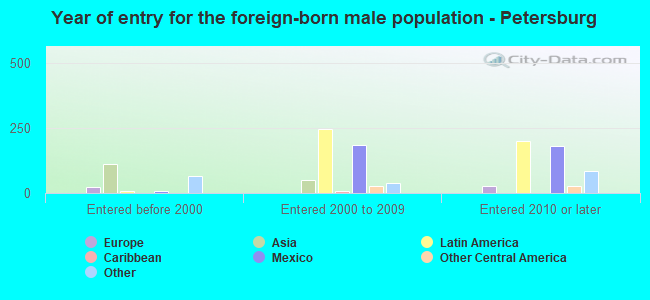
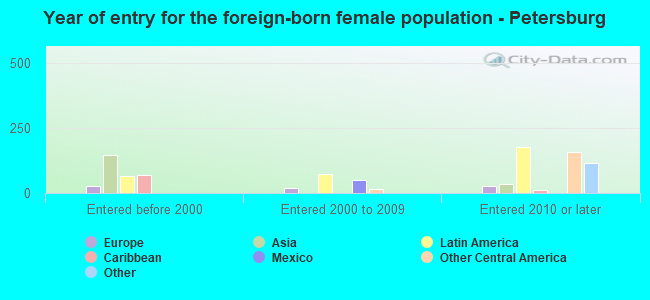
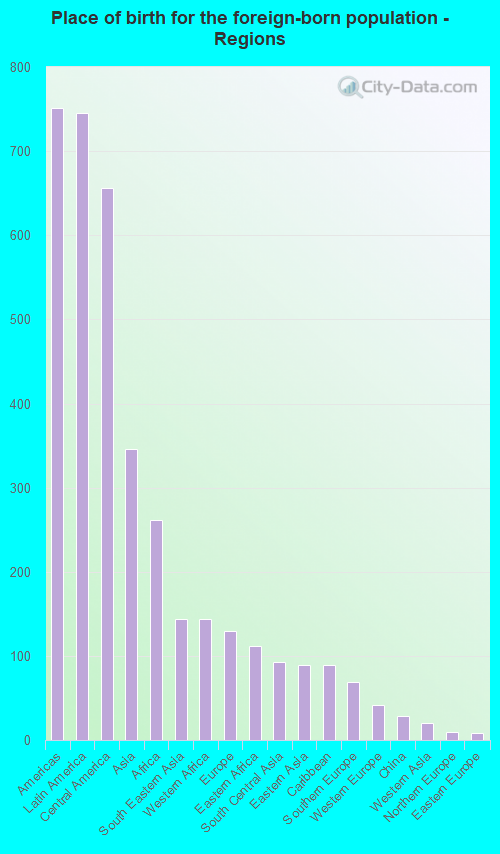
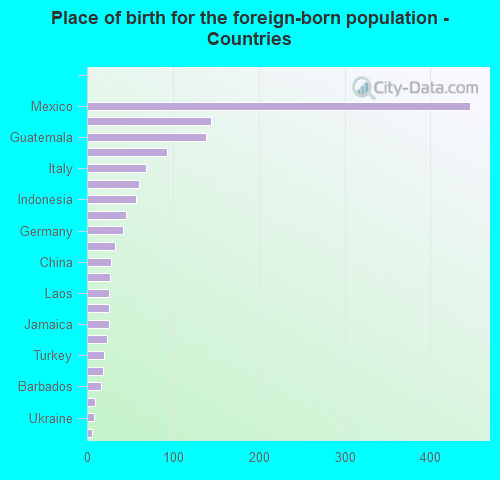
According to 2022 data, the most numerous races in Petersburg, VA are White alone (4,875 residents), Black alone (24,973 residents), and Hispanic (1,848 residents). 92.6% of Petersburg residents speak English at home. 4.4% of Petersburg, VA residents are foreign-born (2.2% born in Latin America, 1.0% born in Asia, 0.8% born in Africa), which is 169.9% less than the foreign-born rate of 12.0% across the entire state of Virginia.
Race distribution in Petersburg
2000 2022
4,965,637 70.2% White alone 1,376,378 19.4% Black alone 329,540 4.7% Hispanic 259,277 3.7% Asian alone 114,022 1.6% Two or more races 18,596 0.3% American Indian alone 11,685 0.2% Other race alone 3,380 0.05% Native Hawaiian and Other
5,095,130 58.7% White alone 1,594,785 18.4% Black alone 905,750 10.4% Hispanic 602,881 6.9% Asian alone 406,047 4.7% Two or more races 60,419 0.7% Other race alone 11,738 0.1% American Indian alone 6,869 0.08% Native Hawaiian and Other
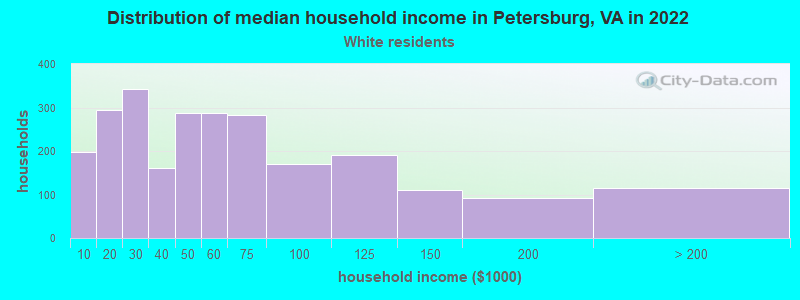
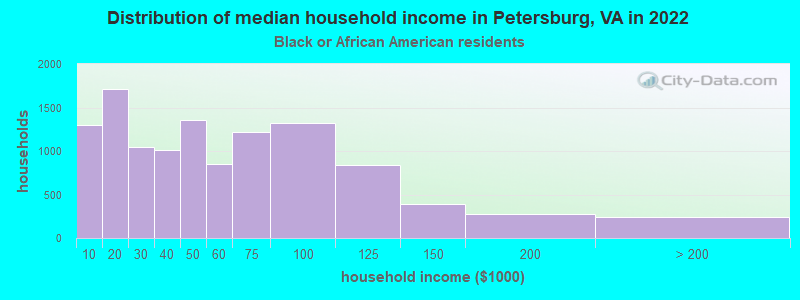
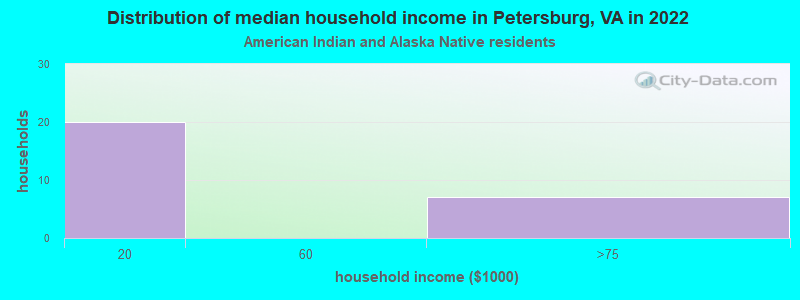
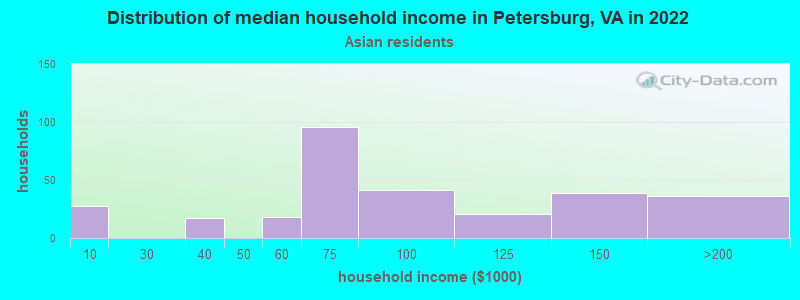
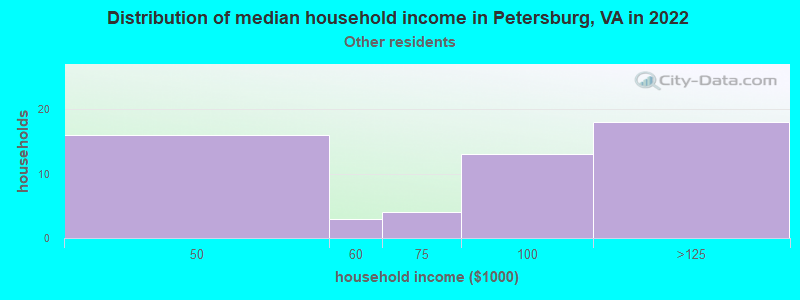
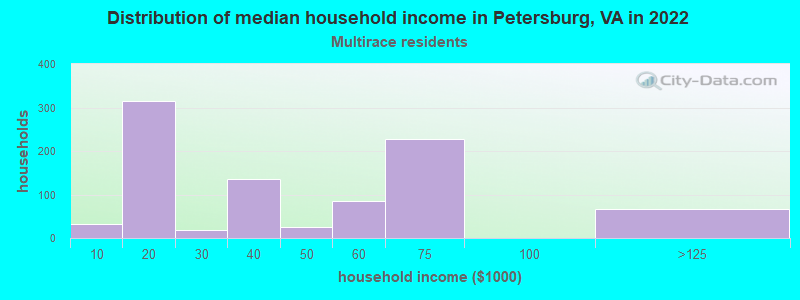
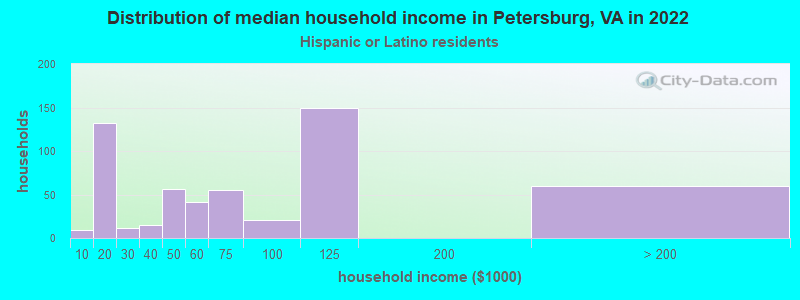
Income and house value in Petersburg Median household income in 2022 $46,018 White non-Hispanic householders$45,443 Black householders$71,643 Asian householders$80,577 Some other race householders$39,040 Two or more races householders$61,349 Hispanic or Latino race householdersMedian 2022 house value $180,752 White Non-Hispanic householders$152,371 Black or African American householders$319,863 American Indian or Alaska Native householders $222,857 Asian householders$138,181 Some other race householders$185,637 Two or more races householders$167,259 Hispanic or Latino householders
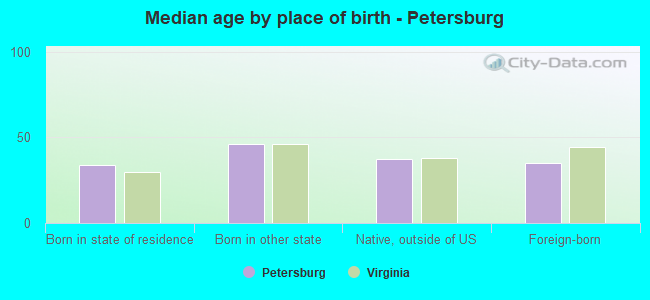
Median age by race in Petersburg
42.3 Median age for White residents38.6 42.8 37.2 Median age for Black or African American residents35.6 39.1 56.2 Median age for American Indian / Alaska Native residents-682,352,940.5 -687,861,271.0 43.1 Median age for Asian residents43.1 69.3 55.4 Median age for Native Hawaiian / Pacific Islander residents-541,531,822.5 -714,150,046.8 32.0 Median age for Other race residents41.5 19.8 30.5 Median age for Two or more races residents30.2 32.2 43.2 Median age for White alone residents41.2 43.7 24.0 Median age for Hispanic or Latino residents21.1 25.6
Owner/renter occupied households by race in Petersburg
House owners and renters - White residents 1,277 51.6% Owner occupied1,196 48.4% Renter occupiedHouse owners and renters - Black or African American residents 4,171 36.6% Owner occupied7,237 63.4% Renter occupiedHouse owners and renters - American Indian / Alaska Native residents 10 100.0% Renter occupiedHouse owners and renters - Asian residents 228 78.2% Owner occupied64 21.8% Renter occupiedHouse owners and renters - Native Hawaiian / Pacific Islander residents 8 100.0% Owner occupiedHouse owners and renters - Other race residents 15 28.1% Owner occupied38 71.9% Renter occupiedHouse owners and renters - Two or more races residents 127 15.1% Owner occupied709 84.9% Renter occupiedHouse owners and renters - White alone residents 1,238 52.2% Owner occupied1,134 47.8% Renter occupiedHouse owners and renters - Hispanic or Latino residents 92 16.0% Owner occupied484 84.0% Renter occupied
Language usage in Petersburg
English speakers - Total 92.6% of residents of Petersburg speak English at home.
4.7% of residents speak Spanish at home 739 50.8% Speak English very well717 49.2% Speak English less than very well2.4% of residents speak other language at home 504 68.9% Speak English very well227 31.1% Speak English less than very well
English speakers - Born in the United States 96.1% of residents of Petersburg speak English at home.
2.4% of residents speak Spanish at home 127 62.0% Speak English very well78 38.0% Speak English less than very well1.4% of residents speak other language at home 104 86.0% Speak English very well17 14.0% Speak English less than very well
English speakers - Native, born elsewhere 51.0% of residents of Petersburg speak English at home.
46.2% of residents speak Spanish at home 324 84.2% Speak English very well61 15.8% Speak English less than very well3.2% of residents speak other language at home 27 100.0% Speak English very well
English speakers - Foreign-born 21.5% of residents of Petersburg speak English at home.
44.6% of residents speak Spanish at home 272 41.7% Speak English very well380 58.3% Speak English less than very well33.2% of residents speak other language at home 284 58.6% Speak English very well201 41.4% Speak English less than very well
White (Caucasian) - Speak only English Native:
95.2% (4,298)Foreign-born:
13.4% (41)
White (Caucasian) - Speak another language Native:
4.4% (199)Foreign-born:
83.0% (253)
Black or African American - Speak only English Native:
97.4% (22,695)Foreign-born:
42.1% (149)
Black or African American - Speak another language Native:
2.5% (589)Foreign-born:
55.1% (195)
Asian - Speak only English Native:
89.2% (111)Foreign-born:
36.9% (117)
Asian - Speak another language Native:
3.8% (5)Foreign-born:
64.9% (205)
Native Hawaiian / Pacific Islander - Speak another language Native:
100.0% (12)Foreign-born:
49.7% (8)
Other race - Speak another language Native:
52.7% (39)Foreign-born:
98.4% (116)
Two or more races - Speak another language Native:
17.0% (223)Foreign-born:
100.0% (382)
White alone - Speak only English Native:
97.8% (4,286)Foreign-born:
34.3% (43)
White alone - Speak another language Native:
2.2% (95)Foreign-born:
65.6% (83)
Hispanic or Latino - Speak another language Native:
67.0% (640)Foreign-born:
99.6% (653)
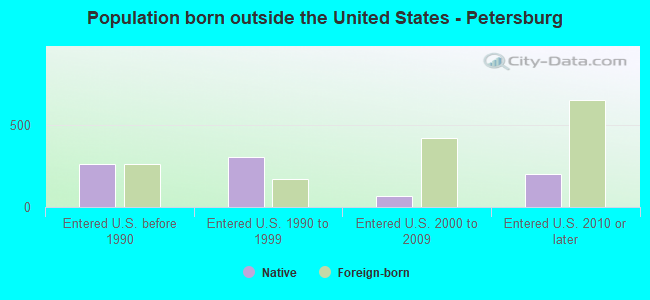
Foreign-born residents in Petersburg 1,489 residents are foreign born (2.2% Latin America , 1.0% Asia , 0.8% Africa ).
This city:
4.4%Virginia:
12.6%
Marital status for residents in Petersburg Marital status - White (Caucasian) population 15 years and over
Males 41.1% Never married37.3% Now married3.6% Separated5.5% Widowed12.5% DivorcedFemales 27.6% Never married38.6% Now married4.8% Separated11.7% Widowed17.3% DivorcedWomen who gave birth in the past 12 months Now married:
77.5% (29)Unmarried:
22.5% (8)
Women who did not give birth in the past 12 months Now married:
38.7% (440)Unmarried:
61.3% (695)
Marital status - Black or African American population 15 years and over
Males 55.4% Never married24.4% Now married4.9% Separated2.2% Widowed13.2% DivorcedFemales 54.1% Never married16.5% Now married4.5% Separated12.1% Widowed12.8% DivorcedWomen who gave birth in the past 12 months Now married:
9.8% (27)Unmarried:
90.2% (246)
Women who did not give birth in the past 12 months Now married:
14.6% (870)Unmarried:
85.4% (5,074)
Marital status - American Indian / Alaska Native population 15 years and over
Males 0.0% Never married100.0% Now married0.0% Separated0.0% Widowed0.0% DivorcedFemales 0.0% Never married0.0% Now married0.0% Separated77.8% Widowed22.2% DivorcedWomen who did not give birth in the past 12 months Now married:
0.0% (0)Unmarried:
100.0% (2)
Marital status - Asian population 15 years and over
Males 29.5% Never married24.5% Now married8.9% Separated0.0% Widowed37.1% DivorcedFemales 33.3% Never married66.7% Now married0.0% Separated0.0% Widowed0.0% DivorcedWomen who did not give birth in the past 12 months Now married:
43.9% (30)Unmarried:
56.1% (38)
Marital status - Native Hawaiian / Pacific Islander population 15 years and over
Males 0.0% Never married100.0% Now married0.0% Separated0.0% Widowed0.0% DivorcedFemales 0.0% Never married100.0% Now married0.0% Separated0.0% Widowed0.0% DivorcedMarital status - Other race population 15 years and over
Males 21.2% Never married16.5% Now married0.0% Separated0.0% Widowed62.4% DivorcedFemales 55.9% Never married44.1% Now married0.0% Separated0.0% Widowed0.0% DivorcedWomen who did not give birth in the past 12 months Now married:
34.5% (13)Unmarried:
65.5% (25)
Marital status - Two or more races population 15 years and over
Males 57.7% Never married32.9% Now married3.9% Separated0.0% Widowed5.5% DivorcedFemales 60.4% Never married12.2% Now married0.0% Separated7.4% Widowed20.0% DivorcedWomen who gave birth in the past 12 months Now married:
40.0% (19)Unmarried:
60.0% (29)
Women who did not give birth in the past 12 months Now married:
11.2% (71)Unmarried:
88.8% (565)
Marital status - White alone, not Hispanic / Latino population 15 years and over
Males 38.4% Never married37.3% Now married4.1% Separated6.2% Widowed14.1% DivorcedFemales 27.8% Never married36.4% Now married5.2% Separated12.5% Widowed18.1% DivorcedWomen who gave birth in the past 12 months Now married:
100.0% (30)Unmarried:
0.0% (0)
Women who did not give birth in the past 12 months Now married:
34.4% (359)Unmarried:
65.6% (685)
Marital status - Hispanic or Latino population 15 years and over
Males 59.9% Never married25.4% Now married3.4% Separated0.0% Widowed11.3% DivorcedFemales 53.0% Never married26.2% Now married0.0% Separated0.0% Widowed20.8% DivorcedWomen who gave birth in the past 12 months Now married:
12.1% (12)Unmarried:
87.9% (85)
Women who did not give birth in the past 12 months Now married:
32.4% (144)Unmarried:
67.6% (301)
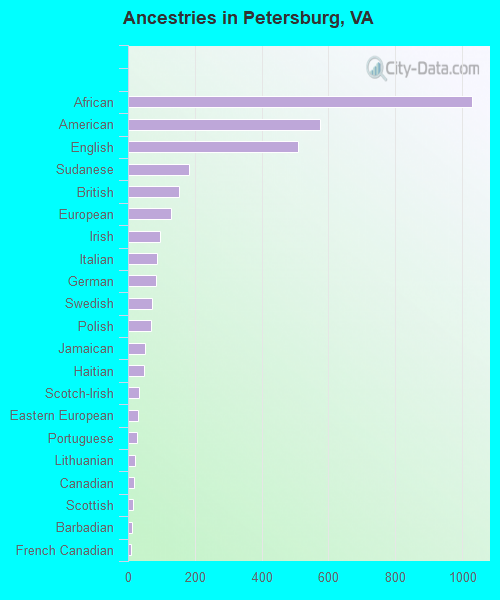
Ancestries in Petersburg
1,029 4.9% African576 2.7% American510 2.4% English183 0.9% Sudanese154 0.7% British129 0.6% European96 0.5% Irish88 0.4% Italian85 0.4% German73 0.3% Swedish70 0.3% Polish50 0.2% Jamaican47 0.2% Haitian32 0.2% Scotch-Irish31 0.1% Eastern European26 0.1% Portuguese22 0.1% Lithuanian18 0.09% Canadian16 0.08% Scottish12 0.06% Barbadian10 0.05% French Canadian9 0.04% French5 0.02% Russian4 0.02% Greek4 0.02% Norwegian
Geographical mobility in Petersburg Same house 1 year ago 4,143 79.4% White (Caucasian)20,574 81.1% Black or African American17 96.1% American Indian / Alaska Native383 83.8% Asian19 80.2% Native Hawaiian / Pacific Islander202 99.9% Other race1,118 64.0% Two or more races3,773 78.0% White alone, not Hispanic / Latino1,132 64.5% Hispanic or LatinoMoved within same county 120 2.3% White / Caucasian1,255 4.9% Black or African American39 8.6% Asian97 5.6% Two or more races113 2.3% White alone, not Hispanic / Latino337 19.2% Hispanic or LatinoMoved within same state 559 10.7% White / Caucasian2,268 8.9% Black or African American31 6.7% Asian241 13.8% Two or more races536 11.1% White alone, not Hispanic / Latino192 10.9% Hispanic or LatinoMoved from different state 314 6.0% White / Caucasian1,256 4.9% Black or African American3 12.7% Native Hawaiian / Pacific Islander5 2.6% Other race267 15.3% Two or more races327 6.8% White alone, not Hispanic / Latino68 3.9% Hispanic or LatinoMoved from abroad 79 1.5% White34 0.1% Black or African American28 1.6% Two or more races88 1.8% White alone, not Hispanic / Latino20 1.2% Hispanic or Latino
Children Nativity (place of birth) in Petersburg
Children under 6 years - Living with two parents Both parents native 679 100.0% Native0 0.0% Foreign-bornBoth parents foreign-born 37 56.7% Native28 43.3% Foreign-bornChildren under 6 years - Living with one parent Native parent 1,631 100.0% NativeForeign-born parent 189 100.0% NativeChildren 6 to 17 years - Living with two parents Both parents native 646 100.0% NativeBoth parents foreign-born 29 13.7% Native183 86.3% Foreign-bornOne native, one foreign-born parent 6 100.0% NativeChildren 6 to 17 years - Living with one parent Native parent 2,826 97.0% Native88 3.0% Foreign-bornForeign-born parent 94 100.0% Native
Grandparents responsible for own grandchildren in Petersburg
Grandparents (30 to 59 years) White / Caucasian 8 100.0% Not responsible for grandchildrenBlack or African American 271 56.7% Responsible for grandchildren207 43.3% Not responsible for grandchildrenTwo or more races 12 100.0% Not responsible for grandchildrenWhite alone, not Hispanic / Latino 8 100.0% Not responsible for grandchildrenHispanic or Latino 143 100.0% Responsible for grandchildrenGrandparents (60 years and over) Black or African American 221 68.7% Responsible for grandchildren101 31.3% Not responsible for grandchildrenHispanic or Latino 5 100.0% Responsible for grandchildren