Races in Pell Lake, Wisconsin (WI) Detailed Stats
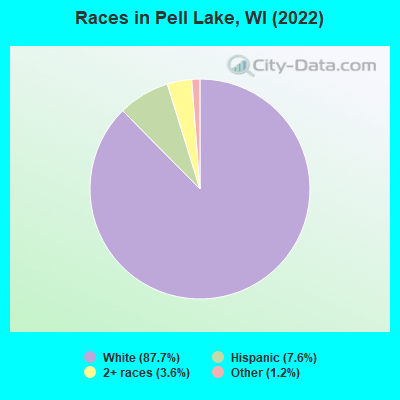
According to 2022 data, the most numerous races in Pell Lake, WI are White alone (2,942 residents), Hispanic (256 residents), and Black alone (0 residents). 92.1% of Pell Lake residents speak English at home. 3.6% of Pell Lake, WI residents are foreign-born (2.2% born in Europe, 1.3% born in Latin America), which is 39.9% less than the foreign-born rate of 5.0% across the entire state of Wisconsin.
Race distribution in Pell Lake
2000 2022
4,681,630 87.3% White alone 300,245 5.6% Black alone 192,921 3.6% Hispanic 87,995 1.6% Asian alone 51,921 1.0% Two or more races 43,980 0.8% American Indian alone 3,637 0.07% Other race alone 1,346 0.03% Native Hawaiian and Other
4,654,031 79.0% White alone 447,022 7.6% Hispanic 345,678 5.9% Black alone 217,532 3.7% Two or more races 172,242 2.9% Asian alone 33,762 0.6% American Indian alone 19,680 0.3% Other race alone 2,592 0.04% Native Hawaiian and Other
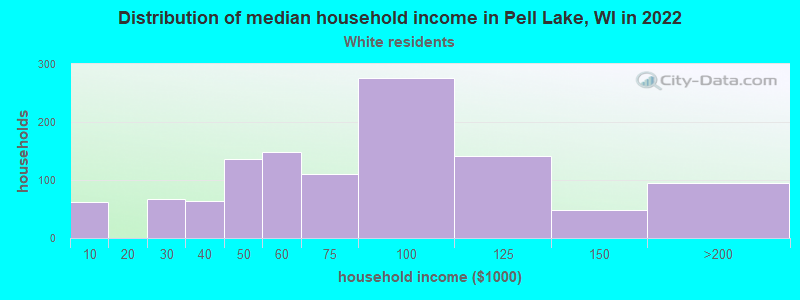
Income and house value in Pell Lake Median household income in 2022 $71,685 White non-Hispanic householders$24,804 Asian householders$87,836 Some other race householders$102,897 Hispanic or Latino race householdersMedian 2022 house value $211,326 White Non-Hispanic householders$84,666 Some other race householders$88,278 Hispanic or Latino householders
Household income for White non-Hispanic householders
Median age by race in Pell Lake
45.3 Median age for White residents44.3 45.6 40.1 Median age for Two or more races residents46.7 Median age for White alone residents46.7 46.9 27.2 Median age for Hispanic or Latino residents9.4 32.5
Owner/renter occupied households by race in Pell Lake
House owners and renters - White residents 979 80.6% Owner occupied236 19.4% Renter occupiedHouse owners and renters - Two or more races residents 29 100.0% Owner occupiedHouse owners and renters - White alone residents 937 78.8% Owner occupied252 21.2% Renter occupiedHouse owners and renters - Hispanic or Latino residents 38 100.0% Owner occupied
Language usage in Pell Lake
English speakers - Total 92.1% of residents of Pell Lake speak English at home.
5.0% of residents speak Spanish at home 127 76.5% Speak English very well39 23.5% Speak English less than very well2.9% of residents speak other language at home 85 89.5% Speak English very well10 10.5% Speak English less than very well
English speakers - Born in the United States 92.6% of residents of Pell Lake speak English at home.
5.0% of residents speak Spanish at home 100 100.0% Speak English very well2.3% of residents speak other language at home 46 100.0% Speak English very well
English speakers - Native, born elsewhere 67.3% of residents of Pell Lake speak English at home.
English speakers - Foreign-born 29.8% of residents of Pell Lake speak English at home.
27.5% of residents speak Spanish at home 36 100.0% Speak English less than very well41.2% of residents speak other language at home 45 83.3% Speak English very well9 16.7% Speak English less than very well
White (Caucasian) - Speak only English Native:
95.8% (2,849)Foreign-born:
49.0% (42)
White (Caucasian) - Speak another language Native:
3.8% (113)Foreign-born:
59.4% (51)
White alone - Speak only English Native:
99.2% (2,785)Foreign-born:
42.2% (32)
White alone - Speak another language Native:
1.2% (33)Foreign-born:
58.7% (45)
Hispanic or Latino - Speak another language Native:
48.9% (127)Foreign-born:
92.9% (40)
Foreign-born residents in Pell Lake 120 residents are foreign born (2.2% Europe , 1.3% Latin America ).
This city:
3.6%Wisconsin:
100.0%
Marital status for residents in Pell Lake Marital status - White (Caucasian) population 15 years and over
Males 27.8% Never married54.1% Now married0.0% Separated11.7% Widowed6.4% DivorcedFemales 26.5% Never married57.1% Now married2.7% Separated3.5% Widowed10.1% DivorcedWomen who did not give birth in the past 12 months Now married:
56.5% (382)Unmarried:
43.5% (294)
Marital status - Two or more races population 15 years and over
Males 100.0% Never married0.0% Now married0.0% Separated0.0% Widowed0.0% DivorcedFemales 0.0% Never married100.0% Now married0.0% Separated0.0% Widowed0.0% DivorcedWomen who did not give birth in the past 12 months Now married:
100.0% (24)Unmarried:
0.0% (0)
Marital status - White alone, not Hispanic / Latino population 15 years and over
Males 27.3% Never married53.8% Now married0.0% Separated12.3% Widowed6.7% DivorcedFemales 27.4% Never married55.8% Now married2.8% Separated3.6% Widowed10.5% DivorcedWomen who did not give birth in the past 12 months Now married:
54.3% (338)Unmarried:
45.7% (284)
Marital status - Hispanic or Latino population 15 years and over
Males 38.3% Never married61.7% Now married0.0% Separated0.0% Widowed0.0% DivorcedFemales 38.3% Never married61.7% Now married0.0% Separated0.0% Widowed0.0% DivorcedWomen who did not give birth in the past 12 months Now married:
61.7% (58)Unmarried:
38.3% (36)
Ancestries in Pell Lake
299 23.8% German210 16.7% American111 8.8% European82 6.5% Norwegian43 3.4% Italian37 2.9% Polish36 2.9% English36 2.9% Ukrainian32 2.5% Hungarian21 1.7% Russian17 1.4% Swedish13 1.0% Scotch-Irish9 0.7% Irish8 0.6% Lithuanian6 0.5% Latvian
Children Nativity (place of birth) in Pell Lake
Children under 6 years - Living with two parents Both parents native 133 100.0% NativeBoth parents foreign-born 19 100.0% Native
Children 6 to 17 years - Living with two parents Both parents native 319 100.0% NativeBoth parents foreign-born 64 100.0% NativeChildren 6 to 17 years - Living with one parent Native parent 108 100.0% Native
Place of birth for residents in Pell Lake 76 Europe76 Eastern Europe44 Americas44 Latin America44 Central America