Races in Pecan Grove, Texas (TX) Detailed Stats
Data:
Races - White alone (%)
Races - White alone (% change since 2000)
Races - Black alone (%)
Races - Black alone (% change since 2000)
Races - American Indian alone (%)
Races - American Indian alone (% change since 2000)
Races - Asian alone (%)
Races - Asian alone (% change since 2000)
Races - Hispanic (%)
Races - Hispanic (% change since 2000)
Races - Native Hawaiian and Other Pacific Islander alone (%)
Races - Native Hawaiian and Other Pacific Islander alone (% change since 2000)
Races - Two or more races(%)
Races - Two or more races(% change since 2000)
Races - Other race alone (%)
Races - Other race alone (% change since 2000)
Racial diversity
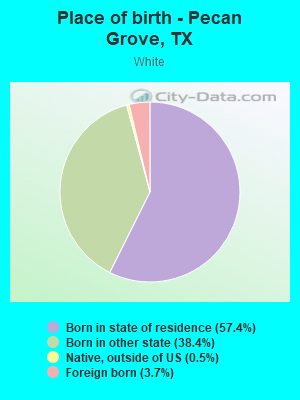
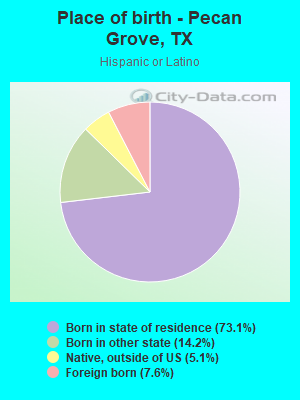
Place of birth - Born in state of residence (%)
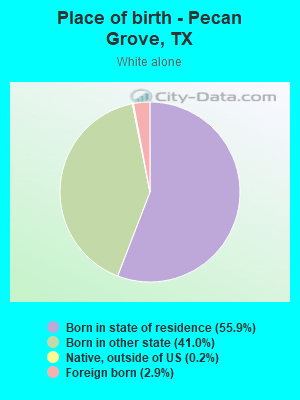
Place of birth - Born in state of residence (%) - White
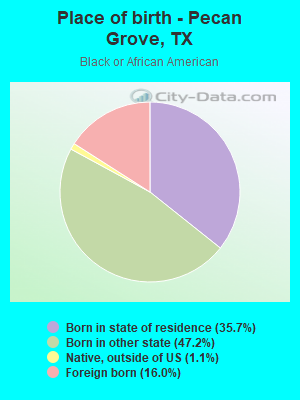
Place of birth - Born in state of residence (%) - Black or African American
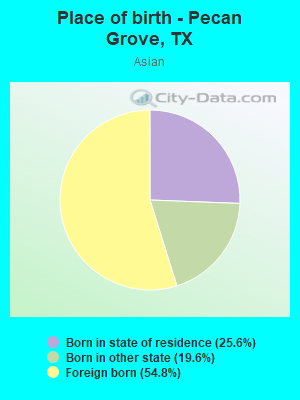
Place of birth - Born in state of residence (%) - Asian
Place of birth - Born in state of residence (%) - Hispanic or Latino
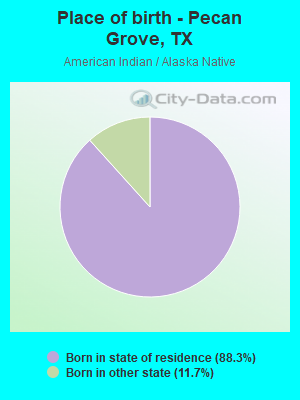
Place of birth - Born in state of residence (%) - American Indian and Alaska Native
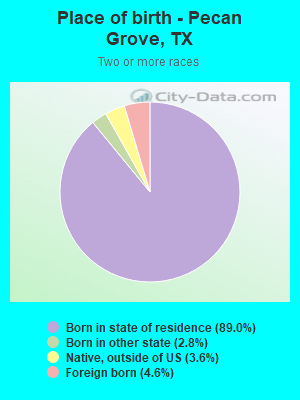
Place of birth - Born in state of residence (%) - Multirace
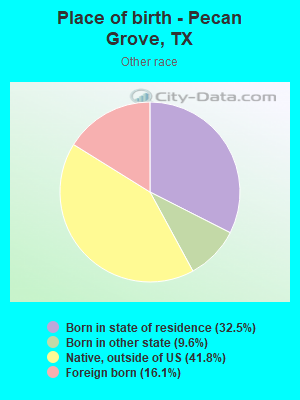
Place of birth - Born in state of residence (%) - Other Race
Place of birth - Born in other state (%)
Place of birth - Born in other state (%) - White
Place of birth - Born in other state (%) - Black or African American
Place of birth - Born in other state (%) - Asian
Place of birth - Born in other state (%) - Hispanic or Latino
Place of birth - Born in other state (%) - American Indian and Alaska Native
Place of birth - Born in other state (%) - Multirace
Place of birth - Born in other state (%) - Other Race
Place of birth - Native, outside of US (%)
Place of birth - Native, outside of US (%) - White
Place of birth - Native, outside of US (%) - Black or African American
Place of birth - Native, outside of US (%) - Asian
Place of birth - Native, outside of US (%) - Hispanic or Latino
Place of birth - Native, outside of US (%) - American Indian and Alaska Native
Place of birth - Native, outside of US (%) - Multirace
Place of birth - Native, outside of US (%) - Other Race
Place of birth - Foreign born (%)
Place of birth - Foreign born (%) - White
Place of birth - Foreign born (%) - Black or African American
Place of birth - Foreign born (%) - Asian
Place of birth - Foreign born (%) - Hispanic or Latino
Place of birth - Foreign born (%) - American Indian and Alaska Native
Place of birth - Foreign born (%) - Multirace
Place of birth - Foreign born (%) - Other Race
Residents speaking English at home (%)
Residents speaking English at home - Born in the United States (%)
Residents speaking English at home - Native, born elsewhere (%)
Residents speaking English at home - Foreign born (%)
Residents speaking Spanish at home (%)
Residents speaking Spanish at home - Born in the United States (%)
Residents speaking Spanish at home - Native, born elsewhere (%)
Residents speaking Spanish at home - Foreign born (%)
Residents speaking other language at home (%)
Residents speaking other language at home - Born in the United States (%)
Residents speaking other language at home - Native, born elsewhere (%)
Residents speaking other language at home - Foreign born (%)
Marital status - Never married (%)
Marital status - Now married (%)
Marital status - Separated (%)
Marital status - Widowed (%)
Marital status - Divorced (%)
Ancestries Reported - Arab (%)
Ancestries Reported - Czech (%)
Ancestries Reported - Danish (%)
Ancestries Reported - Dutch (%)
Ancestries Reported - English (%)
Ancestries Reported - French (%)
Ancestries Reported - French Canadian (%)
Ancestries Reported - German (%)
Ancestries Reported - Greek (%)
Ancestries Reported - Hungarian (%)
Ancestries Reported - Irish (%)
Ancestries Reported - Italian (%)
Ancestries Reported - Lithuanian (%)
Ancestries Reported - Norwegian (%)
Ancestries Reported - Polish (%)
Ancestries Reported - Portuguese (%)
Ancestries Reported - Russian (%)
Ancestries Reported - Scotch-Irish (%)
Ancestries Reported - Scottish (%)
Ancestries Reported - Slovak (%)
Ancestries Reported - Subsaharan African (%)
Ancestries Reported - Swedish (%)
Ancestries Reported - Swiss (%)
Ancestries Reported - Ukrainian (%)
Ancestries Reported - United States (%)
Ancestries Reported - Welsh (%)
Ancestries Reported - West Indian (%)
Ancestries Reported - Other (%)
Geographical mobility - Same house 1 year ago (%)
Geographical mobility - Same house 1 year ago (%) - White
Geographical mobility - Same house 1 year ago (%) - Black or African American
Geographical mobility - Same house 1 year ago (%) - Asian
Geographical mobility - Same house 1 year ago (%) - Hispanic or Latino
Geographical mobility - Same house 1 year ago (%) - American Indian and Alaska Native
Geographical mobility - Same house 1 year ago (%) - Multirace
Geographical mobility - Same house 1 year ago (%) - Other Race
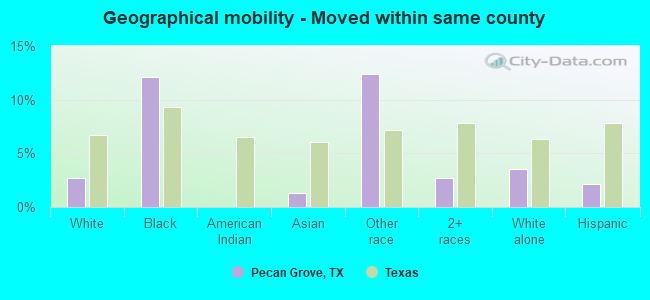
Geographical mobility - Moved within same county (%)
Geographical mobility - Moved within same county (%) - White
Geographical mobility - Moved within same county (%) - Black or African American
Geographical mobility - Moved within same county (%) - Asian
Geographical mobility - Moved within same county (%) - Hispanic or Latino
Geographical mobility - Moved within same county (%) - American Indian and Alaska Native
Geographical mobility - Moved within same county (%) - Multirace
Geographical mobility - Moved within same county (%) - Other Race
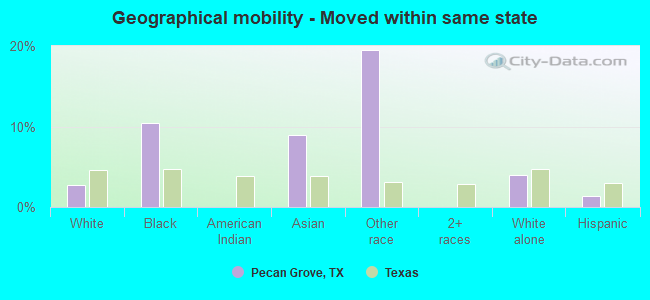
Geographical mobility - Moved from different county within same state (%)
Geographical mobility - Moved from different county within same state (%) - White
Geographical mobility - Moved from different county within same state (%) - Black or African American
Geographical mobility - Moved from different county within same state (%) - Asian
Geographical mobility - Moved from different county within same state (%) - Hispanic or Latino
Geographical mobility - Moved from different county within same state (%) - American Indian and Alaska Native
Geographical mobility - Moved from different county within same state (%) - Multirace
Geographical mobility - Moved from different county within same state (%) - Other Race
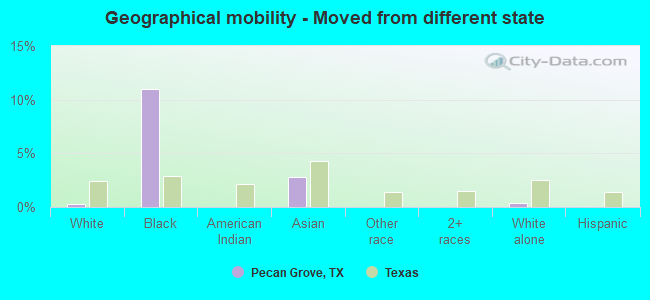
Geographical mobility - Moved from different state (%)
Geographical mobility - Moved from different state (%) - White
Geographical mobility - Moved from different state (%) - Black or African American
Geographical mobility - Moved from different state (%) - Asian
Geographical mobility - Moved from different state (%) - Hispanic or Latino
Geographical mobility - Moved from different state (%) - American Indian and Alaska Native
Geographical mobility - Moved from different state (%) - Multirace
Geographical mobility - Moved from different state (%) - Other Race
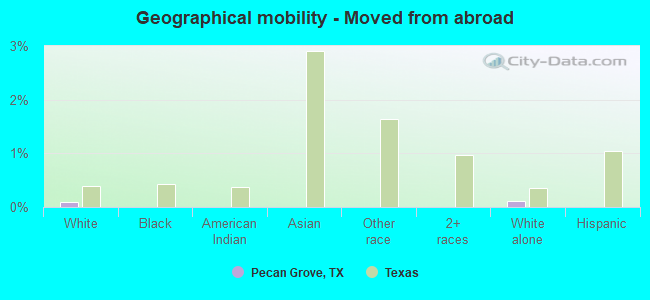
Geographical mobility - Moved from abroad (%)
Geographical mobility - Moved from abroad (%) - White
Geographical mobility - Moved from abroad (%) - Black or African American
Geographical mobility - Moved from abroad (%) - Asian
Geographical mobility - Moved from abroad (%) - Hispanic or Latino
Geographical mobility - Moved from abroad (%) - American Indian and Alaska Native
Geographical mobility - Moved from abroad (%) - Multirace
Geographical mobility - Moved from abroad (%) - Other Race
Place of birth for the foreign-born population - Ireland (%)
Place of birth for the foreign-born population - Denmark (%)
Place of birth for the foreign-born population - Norway (%)
Place of birth for the foreign-born population - Sweden (%)
Place of birth for the foreign-born population - United Kingdom (%)
Place of birth for the foreign-born population - England (%)
Place of birth for the foreign-born population - Scotland (%)
Place of birth for the foreign-born population - Other Northern Europe (%)
Place of birth for the foreign-born population - Austria (%)
Place of birth for the foreign-born population - Belgium (%)
Place of birth for the foreign-born population - France (%)
Place of birth for the foreign-born population - Germany (%)
Place of birth for the foreign-born population - Netherlands (%)
Place of birth for the foreign-born population - Switzerland (%)
Place of birth for the foreign-born population - Other Western Europe (%)
Place of birth for the foreign-born population - Greece (%)
Place of birth for the foreign-born population - Italy (%)
Place of birth for the foreign-born population - Portugal (%)
Place of birth for the foreign-born population - Spain (%)
Place of birth for the foreign-born population - Other Southern Europe (%)
Place of birth for the foreign-born population - Albania (%)
Place of birth for the foreign-born population - Belarus (%)
Place of birth for the foreign-born population - Bosnia and Herzegovina (%)
Place of birth for the foreign-born population - Bulgaria (%)
Place of birth for the foreign-born population - Croatia (%)
Place of birth for the foreign-born population - Czechoslovakia (%)
Place of birth for the foreign-born population - Hungary (%)
Place of birth for the foreign-born population - Latvia (%)
Place of birth for the foreign-born population - Lithuania (%)
Place of birth for the foreign-born population - North Macedonia (Macedonia) (%)
Place of birth for the foreign-born population - Moldova (%)
Place of birth for the foreign-born population - Poland (%)
Place of birth for the foreign-born population - Romania (%)
Place of birth for the foreign-born population - Russia (%)
Place of birth for the foreign-born population - Serbia (%)
Place of birth for the foreign-born population - Ukraine (%)
Place of birth for the foreign-born population - Other Eastern Europe (%)
Place of birth for the foreign-born population - China (%)
Place of birth for the foreign-born population - Hong Kong (%)
Place of birth for the foreign-born population - Taiwan (%)
Place of birth for the foreign-born population - Japan (%)
Place of birth for the foreign-born population - Korea (%)
Place of birth for the foreign-born population - Other Eastern Asia (%)
Place of birth for the foreign-born population - Afghanistan (%)
Place of birth for the foreign-born population - Bangladesh (%)
Place of birth for the foreign-born population - India (%)
Place of birth for the foreign-born population - Iran (%)
Place of birth for the foreign-born population - Kazakhstan (%)
Place of birth for the foreign-born population - Nepal (%)
Place of birth for the foreign-born population - Pakistan (%)
Place of birth for the foreign-born population - Sri Lanka (%)
Place of birth for the foreign-born population - Uzbekistan (%)
Place of birth for the foreign-born population - Other South Central Asia (%)
Place of birth for the foreign-born population - Burma (%)
Place of birth for the foreign-born population - Cambodia (%)
Place of birth for the foreign-born population - Indonesia (%)
Place of birth for the foreign-born population - Laos (%)
Place of birth for the foreign-born population - Malaysia (%)
Place of birth for the foreign-born population - Philippines (%)
Place of birth for the foreign-born population - Singapore (%)
Place of birth for the foreign-born population - Thailand (%)
Place of birth for the foreign-born population - Vietnam (%)
Place of birth for the foreign-born population - Other South Eastern Asia (%)
Place of birth for the foreign-born population - Armenia (%)
Place of birth for the foreign-born population - Iraq (%)
Place of birth for the foreign-born population - Israel (%)
Place of birth for the foreign-born population - Jordan (%)
Place of birth for the foreign-born population - Kuwait (%)
Place of birth for the foreign-born population - Lebanon (%)
Place of birth for the foreign-born population - Saudi Arabia (%)
Place of birth for the foreign-born population - Syria (%)
Place of birth for the foreign-born population - Turkey (%)
Place of birth for the foreign-born population - Yemen (%)
Place of birth for the foreign-born population - Other Western Asia (%)
Place of birth for the foreign-born population - Eritrea (%)
Place of birth for the foreign-born population - Ethiopia (%)
Place of birth for the foreign-born population - Kenya (%)
Place of birth for the foreign-born population - Somalia (%)
Place of birth for the foreign-born population - Uganda (%)
Place of birth for the foreign-born population - Zimbabwe (%)
Place of birth for the foreign-born population - Other Eastern Africa (%)
Place of birth for the foreign-born population - Cameroon (%)
Place of birth for the foreign-born population - Congo (%)
Place of birth for the foreign-born population - Democratic Republic of Congo (Zaire) (%)
Place of birth for the foreign-born population - Other Middle Africa (%)
Place of birth for the foreign-born population - Egypt (%)
Place of birth for the foreign-born population - Morocco (%)
Place of birth for the foreign-born population - Sudan (%)
Place of birth for the foreign-born population - Other Northern Africa (%)
Place of birth for the foreign-born population - South Africa (%)
Place of birth for the foreign-born population - Other Southern Africa (%)
Place of birth for the foreign-born population - Cabo Verde (%)
Place of birth for the foreign-born population - Ghana (%)
Place of birth for the foreign-born population - Liberia (%)
Place of birth for the foreign-born population - Nigeria (%)
Place of birth for the foreign-born population - Senegal (%)
Place of birth for the foreign-born population - Sierra Leone (%)
Place of birth for the foreign-born population - Other Western Africa (%)
Place of birth for the foreign-born population - Australia (%)
Place of birth for the foreign-born population - New Zealand (%)
Place of birth for the foreign-born population - Fiji (%)
Place of birth for the foreign-born population - Micronesia (%)
Place of birth for the foreign-born population - Bahamas (%)
Place of birth for the foreign-born population - Barbados (%)
Place of birth for the foreign-born population - Cuba (%)
Place of birth for the foreign-born population - Dominica (%)
Place of birth for the foreign-born population - Dominican Republic (%)
Place of birth for the foreign-born population - Grenada (%)
Place of birth for the foreign-born population - Haiti (%)
Place of birth for the foreign-born population - Jamaica (%)
Place of birth for the foreign-born population - St. Vincent and the Grenadines (%)
Place of birth for the foreign-born population - Trinidad and Tobago (%)
Place of birth for the foreign-born population - West Indies (%)
Place of birth for the foreign-born population - Other Caribbean (%)
Place of birth for the foreign-born population - Belize (%)
Place of birth for the foreign-born population - Costa Rica (%)
Place of birth for the foreign-born population - El Salvador (%)
Place of birth for the foreign-born population - Guatemala (%)
Place of birth for the foreign-born population - Honduras (%)
Place of birth for the foreign-born population - Mexico (%)
Place of birth for the foreign-born population - Nicaragua (%)
Place of birth for the foreign-born population - Panama (%)
Place of birth for the foreign-born population - Other Central America (%)
Place of birth for the foreign-born population - Argentina (%)
Place of birth for the foreign-born population - Bolivia (%)
Place of birth for the foreign-born population - Brazil (%)
Place of birth for the foreign-born population - Chile (%)
Place of birth for the foreign-born population - Colombia (%)
Place of birth for the foreign-born population - Ecuador (%)
Place of birth for the foreign-born population - Guyana (%)
Place of birth for the foreign-born population - Peru (%)
Place of birth for the foreign-born population - Uruguay (%)
Place of birth for the foreign-born population - Venezuela (%)
Place of birth for the foreign-born population - Other South America (%)
Place of birth for the foreign-born population - Canada (%)
Place of birth for the foreign-born population - Other Northern America (%)
Place of birth for the foreign-born population - Other (%)
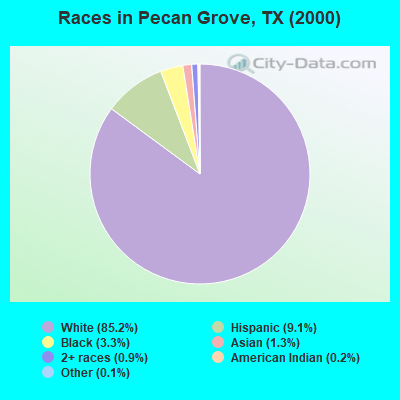
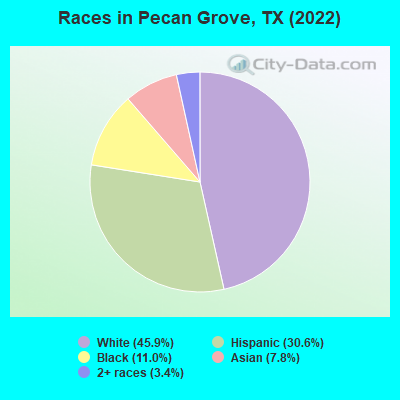
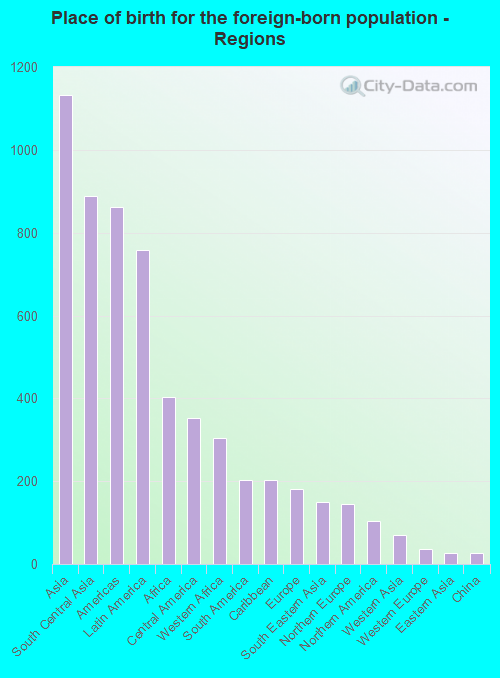
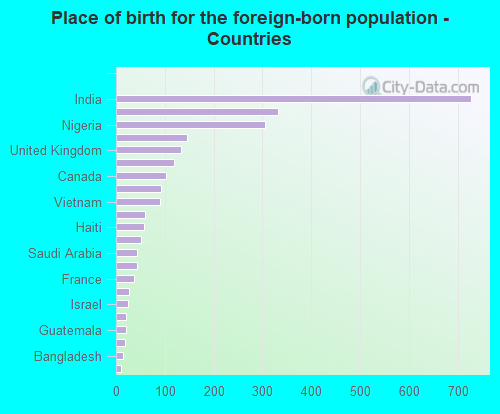
According to 2022 data, the most numerous races in Pecan Grove, TX are Hispanic (7,449 residents), White alone (11,173 residents), and Black alone (2,684 residents). 77.8% of Pecan Grove residents speak English at home. 10.6% of Pecan Grove, TX residents are foreign-born (4.8% born in Asia, 3.2% born in Latin America, 1.7% born in Africa), which is 60.3% less than the foreign-born rate of 17.0% across the entire state of Texas.
Race distribution in Pecan Grove
2000 2022
10,933,313 52.4% White alone 6,669,666 32.0% Hispanic 2,364,255 11.3% Black alone 554,445 2.7% Asian alone 230,567 1.1% Two or more races 68,859 0.3% American Indian alone 19,958 0.10% Other race alone 10,757 0.05% Native Hawaiian and Other
12,070,642 40.2% Hispanic 11,683,430 38.9% White alone 3,508,706 11.7% Black alone 1,608,173 5.4% Asian alone 956,560 3.2% Two or more races 125,763 0.4% Other race alone 47,023 0.2% American Indian alone 29,275 0.10% Native Hawaiian and Other
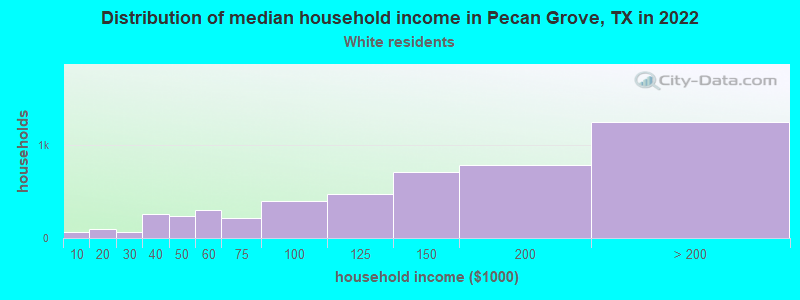
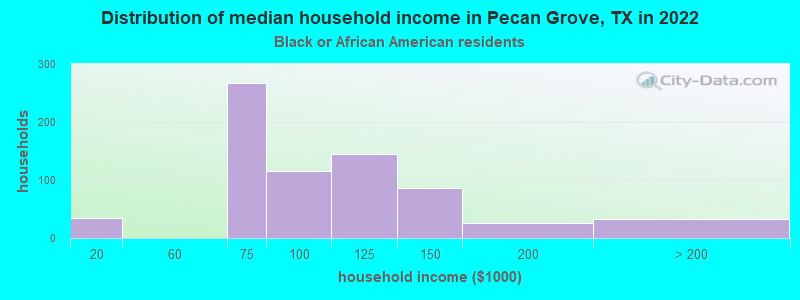
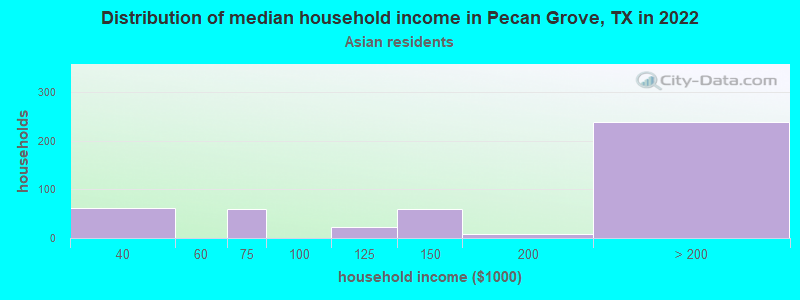
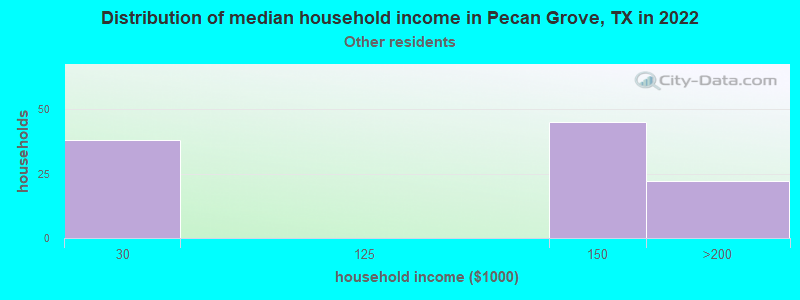
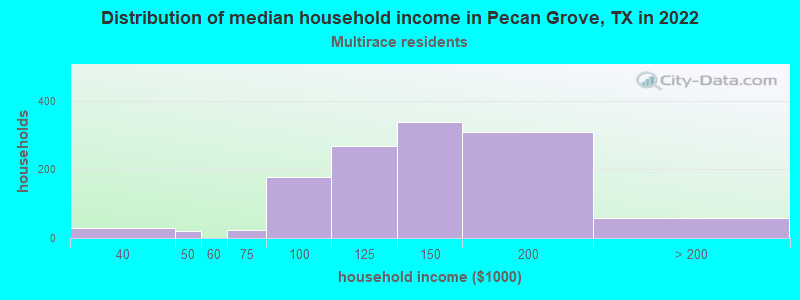
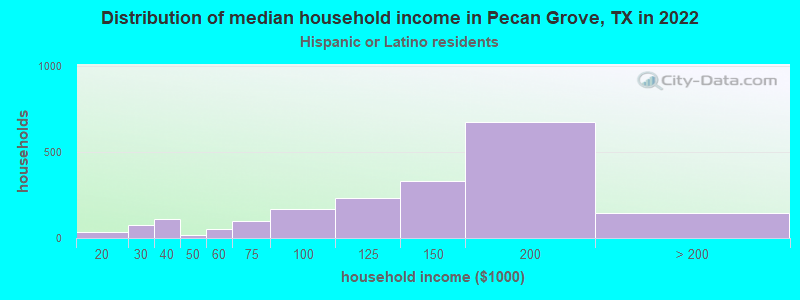
Income and house value in Pecan Grove Median household income in 2022 $123,867 White non-Hispanic householders$98,567 Black householders$133,302 Two or more races householders$139,141 Hispanic or Latino race householdersMedian 2022 house value $360,334 White Non-Hispanic householders$354,077 Black or African American householders$169,477 American Indian or Alaska Native householders $399,184 Asian householders$192,421 Some other race householders$293,326 Two or more races householders$226,838 Hispanic or Latino householders
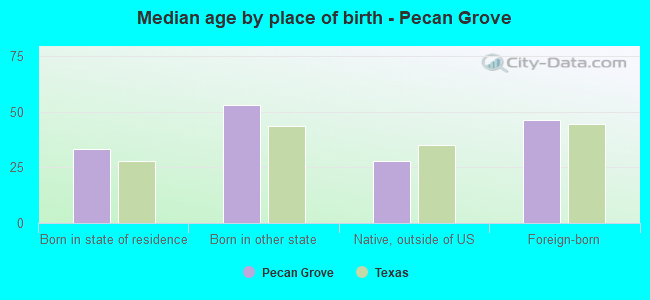
Median age by race in Pecan Grove
43.8 Median age for White residents45.7 43.5 34.4 Median age for Black or African American residents34.6 33.8 -823,170,730.9 Median age for American Indian / Alaska Native residents-811,501,596.6 -762,172,283.9 32.6 Median age for Asian residents35.9 30.1 -581,560,283.1 Median age for Native Hawaiian / Pacific Islander residents-612,729,233.5 -577,777,777.2 37.1 Median age for Other race residents37.1 17.8 34.7 Median age for Two or more races residents29.7 56.6 54.2 Median age for White alone residents53.6 55.0 33.7 Median age for Hispanic or Latino residents33.8 33.7
Owner/renter occupied households by race in Pecan Grove
House owners and renters - White residents 4,705 93.7% Owner occupied315 6.3% Renter occupiedHouse owners and renters - Black or African American residents 539 70.5% Owner occupied225 29.5% Renter occupiedHouse owners and renters - American Indian / Alaska Native residents 116 100.0% Owner occupiedHouse owners and renters - Asian residents 466 97.1% Owner occupied14 2.9% Renter occupiedHouse owners and renters - Other race residents 61 45.8% Owner occupied72 54.2% Renter occupiedHouse owners and renters - Two or more races residents 1,302 98.3% Owner occupied22 1.7% Renter occupiedHouse owners and renters - White alone residents 4,048 90.9% Owner occupied404 9.1% Renter occupiedHouse owners and renters - Hispanic or Latino residents 2,097 97.0% Owner occupied65 3.0% Renter occupied
Language usage in Pecan Grove
English speakers - Total 77.8% of residents of Pecan Grove speak English at home.
12.7% of residents speak Spanish at home 2,025 68.9% Speak English very well915 31.1% Speak English less than very well9.6% of residents speak other language at home 1,675 75.8% Speak English very well536 24.2% Speak English less than very well
English speakers - Born in the United States 91.0% of residents of Pecan Grove speak English at home.
1.4% of residents speak Spanish at home 49 48.5% Speak English very well52 51.5% Speak English less than very well6.7% of residents speak other language at home 431 89.6% Speak English very well50 10.4% Speak English less than very well
English speakers - Native, born elsewhere 45.5% of residents of Pecan Grove speak English at home.
41.0% of residents speak Spanish at home 204 100.0% Speak English very well
English speakers - Foreign-born 28.9% of residents of Pecan Grove speak English at home.
18.8% of residents speak Spanish at home 231 45.9% Speak English very well272 54.1% Speak English less than very well53.4% of residents speak other language at home 1,006 70.3% Speak English very well425 29.7% Speak English less than very well
White (Caucasian) - Speak only English Native:
97.0% (11,679)Foreign-born:
61.2% (302)
White (Caucasian) - Speak another language Native:
5.3% (634)Foreign-born:
50.3% (248)
Black or African American - Speak only English Native:
95.4% (1,936)Foreign-born:
38.3% (161)
Black or African American - Speak another language Native:
3.4% (69)Foreign-born:
61.6% (260)
Asian - Speak only English Native:
62.9% (542)Foreign-born:
14.4% (169)
Asian - Speak another language Native:
37.2% (321)Foreign-born:
86.0% (1,015)
Other race - Speak another language Native:
73.9% (387)Foreign-born:
93.1% (118)
Two or more races - Speak only English Native:
52.2% (2,100)Foreign-born:
35.4% (70)
Two or more races - Speak another language Native:
48.8% (1,964)Foreign-born:
55.2% (109)
White alone - Speak only English Native:
95.5% (10,007)Foreign-born:
84.0% (279)
White alone - Speak another language Native:
4.5% (469)Foreign-born:
18.6% (62)
Hispanic or Latino - Speak only English Native:
61.5% (4,036)Foreign-born:
14.8% (85)
Hispanic or Latino - Speak another language Native:
36.3% (2,384)Foreign-born:
87.8% (505)
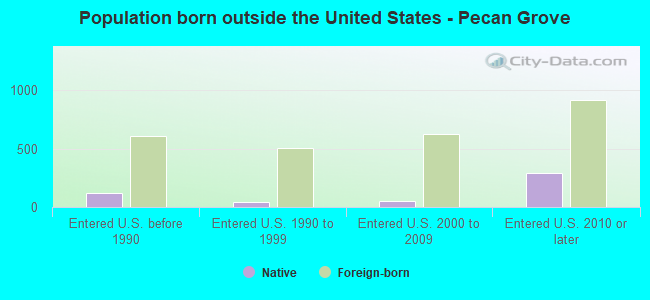
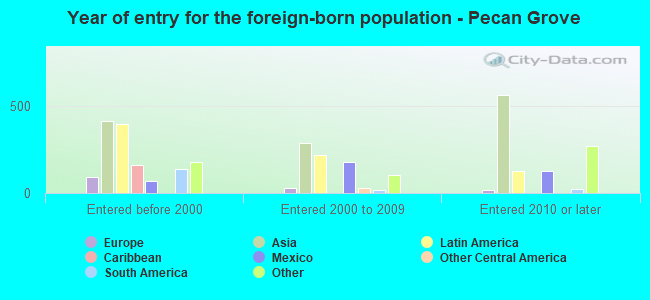
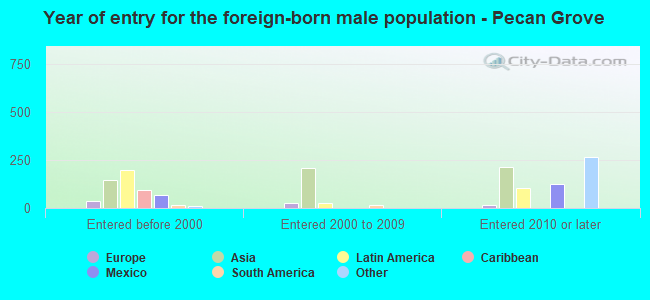
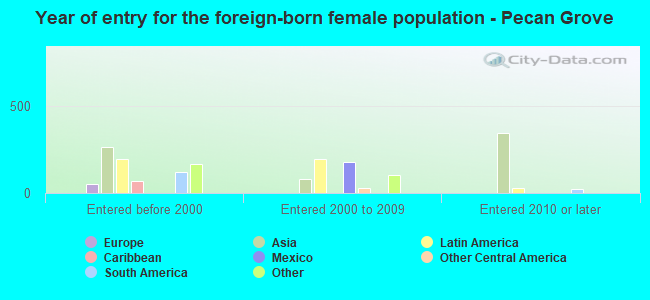
Foreign-born residents in Pecan Grove 2,581 residents are foreign born (4.8% Asia , 3.2% Latin America , 1.7% Africa ).
This city:
10.6%Texas:
17.1%
Marital status for residents in Pecan Grove Marital status - White (Caucasian) population 15 years and over
Males 17.5% Never married75.0% Now married0.3% Separated1.8% Widowed5.3% DivorcedFemales 19.9% Never married65.9% Now married2.1% Separated6.6% Widowed5.6% DivorcedWomen who gave birth in the past 12 months Now married:
100.0% (132)Unmarried:
0.0% (0)
Women who did not give birth in the past 12 months Now married:
57.2% (1,471)Unmarried:
42.8% (1,103)
Marital status - Black or African American population 15 years and over
Males 27.7% Never married63.0% Now married0.0% Separated0.0% Widowed9.3% DivorcedFemales 7.5% Never married62.0% Now married0.0% Separated15.6% Widowed14.9% DivorcedWomen who did not give birth in the past 12 months Now married:
86.9% (428)Unmarried:
13.1% (64)
Marital status - Asian population 15 years and over
Males 23.8% Never married62.9% Now married0.0% Separated5.9% Widowed7.5% DivorcedFemales 26.0% Never married60.4% Now married0.0% Separated9.9% Widowed3.7% DivorcedWomen who gave birth in the past 12 months Now married:
100.0% (71)Unmarried:
0.0% (0)
Women who did not give birth in the past 12 months Now married:
62.3% (457)Unmarried:
37.7% (276)
Marital status - Other race population 15 years and over
Males 0.0% Never married100.0% Now married0.0% Separated0.0% Widowed0.0% DivorcedFemales 32.8% Never married50.8% Now married0.0% Separated0.0% Widowed16.4% DivorcedWomen who gave birth in the past 12 months Now married:
0.0% (0)Unmarried:
100.0% (35)
Women who did not give birth in the past 12 months Now married:
62.6% (95)Unmarried:
37.4% (57)
Marital status - Two or more races population 15 years and over
Males 46.4% Never married50.8% Now married0.0% Separated0.0% Widowed2.7% DivorcedFemales 18.4% Never married76.6% Now married1.7% Separated3.3% Widowed0.0% DivorcedWomen who did not give birth in the past 12 months Now married:
56.9% (373)Unmarried:
43.1% (283)
Marital status - White alone, not Hispanic / Latino population 15 years and over
Males 12.4% Never married80.0% Now married0.4% Separated2.4% Widowed4.8% DivorcedFemales 15.9% Never married67.7% Now married2.5% Separated7.1% Widowed6.9% DivorcedWomen who gave birth in the past 12 months Now married:
100.0% (119)Unmarried:
0.0% (0)
Women who did not give birth in the past 12 months Now married:
58.3% (1,236)Unmarried:
41.7% (884)
Marital status - Hispanic or Latino population 15 years and over
Males 33.1% Never married61.9% Now married0.0% Separated0.0% Widowed5.0% DivorcedFemales 30.1% Never married66.2% Now married0.2% Separated2.7% Widowed0.8% DivorcedWomen who gave birth in the past 12 months Now married:
64.6% (46)Unmarried:
35.4% (25)
Women who did not give birth in the past 12 months Now married:
56.1% (1,039)Unmarried:
43.9% (813)
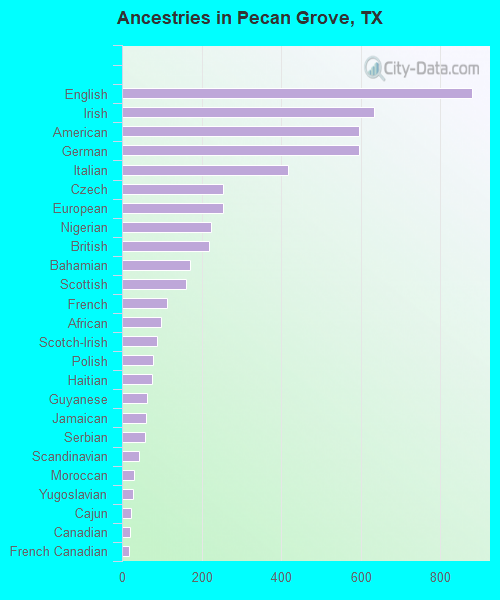
Ancestries in Pecan Grove
879 6.6% English633 4.7% Irish597 4.5% American595 4.4% German418 3.1% Italian255 1.9% Czech253 1.9% European223 1.7% Nigerian218 1.6% British170 1.3% Bahamian160 1.2% Scottish113 0.8% French98 0.7% African89 0.7% Scotch-Irish78 0.6% Polish76 0.6% Haitian62 0.5% Guyanese60 0.4% Jamaican59 0.4% Serbian42 0.3% Scandinavian31 0.2% Moroccan28 0.2% Yugoslavian22 0.2% Cajun20 0.1% Canadian18 0.1% French Canadian16 0.1% Portuguese8 0.06% Swedish7 0.05% Eastern European
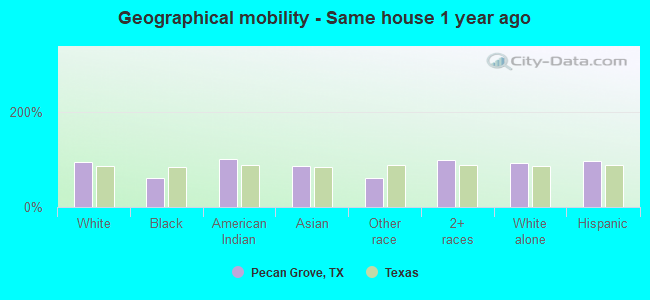
Geographical mobility in Pecan Grove Same house 1 year ago 11,917 94.6% White (Caucasian)1,623 61.4% Black or African American182 100.0% American Indian / Alaska Native1,870 86.2% Asian413 60.1% Other race4,456 98.5% Two or more races10,192 92.3% White alone, not Hispanic / Latino7,162 96.8% Hispanic or LatinoMoved within same county 338 2.7% White / Caucasian319 12.1% Black or African American29 1.3% Asian85 12.4% Other race122 2.7% Two or more races395 3.6% White alone, not Hispanic / Latino155 2.1% Hispanic or LatinoMoved within same state 348 2.8% White / Caucasian276 10.4% Black or African American193 8.9% Asian134 19.5% Other race444 4.0% White alone, not Hispanic / Latino101 1.4% Hispanic or LatinoMoved from different state 40 0.3% White / Caucasian291 11.0% Black or African American61 2.8% Asian39 0.4% White alone, not Hispanic / LatinoMoved from abroad 12 0.1% White13 0.1% White alone, not Hispanic / Latino
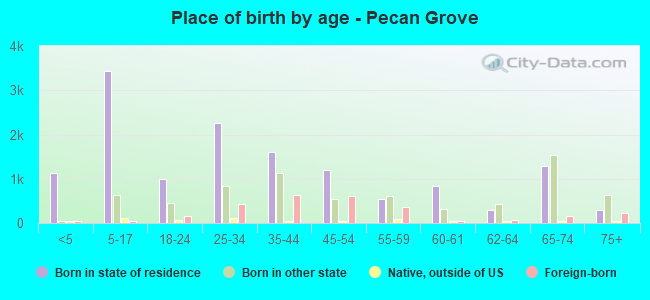
Children Nativity (place of birth) in Pecan Grove
Children under 6 years - Living with two parents Both parents native 1,026 100.0% NativeBoth parents foreign-born 120 100.0% NativeOne native, one foreign-born parent 154 100.0% NativeChildren under 6 years - Living with one parent Native parent 32 100.0% Native
Children 6 to 17 years - Living with two parents Both parents native 2,073 100.0% NativeBoth parents foreign-born 489 100.0% NativeOne native, one foreign-born parent 165 100.0% NativeChildren 6 to 17 years - Living with one parent Native parent 1,140 100.0% Native
Grandparents responsible for own grandchildren in Pecan Grove
Grandparents (30 to 59 years) White / Caucasian 26 15.6% Responsible for grandchildren139 84.4% Not responsible for grandchildrenAsian 43 100.0% Not responsible for grandchildrenWhite alone, not Hispanic / Latino 14 10.6% Responsible for grandchildren122 89.4% Not responsible for grandchildrenHispanic or Latino 11 100.0% Not responsible for grandchildrenGrandparents (60 years and over) White / Caucasian 77 25.3% Responsible for grandchildren226 74.7% Not responsible for grandchildrenAsian 30 100.0% Not responsible for grandchildrenWhite alone, not Hispanic / Latino 109 30.5% Responsible for grandchildren250 69.5% Not responsible for grandchildrenHispanic or Latino 60 100.0% Not responsible for grandchildren