Races in Payson, Utah (UT) Detailed Stats
Data:
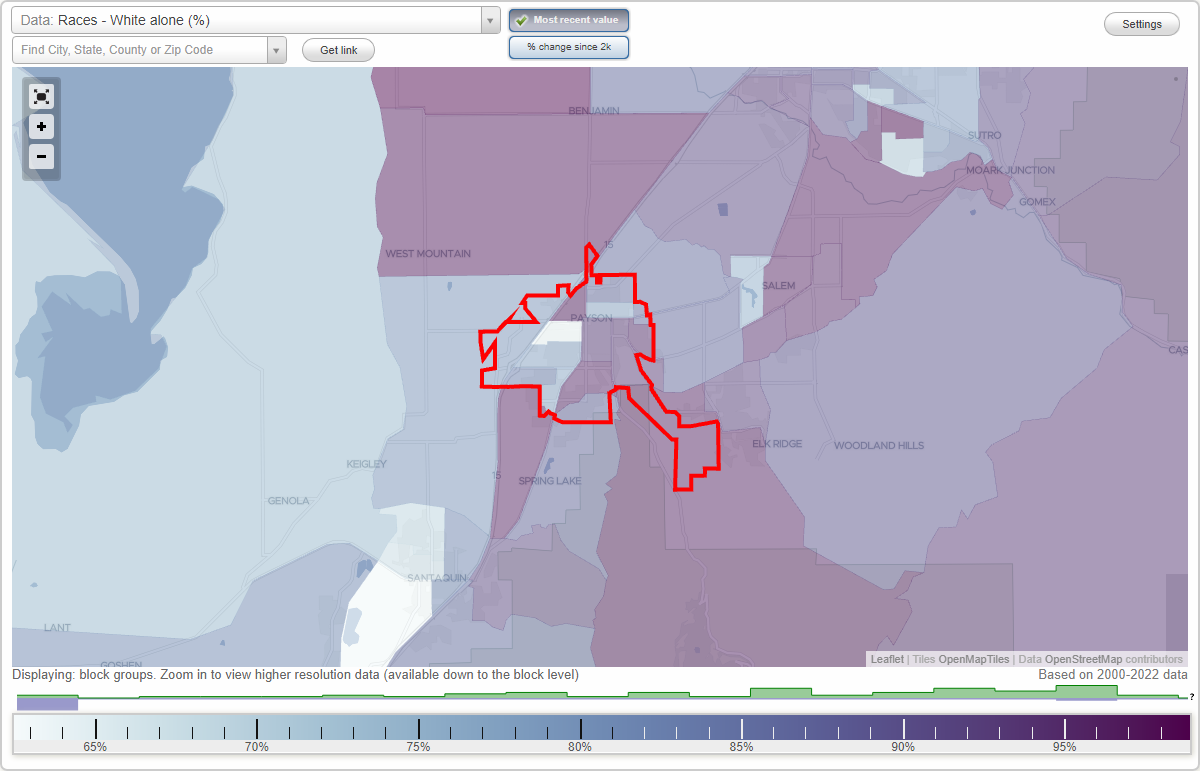
Races - White alone (%)
Races - White alone (% change since 2000)
Races - Black alone (%)
Races - Black alone (% change since 2000)
Races - American Indian alone (%)
Races - American Indian alone (% change since 2000)
Races - Asian alone (%)
Races - Asian alone (% change since 2000)
Races - Hispanic (%)
Races - Hispanic (% change since 2000)
Races - Native Hawaiian and Other Pacific Islander alone (%)
Races - Native Hawaiian and Other Pacific Islander alone (% change since 2000)
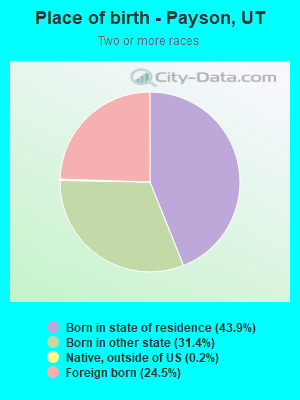
Races - Two or more races(%)
Races - Two or more races(% change since 2000)
Races - Other race alone (%)
Races - Other race alone (% change since 2000)
Racial diversity
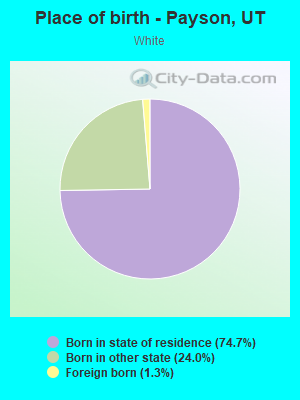
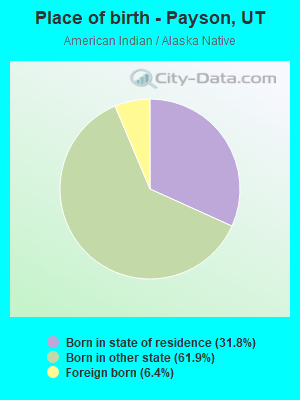
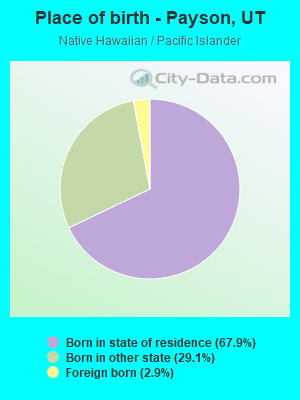
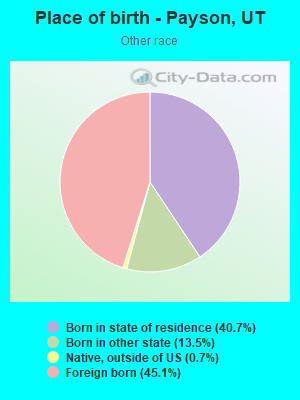
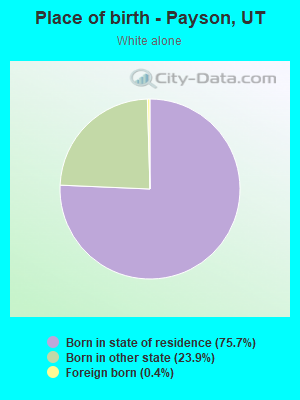
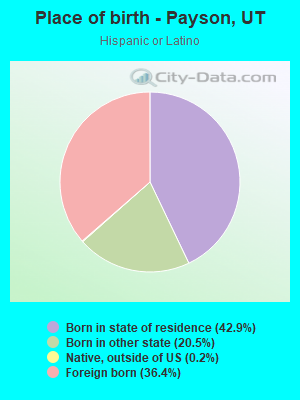
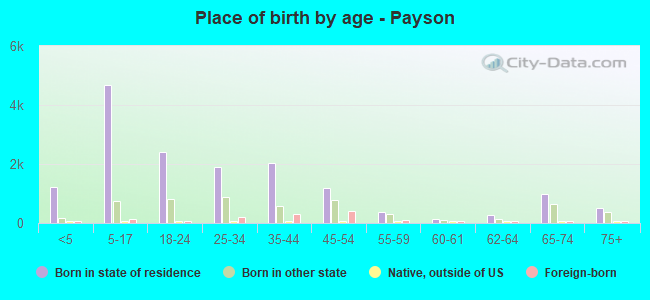
Place of birth - Born in state of residence (%)
Place of birth - Born in state of residence (%) - White
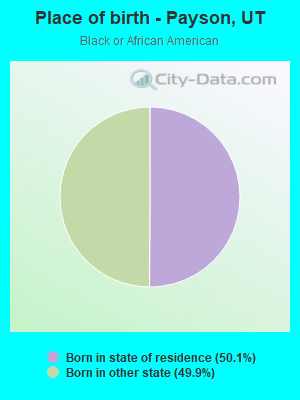
Place of birth - Born in state of residence (%) - Black or African American
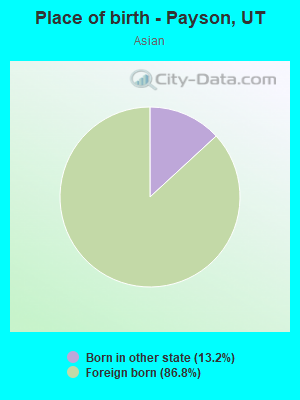
Place of birth - Born in state of residence (%) - Asian
Place of birth - Born in state of residence (%) - Hispanic or Latino
Place of birth - Born in state of residence (%) - American Indian and Alaska Native
Place of birth - Born in state of residence (%) - Multirace
Place of birth - Born in state of residence (%) - Other Race
Place of birth - Born in other state (%)
Place of birth - Born in other state (%) - White
Place of birth - Born in other state (%) - Black or African American
Place of birth - Born in other state (%) - Asian
Place of birth - Born in other state (%) - Hispanic or Latino
Place of birth - Born in other state (%) - American Indian and Alaska Native
Place of birth - Born in other state (%) - Multirace
Place of birth - Born in other state (%) - Other Race
Place of birth - Native, outside of US (%)
Place of birth - Native, outside of US (%) - White
Place of birth - Native, outside of US (%) - Black or African American
Place of birth - Native, outside of US (%) - Asian
Place of birth - Native, outside of US (%) - Hispanic or Latino
Place of birth - Native, outside of US (%) - American Indian and Alaska Native
Place of birth - Native, outside of US (%) - Multirace
Place of birth - Native, outside of US (%) - Other Race
Place of birth - Foreign born (%)
Place of birth - Foreign born (%) - White
Place of birth - Foreign born (%) - Black or African American
Place of birth - Foreign born (%) - Asian
Place of birth - Foreign born (%) - Hispanic or Latino
Place of birth - Foreign born (%) - American Indian and Alaska Native
Place of birth - Foreign born (%) - Multirace
Place of birth - Foreign born (%) - Other Race
Residents speaking English at home (%)
Residents speaking English at home - Born in the United States (%)
Residents speaking English at home - Native, born elsewhere (%)
Residents speaking English at home - Foreign born (%)
Residents speaking Spanish at home (%)
Residents speaking Spanish at home - Born in the United States (%)
Residents speaking Spanish at home - Native, born elsewhere (%)
Residents speaking Spanish at home - Foreign born (%)
Residents speaking other language at home (%)
Residents speaking other language at home - Born in the United States (%)
Residents speaking other language at home - Native, born elsewhere (%)
Residents speaking other language at home - Foreign born (%)
Marital status - Never married (%)
Marital status - Now married (%)
Marital status - Separated (%)
Marital status - Widowed (%)
Marital status - Divorced (%)
Ancestries Reported - Arab (%)
Ancestries Reported - Czech (%)
Ancestries Reported - Danish (%)
Ancestries Reported - Dutch (%)
Ancestries Reported - English (%)
Ancestries Reported - French (%)
Ancestries Reported - French Canadian (%)
Ancestries Reported - German (%)
Ancestries Reported - Greek (%)
Ancestries Reported - Hungarian (%)
Ancestries Reported - Irish (%)
Ancestries Reported - Italian (%)
Ancestries Reported - Lithuanian (%)
Ancestries Reported - Norwegian (%)
Ancestries Reported - Polish (%)
Ancestries Reported - Portuguese (%)
Ancestries Reported - Russian (%)
Ancestries Reported - Scotch-Irish (%)
Ancestries Reported - Scottish (%)
Ancestries Reported - Slovak (%)
Ancestries Reported - Subsaharan African (%)
Ancestries Reported - Swedish (%)
Ancestries Reported - Swiss (%)
Ancestries Reported - Ukrainian (%)
Ancestries Reported - United States (%)
Ancestries Reported - Welsh (%)
Ancestries Reported - West Indian (%)
Ancestries Reported - Other (%)
Geographical mobility - Same house 1 year ago (%)
Geographical mobility - Same house 1 year ago (%) - White
Geographical mobility - Same house 1 year ago (%) - Black or African American
Geographical mobility - Same house 1 year ago (%) - Asian
Geographical mobility - Same house 1 year ago (%) - Hispanic or Latino
Geographical mobility - Same house 1 year ago (%) - American Indian and Alaska Native
Geographical mobility - Same house 1 year ago (%) - Multirace
Geographical mobility - Same house 1 year ago (%) - Other Race
Geographical mobility - Moved within same county (%)
Geographical mobility - Moved within same county (%) - White
Geographical mobility - Moved within same county (%) - Black or African American
Geographical mobility - Moved within same county (%) - Asian
Geographical mobility - Moved within same county (%) - Hispanic or Latino
Geographical mobility - Moved within same county (%) - American Indian and Alaska Native
Geographical mobility - Moved within same county (%) - Multirace
Geographical mobility - Moved within same county (%) - Other Race
Geographical mobility - Moved from different county within same state (%)
Geographical mobility - Moved from different county within same state (%) - White
Geographical mobility - Moved from different county within same state (%) - Black or African American
Geographical mobility - Moved from different county within same state (%) - Asian
Geographical mobility - Moved from different county within same state (%) - Hispanic or Latino
Geographical mobility - Moved from different county within same state (%) - American Indian and Alaska Native
Geographical mobility - Moved from different county within same state (%) - Multirace
Geographical mobility - Moved from different county within same state (%) - Other Race
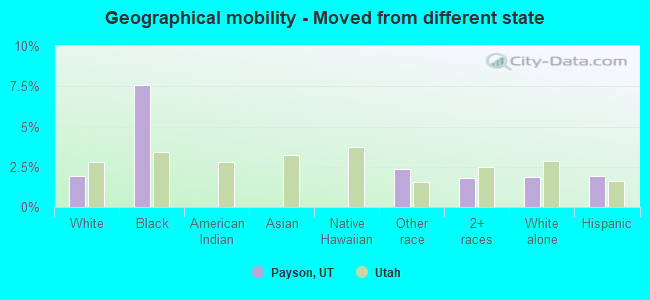
Geographical mobility - Moved from different state (%)
Geographical mobility - Moved from different state (%) - White
Geographical mobility - Moved from different state (%) - Black or African American
Geographical mobility - Moved from different state (%) - Asian
Geographical mobility - Moved from different state (%) - Hispanic or Latino
Geographical mobility - Moved from different state (%) - American Indian and Alaska Native
Geographical mobility - Moved from different state (%) - Multirace
Geographical mobility - Moved from different state (%) - Other Race
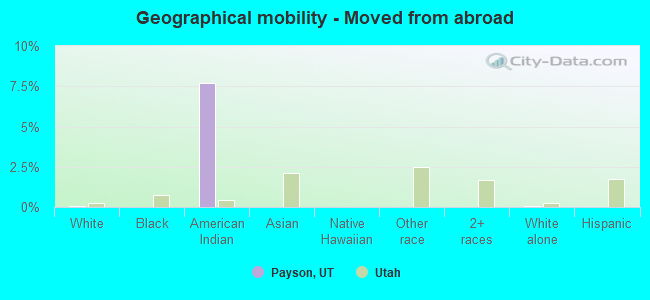
Geographical mobility - Moved from abroad (%)
Geographical mobility - Moved from abroad (%) - White
Geographical mobility - Moved from abroad (%) - Black or African American
Geographical mobility - Moved from abroad (%) - Asian
Geographical mobility - Moved from abroad (%) - Hispanic or Latino
Geographical mobility - Moved from abroad (%) - American Indian and Alaska Native
Geographical mobility - Moved from abroad (%) - Multirace
Geographical mobility - Moved from abroad (%) - Other Race
Place of birth for the foreign-born population - Ireland (%)
Place of birth for the foreign-born population - Denmark (%)
Place of birth for the foreign-born population - Norway (%)
Place of birth for the foreign-born population - Sweden (%)
Place of birth for the foreign-born population - United Kingdom (%)
Place of birth for the foreign-born population - England (%)
Place of birth for the foreign-born population - Scotland (%)
Place of birth for the foreign-born population - Other Northern Europe (%)
Place of birth for the foreign-born population - Austria (%)
Place of birth for the foreign-born population - Belgium (%)
Place of birth for the foreign-born population - France (%)
Place of birth for the foreign-born population - Germany (%)
Place of birth for the foreign-born population - Netherlands (%)
Place of birth for the foreign-born population - Switzerland (%)
Place of birth for the foreign-born population - Other Western Europe (%)
Place of birth for the foreign-born population - Greece (%)
Place of birth for the foreign-born population - Italy (%)
Place of birth for the foreign-born population - Portugal (%)
Place of birth for the foreign-born population - Spain (%)
Place of birth for the foreign-born population - Other Southern Europe (%)
Place of birth for the foreign-born population - Albania (%)
Place of birth for the foreign-born population - Belarus (%)
Place of birth for the foreign-born population - Bosnia and Herzegovina (%)
Place of birth for the foreign-born population - Bulgaria (%)
Place of birth for the foreign-born population - Croatia (%)
Place of birth for the foreign-born population - Czechoslovakia (%)
Place of birth for the foreign-born population - Hungary (%)
Place of birth for the foreign-born population - Latvia (%)
Place of birth for the foreign-born population - Lithuania (%)
Place of birth for the foreign-born population - North Macedonia (Macedonia) (%)
Place of birth for the foreign-born population - Moldova (%)
Place of birth for the foreign-born population - Poland (%)
Place of birth for the foreign-born population - Romania (%)
Place of birth for the foreign-born population - Russia (%)
Place of birth for the foreign-born population - Serbia (%)
Place of birth for the foreign-born population - Ukraine (%)
Place of birth for the foreign-born population - Other Eastern Europe (%)
Place of birth for the foreign-born population - China (%)
Place of birth for the foreign-born population - Hong Kong (%)
Place of birth for the foreign-born population - Taiwan (%)
Place of birth for the foreign-born population - Japan (%)
Place of birth for the foreign-born population - Korea (%)
Place of birth for the foreign-born population - Other Eastern Asia (%)
Place of birth for the foreign-born population - Afghanistan (%)
Place of birth for the foreign-born population - Bangladesh (%)
Place of birth for the foreign-born population - India (%)
Place of birth for the foreign-born population - Iran (%)
Place of birth for the foreign-born population - Kazakhstan (%)
Place of birth for the foreign-born population - Nepal (%)
Place of birth for the foreign-born population - Pakistan (%)
Place of birth for the foreign-born population - Sri Lanka (%)
Place of birth for the foreign-born population - Uzbekistan (%)
Place of birth for the foreign-born population - Other South Central Asia (%)
Place of birth for the foreign-born population - Burma (%)
Place of birth for the foreign-born population - Cambodia (%)
Place of birth for the foreign-born population - Indonesia (%)
Place of birth for the foreign-born population - Laos (%)
Place of birth for the foreign-born population - Malaysia (%)
Place of birth for the foreign-born population - Philippines (%)
Place of birth for the foreign-born population - Singapore (%)
Place of birth for the foreign-born population - Thailand (%)
Place of birth for the foreign-born population - Vietnam (%)
Place of birth for the foreign-born population - Other South Eastern Asia (%)
Place of birth for the foreign-born population - Armenia (%)
Place of birth for the foreign-born population - Iraq (%)
Place of birth for the foreign-born population - Israel (%)
Place of birth for the foreign-born population - Jordan (%)
Place of birth for the foreign-born population - Kuwait (%)
Place of birth for the foreign-born population - Lebanon (%)
Place of birth for the foreign-born population - Saudi Arabia (%)
Place of birth for the foreign-born population - Syria (%)
Place of birth for the foreign-born population - Turkey (%)
Place of birth for the foreign-born population - Yemen (%)
Place of birth for the foreign-born population - Other Western Asia (%)
Place of birth for the foreign-born population - Eritrea (%)
Place of birth for the foreign-born population - Ethiopia (%)
Place of birth for the foreign-born population - Kenya (%)
Place of birth for the foreign-born population - Somalia (%)
Place of birth for the foreign-born population - Uganda (%)
Place of birth for the foreign-born population - Zimbabwe (%)
Place of birth for the foreign-born population - Other Eastern Africa (%)
Place of birth for the foreign-born population - Cameroon (%)
Place of birth for the foreign-born population - Congo (%)
Place of birth for the foreign-born population - Democratic Republic of Congo (Zaire) (%)
Place of birth for the foreign-born population - Other Middle Africa (%)
Place of birth for the foreign-born population - Egypt (%)
Place of birth for the foreign-born population - Morocco (%)
Place of birth for the foreign-born population - Sudan (%)
Place of birth for the foreign-born population - Other Northern Africa (%)
Place of birth for the foreign-born population - South Africa (%)
Place of birth for the foreign-born population - Other Southern Africa (%)
Place of birth for the foreign-born population - Cabo Verde (%)
Place of birth for the foreign-born population - Ghana (%)
Place of birth for the foreign-born population - Liberia (%)
Place of birth for the foreign-born population - Nigeria (%)
Place of birth for the foreign-born population - Senegal (%)
Place of birth for the foreign-born population - Sierra Leone (%)
Place of birth for the foreign-born population - Other Western Africa (%)
Place of birth for the foreign-born population - Australia (%)
Place of birth for the foreign-born population - New Zealand (%)
Place of birth for the foreign-born population - Fiji (%)
Place of birth for the foreign-born population - Micronesia (%)
Place of birth for the foreign-born population - Bahamas (%)
Place of birth for the foreign-born population - Barbados (%)
Place of birth for the foreign-born population - Cuba (%)
Place of birth for the foreign-born population - Dominica (%)
Place of birth for the foreign-born population - Dominican Republic (%)
Place of birth for the foreign-born population - Grenada (%)
Place of birth for the foreign-born population - Haiti (%)
Place of birth for the foreign-born population - Jamaica (%)
Place of birth for the foreign-born population - St. Vincent and the Grenadines (%)
Place of birth for the foreign-born population - Trinidad and Tobago (%)
Place of birth for the foreign-born population - West Indies (%)
Place of birth for the foreign-born population - Other Caribbean (%)
Place of birth for the foreign-born population - Belize (%)
Place of birth for the foreign-born population - Costa Rica (%)
Place of birth for the foreign-born population - El Salvador (%)
Place of birth for the foreign-born population - Guatemala (%)
Place of birth for the foreign-born population - Honduras (%)
Place of birth for the foreign-born population - Mexico (%)
Place of birth for the foreign-born population - Nicaragua (%)
Place of birth for the foreign-born population - Panama (%)
Place of birth for the foreign-born population - Other Central America (%)
Place of birth for the foreign-born population - Argentina (%)
Place of birth for the foreign-born population - Bolivia (%)
Place of birth for the foreign-born population - Brazil (%)
Place of birth for the foreign-born population - Chile (%)
Place of birth for the foreign-born population - Colombia (%)
Place of birth for the foreign-born population - Ecuador (%)
Place of birth for the foreign-born population - Guyana (%)
Place of birth for the foreign-born population - Peru (%)
Place of birth for the foreign-born population - Uruguay (%)
Place of birth for the foreign-born population - Venezuela (%)
Place of birth for the foreign-born population - Other South America (%)
Place of birth for the foreign-born population - Canada (%)
Place of birth for the foreign-born population - Other Northern America (%)
Place of birth for the foreign-born population - Other (%)
Latest news about races in Payson, UT collected exclusively by city-data.com from local newspapers, TV, and radio stations
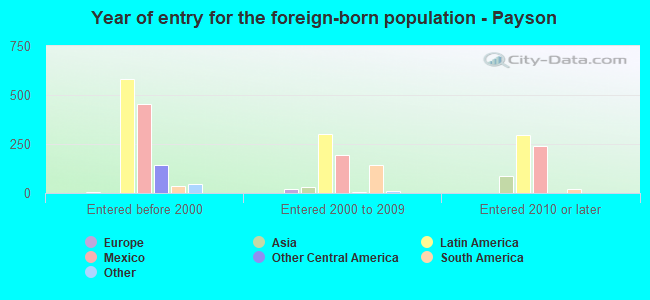
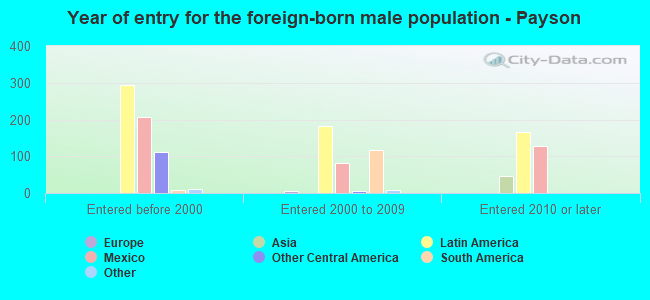
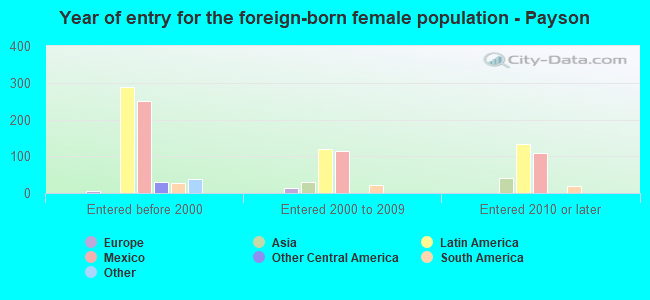
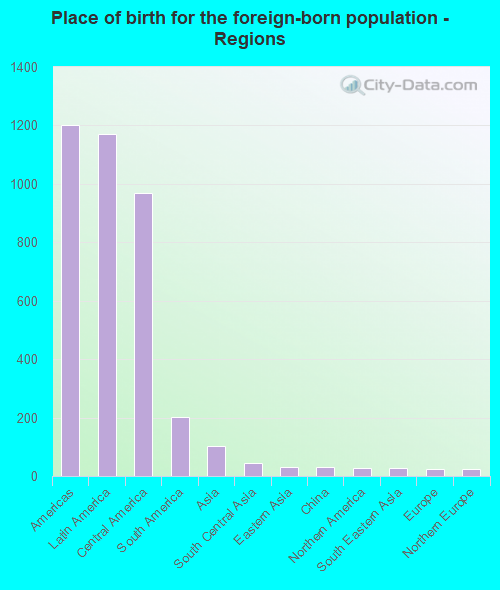
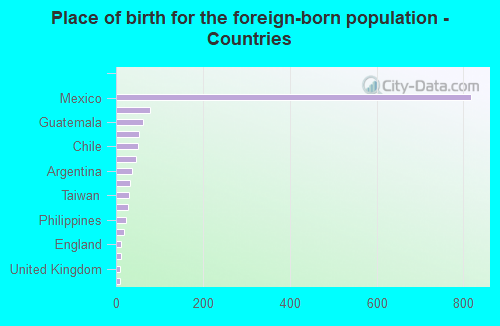
According to 2022 data, the most numerous races in Payson, UT are White alone (17,865 residents), Hispanic (3,441 residents), and Two or more races (558 residents). 85.0% of Payson residents speak English at home. 5.9% of Payson, UT residents are foreign-born (5.1% born in Latin America), which is 34.8% less than the foreign-born rate of 8.0% across the entire state of Utah.
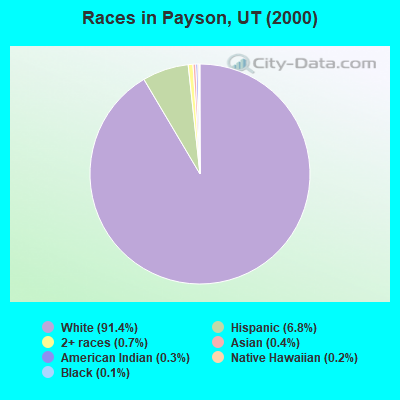
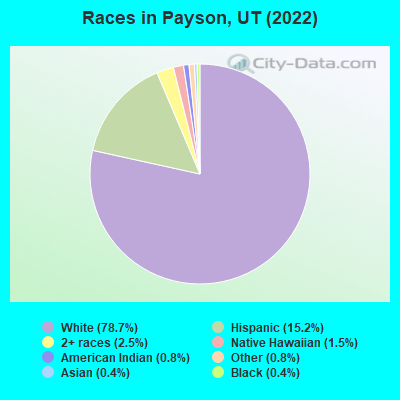
Race distribution in Payson
2000 2022
1,904,265 85.3% White alone 201,559 9.0% Hispanic 36,483 1.6% Asian alone 31,308 1.4% Two or more races 26,663 1.2% American Indian alone 14,806 0.7% Native Hawaiian and Other 16,137 0.7% Black alone 1,948 0.09% Other race alone
2,557,466 75.6% White alone 512,086 15.1% Hispanic 119,308 3.5% Two or more races 82,388 2.4% Asian alone 36,978 1.1% Native Hawaiian and Other 34,873 1.0% Black alone 22,803 0.7% American Indian alone 14,898 0.4% Other race alone
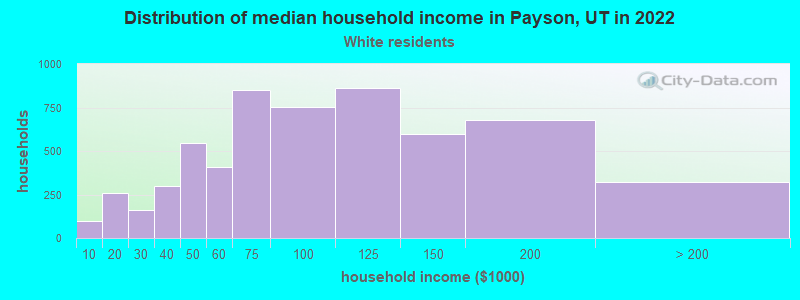
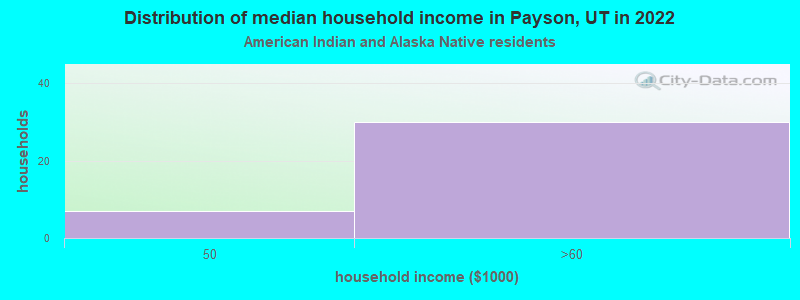
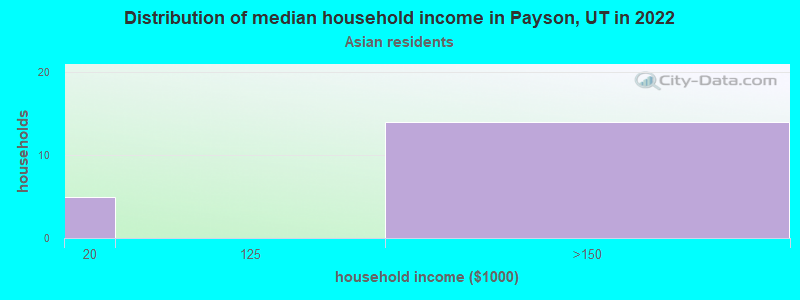
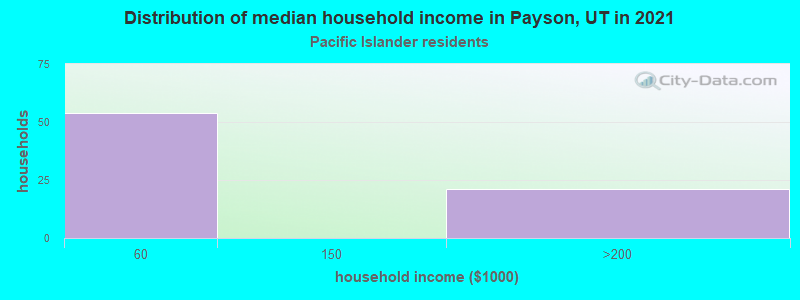
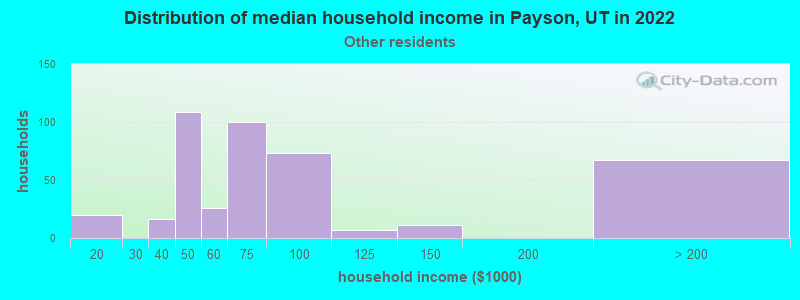
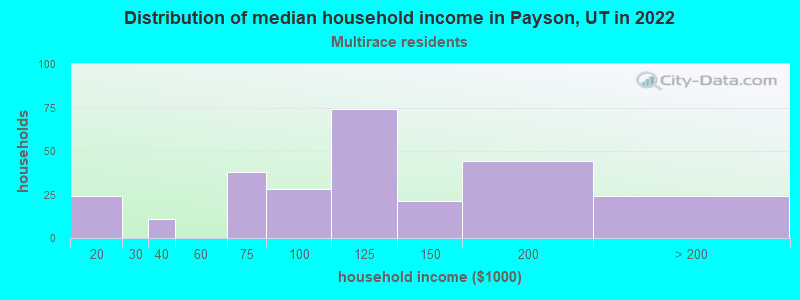
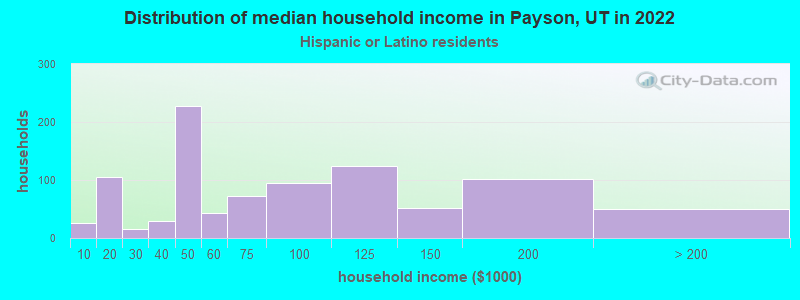
Income and house value in Payson Median household income in 2022 $85,592 White non-Hispanic householders$64,706 Some other race householders$110,230 Two or more races householders$66,146 Hispanic or Latino race householdersMedian 2022 house value $429,935 White Non-Hispanic householders$542,426 American Indian or Alaska Native householders$425,595 Some other race householders$379,865 Hispanic or Latino householders
Median age by race in Payson
29.3 Median age for White residents27.9 31.5 16.5 Median age for Black or African American residents15.3 13.3 23.1 Median age for American Indian / Alaska Native residents17.0 24.3 32.2 Median age for Asian residents35.5 29.9 11.6 Median age for Native Hawaiian / Pacific Islander residents16.4 8.7 27.1 Median age for Other race residents24.1 38.0 23.4 Median age for Two or more races residents24.7 20.1 29.4 Median age for White alone residents27.5 32.2 26.4 Median age for Hispanic or Latino residents26.8 25.8
Owner/renter occupied households by race in Payson
House owners and renters - White residents 4,774 81.7% Owner occupied1,069 18.3% Renter occupiedHouse owners and renters - Black or African American residents 21 100.0% Owner occupiedHouse owners and renters - American Indian / Alaska Native residents 15 70.3% Owner occupied6 29.7% Renter occupiedHouse owners and renters - Asian residents 28 100.0% Owner occupiedHouse owners and renters - Native Hawaiian / Pacific Islander residents 99 100.0% Owner occupiedHouse owners and renters - Other race residents 355 73.4% Owner occupied128 26.6% Renter occupiedHouse owners and renters - Two or more races residents 238 77.8% Owner occupied68 22.2% Renter occupiedHouse owners and renters - White alone residents 4,573 83.2% Owner occupied924 16.8% Renter occupiedHouse owners and renters - Hispanic or Latino residents 650 68.3% Owner occupied302 31.7% Renter occupied
Language usage in Payson
English speakers - Total 85.0% of residents of Payson speak English at home.
13.1% of residents speak Spanish at home 1,529 54.6% Speak English very well1,269 45.4% Speak English less than very well2.2% of residents speak other language at home 434 91.8% Speak English very well39 8.2% Speak English less than very well
English speakers - Born in the United States 84.7% of residents of Payson speak English at home.
11.5% of residents speak Spanish at home 580 94.2% Speak English very well36 5.8% Speak English less than very well3.3% of residents speak other language at home 179 100.0% Speak English very well
All residents speak only English at home
English speakers - Foreign-born 10.6% of residents of Payson speak English at home.
88.9% of residents speak Spanish at home 229 17.8% Speak English very well1,058 82.2% Speak English less than very well7.0% of residents speak other language at home 97 95.1% Speak English very well5 4.9% Speak English less than very well
White (Caucasian) - Speak only English Native:
93.9% (16,421)Foreign-born:
18.6% (45)
White (Caucasian) - Speak another language Native:
6.0% (1,049)Foreign-born:
70.4% (171)
Asian - Speak only English Native:
89.3% (15)Foreign-born:
30.1% (28)
Native Hawaiian / Pacific Islander - Speak another language Native:
19.1% (52)Foreign-born:
90.6% (10)
Other race - Speak only English Native:
49.7% (450)Foreign-born:
2.6% (21)
Other race - Speak another language Native:
41.8% (378)Foreign-born:
98.7% (788)
Two or more races - Speak only English Native:
64.0% (691)Foreign-born:
18.0% (71)
Two or more races - Speak another language Native:
38.5% (415)Foreign-born:
81.7% (324)
White alone - Speak only English Native:
95.1% (16,031)Foreign-born:
65.3% (52)
White alone - Speak another language Native:
4.9% (829)Foreign-born:
35.9% (29)
Hispanic or Latino - Speak only English Native:
50.7% (959)Foreign-born:
3.4% (43)
Hispanic or Latino - Speak another language Native:
49.3% (933)Foreign-born:
96.6% (1,206)
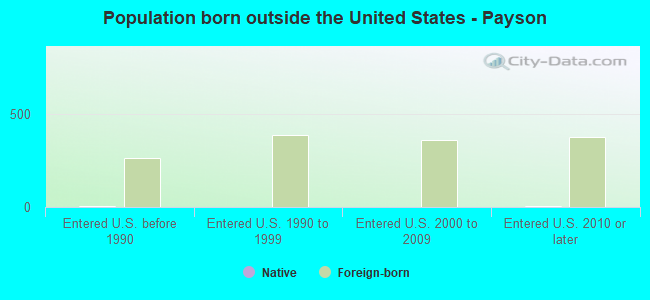
Foreign-born residents in Payson 1,348 residents are foreign born (5.1% Latin America ).
Marital status for residents in Payson Marital status - White (Caucasian) population 15 years and over
Males 37.9% Never married53.6% Now married0.8% Separated1.2% Widowed6.4% DivorcedFemales 26.0% Never married57.3% Now married1.0% Separated6.8% Widowed8.9% DivorcedWomen who gave birth in the past 12 months Now married:
89.5% (250)Unmarried:
10.5% (29)
Women who did not give birth in the past 12 months Now married:
52.5% (2,341)Unmarried:
47.5% (2,116)
Marital status - Black or African American population 15 years and over
Males 65.6% Never married34.4% Now married0.0% Separated0.0% Widowed0.0% DivorcedFemales 0.0% Never married100.0% Now married0.0% Separated0.0% Widowed0.0% DivorcedMarital status - American Indian / Alaska Native population 15 years and over
Males 76.2% Never married23.8% Now married0.0% Separated0.0% Widowed0.0% DivorcedFemales 57.5% Never married25.5% Now married0.0% Separated0.0% Widowed17.0% DivorcedWomen who did not give birth in the past 12 months Now married:
30.7% (29)Unmarried:
69.3% (66)
Marital status - Asian population 15 years and over
Males 40.5% Never married47.6% Now married0.0% Separated0.0% Widowed11.9% DivorcedFemales 0.0% Never married100.0% Now married0.0% Separated0.0% Widowed0.0% DivorcedWomen who did not give birth in the past 12 months Now married:
100.0% (36)Unmarried:
0.0% (0)
Marital status - Native Hawaiian / Pacific Islander population 15 years and over
Males 0.0% Never married100.0% Now married0.0% Separated0.0% Widowed0.0% DivorcedFemales 0.0% Never married31.8% Now married0.0% Separated0.0% Widowed68.2% DivorcedWomen who did not give birth in the past 12 months Now married:
100.0% (23)Unmarried:
0.0% (0)
Marital status - Other race population 15 years and over
Males 50.8% Never married40.2% Now married7.9% Separated0.0% Widowed1.1% DivorcedFemales 37.1% Never married50.1% Now married3.0% Separated1.9% Widowed7.9% DivorcedWomen who gave birth in the past 12 months Now married:
100.0% (20)Unmarried:
0.0% (0)
Women who did not give birth in the past 12 months Now married:
52.1% (282)Unmarried:
47.9% (259)
Marital status - Two or more races population 15 years and over
Males 28.9% Never married62.8% Now married0.0% Separated4.9% Widowed3.4% DivorcedFemales 37.6% Never married49.7% Now married1.4% Separated0.0% Widowed11.4% DivorcedWomen who gave birth in the past 12 months Now married:
100.0% (13)Unmarried:
0.0% (0)
Women who did not give birth in the past 12 months Now married:
47.7% (191)Unmarried:
52.3% (209)
Marital status - White alone, not Hispanic / Latino population 15 years and over
Males 36.8% Never married56.3% Now married0.4% Separated1.3% Widowed5.2% DivorcedFemales 25.6% Never married58.2% Now married1.0% Separated6.7% Widowed8.5% DivorcedWomen who gave birth in the past 12 months Now married:
94.0% (246)Unmarried:
6.0% (16)
Women who did not give birth in the past 12 months Now married:
52.6% (2,214)Unmarried:
47.4% (1,996)
Marital status - Hispanic or Latino population 15 years and over
Males 45.2% Never married39.2% Now married5.0% Separated1.6% Widowed8.9% DivorcedFemales 34.6% Never married48.2% Now married1.5% Separated4.2% Widowed11.5% DivorcedWomen who gave birth in the past 12 months Now married:
54.8% (19)Unmarried:
45.2% (15)
Women who did not give birth in the past 12 months Now married:
51.6% (489)Unmarried:
48.4% (458)
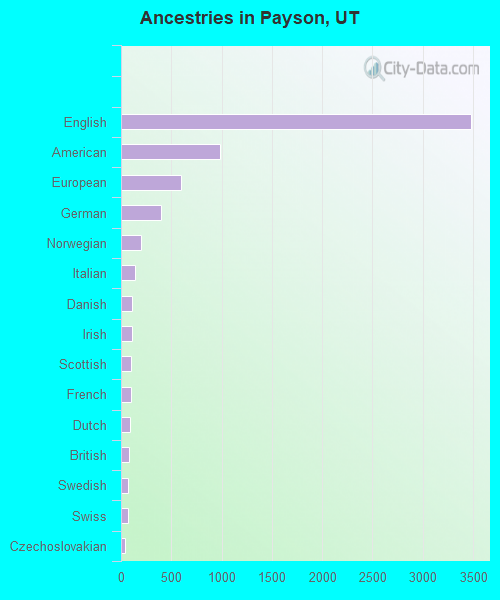
Ancestries in Payson
3,484 35.2% English989 10.0% American593 6.0% European397 4.0% German196 2.0% Norwegian139 1.4% Italian110 1.1% Danish108 1.1% Irish103 1.0% Scottish100 1.0% French91 0.9% Dutch76 0.8% British74 0.7% Swedish66 0.7% Swiss35 0.4% Czechoslovakian29 0.3% Welsh24 0.2% Scandinavian20 0.2% Polish19 0.2% Icelander14 0.1% French Canadian11 0.1% Canadian10 0.1% Northern European10 0.1% Portuguese9 0.09% Syrian3 0.03% Pennsylvania German2 0.02% Greek
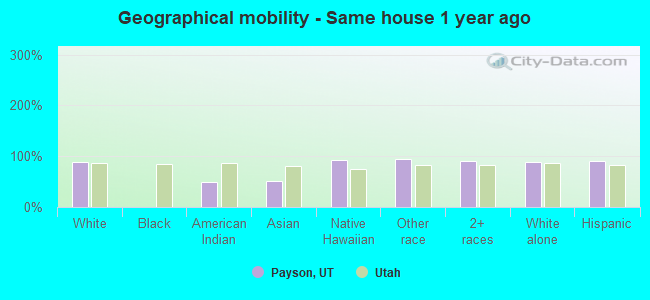
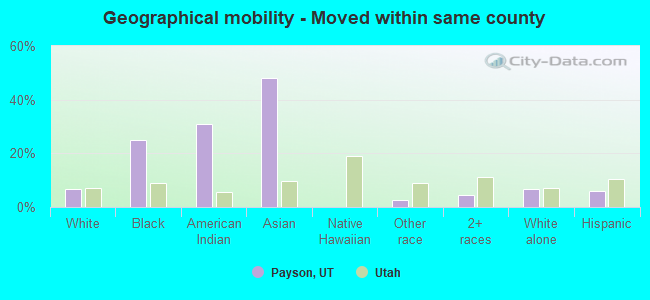
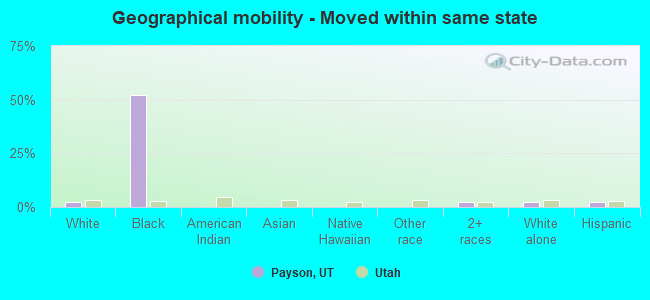
Geographical mobility in Payson Same house 1 year ago 16,569 89.5% White (Caucasian)91 50.1% American Indian / Alaska Native57 50.3% Asian272 92.6% Native Hawaiian / Pacific Islander1,635 94.3% Other race1,470 91.0% Two or more races15,823 89.4% White alone, not Hispanic / Latino3,048 90.0% Hispanic or LatinoMoved within same county 1,257 6.8% White / Caucasian26 25.0% Black or African American56 30.9% American Indian / Alaska Native54 48.0% Asian46 2.6% Other race70 4.3% Two or more races1,217 6.9% White alone, not Hispanic / Latino196 5.8% Hispanic or LatinoMoved within same state 457 2.5% White / Caucasian54 52.3% Black or African American40 2.5% Two or more races439 2.5% White alone, not Hispanic / Latino75 2.2% Hispanic or LatinoMoved from different state 356 1.9% White / Caucasian8 7.6% Black or African American41 2.4% Other race29 1.8% Two or more races332 1.9% White alone, not Hispanic / Latino66 2.0% Hispanic or LatinoMoved from abroad 14 0.1% White14 7.7% American Indian / Alaska Native13 0.1% White alone, not Hispanic / Latino
Children Nativity (place of birth) in Payson
Children under 6 years - Living with two parents Both parents native 1,116 100.0% NativeBoth parents foreign-born 67 100.0% NativeOne native, one foreign-born parent 79 100.0% NativeChildren under 6 years - Living with one parent Native parent 464 100.0% NativeForeign-born parent 26 100.0% NativeChildren 6 to 17 years - Living with two parents Both parents native 3,485 98.9% Native40 1.1% Foreign-bornBoth parents foreign-born 194 81.7% Native43 18.3% Foreign-bornOne native, one foreign-born parent 259 100.0% NativeChildren 6 to 17 years - Living with one parent Native parent 615 100.0% NativeForeign-born parent 153 63.5% Native88 36.5% Foreign-born
Grandparents responsible for own grandchildren in Payson
Grandparents (30 to 59 years) White / Caucasian 29 15.4% Responsible for grandchildren161 84.6% Not responsible for grandchildrenAmerican Indian / Alaska Native 15 100.0% Responsible for grandchildrenWhite alone, not Hispanic / Latino 32 15.4% Responsible for grandchildren174 84.6% Not responsible for grandchildrenHispanic or Latino 7 100.0% Not responsible for grandchildrenGrandparents (60 years and over) White / Caucasian 95 38.5% Responsible for grandchildren151 61.5% Not responsible for grandchildrenWhite alone, not Hispanic / Latino 66 31.2% Responsible for grandchildren145 68.8% Not responsible for grandchildrenHispanic or Latino 34 64.0% Responsible for grandchildren19 36.0% Not responsible for grandchildren