Races in Patterson Township, Pennsylvania (PA) Detailed Stats
Ancestries, Foreign-born residents, place of birth

Discuss Patterson Township, Pennsylvania races on our local forum with over 2,400,000 registered users
2.5% of Patterson Township, PA residents are foreign-born (1.2% born in Europe, 1.0% born in North America), which is 179.7% less than the foreign-born rate of 7.0% across the entire state of Pennsylvania.
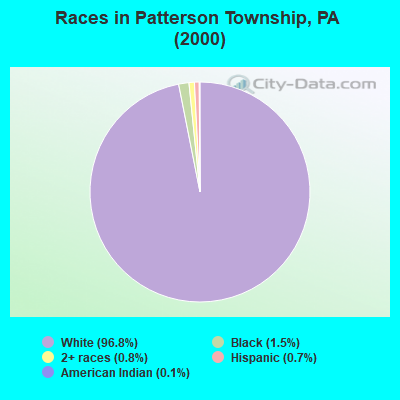
Race distribution in Patterson Township

- 3,09696.8%White alone
- 471.5%Black alone
- 260.8%Two or more races
- 210.7%Hispanic
- 40.1%American Indian alone
- 20.06%Asian alone
- 10.03%Other race alone
2000
2022
-
- 10,322,45584.1%White alone
- 1,202,4379.8%Black alone
- 394,0883.2%Hispanic
- 218,2961.8%Asian alone
- 113,0970.9%Two or more races
- 13,0860.1%Other race alone
- 14,9040.1%American Indian alone
- 2,6910.02%Native Hawaiian and Other
Pacific Islander alone

-
- 9,487,22873.1%White alone
- 1,311,58110.1%Black alone
- 1,115,9978.6%Hispanic
- 493,9423.8%Two or more races
- 487,1243.8%Asian alone
- 63,5820.5%Other race alone
- 10,1300.08%American Indian alone
- 2,4240.02%Native Hawaiian and Other
Pacific Islander alone

Income and house value in Patterson Township
- Median household income in 2022
- $74,502White non-Hispanic householders
- $68,034Black householders
- $163,763Two or more races householders
- $119,932Hispanic or Latino race householders
- Median 2022 house value
- $186,971White Non-Hispanic householders
- $62,896Black or African American householders
- $96,598Two or more races householders
- $241,496Hispanic or Latino householders
Household income for White non-Hispanic householders

Household income for Black householders

Household income for Two or more races householders

Household income for Hispanic or Latino race householders

Foreign-born residents in Patterson Township
80 residents are foreign born (1.2% Europe, 1.0% North America).
| This city: | 2.5% |
| Pennsylvania: | 4.1% |
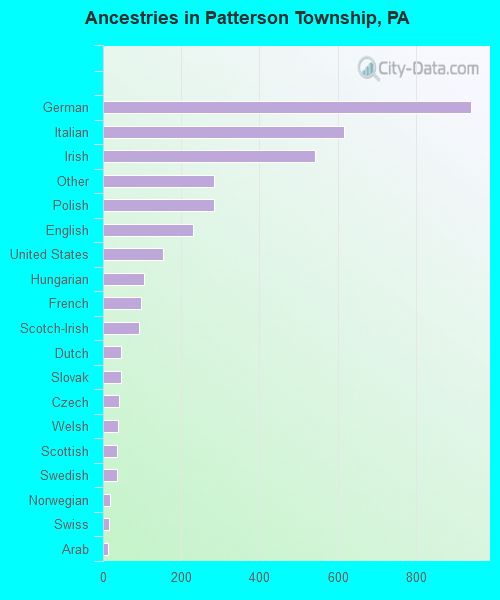
Ancestries in Patterson Township

- 94025.8%German
- 61716.9%Italian
- 54214.9%Irish
- 2857.8%Other
- 2837.8%Polish
- 2316.3%English
- 1544.2%United States
- 1062.9%Hungarian
- 982.7%French
- 912.5%Scotch-Irish
- 451.2%Dutch
- 451.2%Slovak
- 411.1%Czech
- 391.1%Welsh
- 361.0%Scottish
- 361.0%Swedish
- 170.5%Norwegian
- 150.4%Swiss
- 120.3%Arab
- 40.1%Lithuanian
- 40.1%Ukrainian
Zip codes: 15010.