Races in Pasadena, California (CA) Detailed Stats
Data:
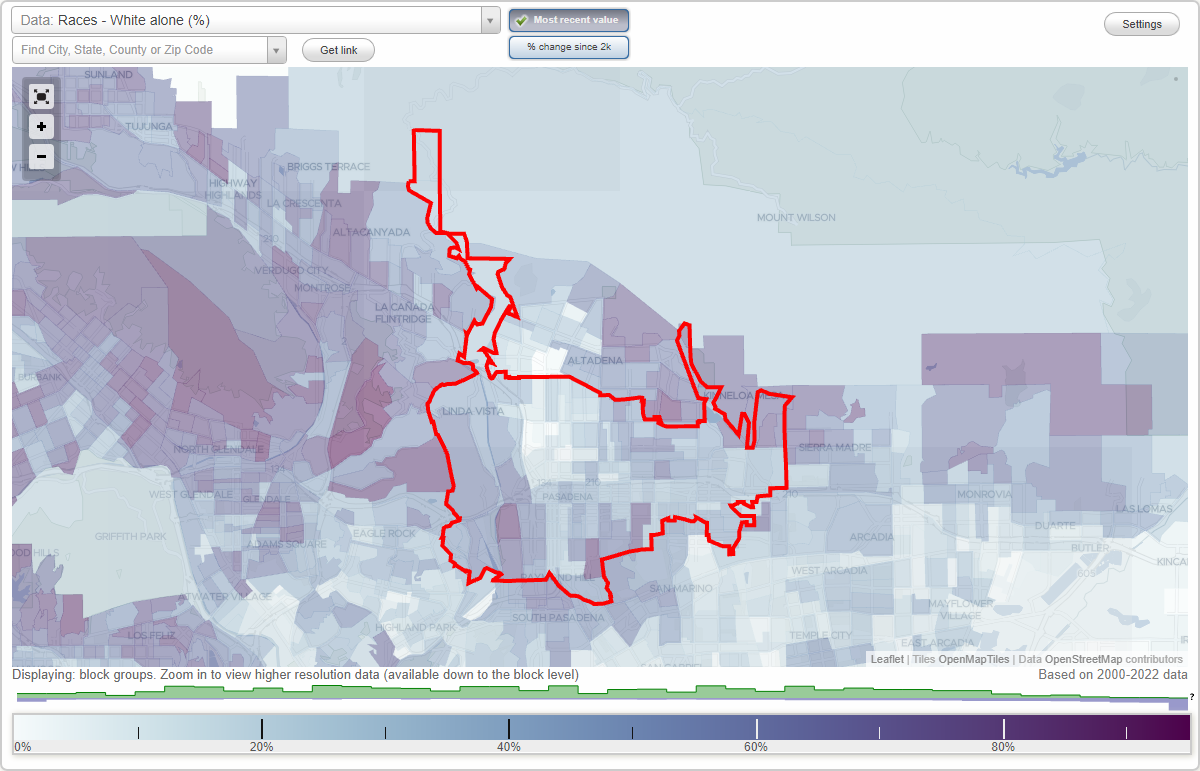
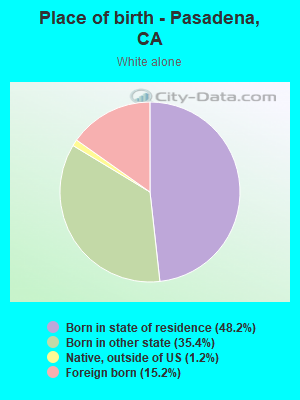
Races - White alone (%)
Races - White alone (% change since 2000)
Races - Black alone (%)
Races - Black alone (% change since 2000)
Races - American Indian alone (%)
Races - American Indian alone (% change since 2000)
Races - Asian alone (%)
Races - Asian alone (% change since 2000)
Races - Hispanic (%)
Races - Hispanic (% change since 2000)
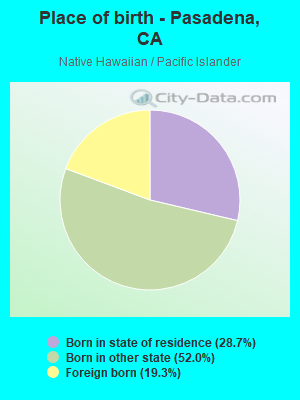
Races - Native Hawaiian and Other Pacific Islander alone (%)
Races - Native Hawaiian and Other Pacific Islander alone (% change since 2000)
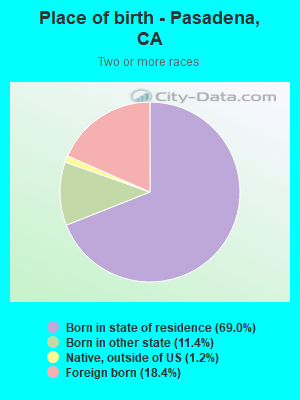
Races - Two or more races(%)
Races - Two or more races(% change since 2000)
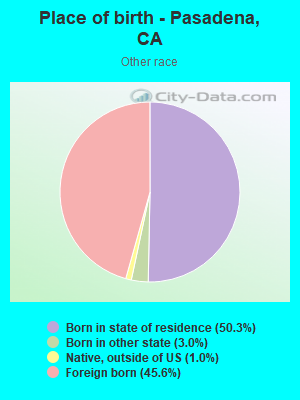
Races - Other race alone (%)
Races - Other race alone (% change since 2000)
Racial diversity
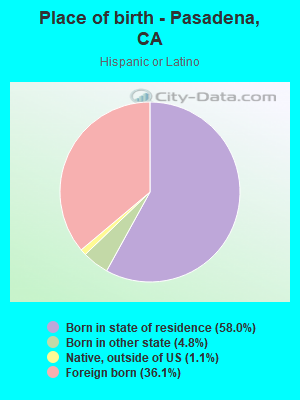
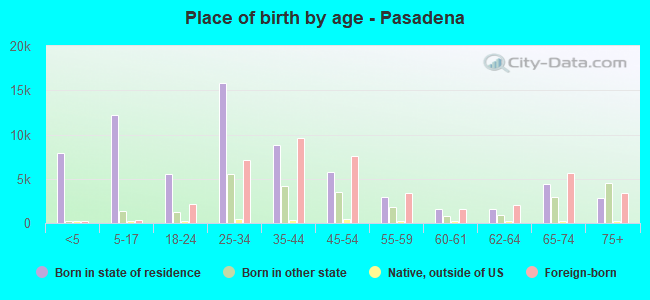
Place of birth - Born in state of residence (%)
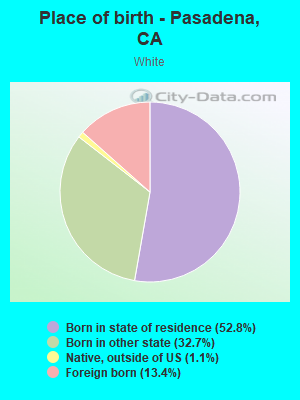
Place of birth - Born in state of residence (%) - White
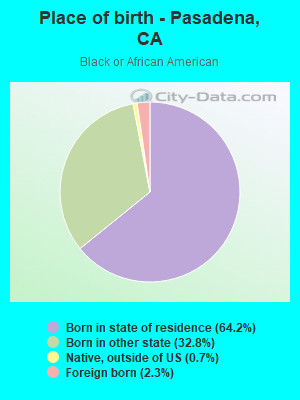
Place of birth - Born in state of residence (%) - Black or African American
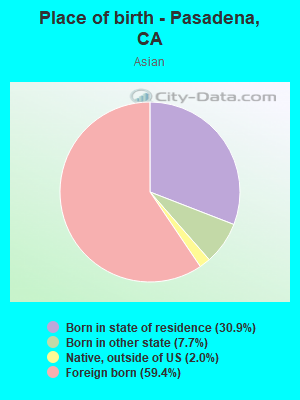
Place of birth - Born in state of residence (%) - Asian
Place of birth - Born in state of residence (%) - Hispanic or Latino
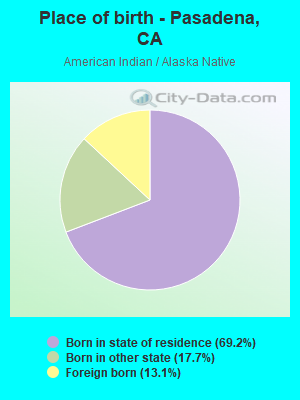
Place of birth - Born in state of residence (%) - American Indian and Alaska Native
Place of birth - Born in state of residence (%) - Multirace
Place of birth - Born in state of residence (%) - Other Race
Place of birth - Born in other state (%)
Place of birth - Born in other state (%) - White
Place of birth - Born in other state (%) - Black or African American
Place of birth - Born in other state (%) - Asian
Place of birth - Born in other state (%) - Hispanic or Latino
Place of birth - Born in other state (%) - American Indian and Alaska Native
Place of birth - Born in other state (%) - Multirace
Place of birth - Born in other state (%) - Other Race
Place of birth - Native, outside of US (%)
Place of birth - Native, outside of US (%) - White
Place of birth - Native, outside of US (%) - Black or African American
Place of birth - Native, outside of US (%) - Asian
Place of birth - Native, outside of US (%) - Hispanic or Latino
Place of birth - Native, outside of US (%) - American Indian and Alaska Native
Place of birth - Native, outside of US (%) - Multirace
Place of birth - Native, outside of US (%) - Other Race
Place of birth - Foreign born (%)
Place of birth - Foreign born (%) - White
Place of birth - Foreign born (%) - Black or African American
Place of birth - Foreign born (%) - Asian
Place of birth - Foreign born (%) - Hispanic or Latino
Place of birth - Foreign born (%) - American Indian and Alaska Native
Place of birth - Foreign born (%) - Multirace
Place of birth - Foreign born (%) - Other Race
Residents speaking English at home (%)
Residents speaking English at home - Born in the United States (%)
Residents speaking English at home - Native, born elsewhere (%)
Residents speaking English at home - Foreign born (%)
Residents speaking Spanish at home (%)
Residents speaking Spanish at home - Born in the United States (%)
Residents speaking Spanish at home - Native, born elsewhere (%)
Residents speaking Spanish at home - Foreign born (%)
Residents speaking other language at home (%)
Residents speaking other language at home - Born in the United States (%)
Residents speaking other language at home - Native, born elsewhere (%)
Residents speaking other language at home - Foreign born (%)
Marital status - Never married (%)
Marital status - Now married (%)
Marital status - Separated (%)
Marital status - Widowed (%)
Marital status - Divorced (%)
Ancestries Reported - Arab (%)
Ancestries Reported - Czech (%)
Ancestries Reported - Danish (%)
Ancestries Reported - Dutch (%)
Ancestries Reported - English (%)
Ancestries Reported - French (%)
Ancestries Reported - French Canadian (%)
Ancestries Reported - German (%)
Ancestries Reported - Greek (%)
Ancestries Reported - Hungarian (%)
Ancestries Reported - Irish (%)
Ancestries Reported - Italian (%)
Ancestries Reported - Lithuanian (%)
Ancestries Reported - Norwegian (%)
Ancestries Reported - Polish (%)
Ancestries Reported - Portuguese (%)
Ancestries Reported - Russian (%)
Ancestries Reported - Scotch-Irish (%)
Ancestries Reported - Scottish (%)
Ancestries Reported - Slovak (%)
Ancestries Reported - Subsaharan African (%)
Ancestries Reported - Swedish (%)
Ancestries Reported - Swiss (%)
Ancestries Reported - Ukrainian (%)
Ancestries Reported - United States (%)
Ancestries Reported - Welsh (%)
Ancestries Reported - West Indian (%)
Ancestries Reported - Other (%)
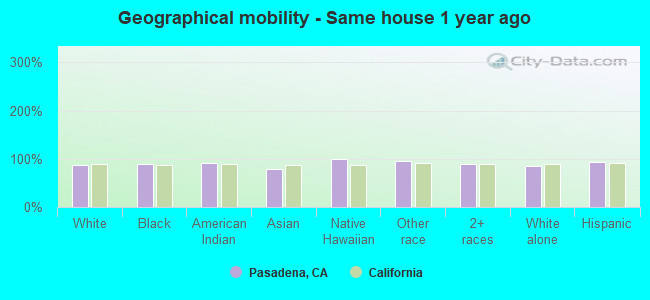
Geographical mobility - Same house 1 year ago (%)
Geographical mobility - Same house 1 year ago (%) - White
Geographical mobility - Same house 1 year ago (%) - Black or African American
Geographical mobility - Same house 1 year ago (%) - Asian
Geographical mobility - Same house 1 year ago (%) - Hispanic or Latino
Geographical mobility - Same house 1 year ago (%) - American Indian and Alaska Native
Geographical mobility - Same house 1 year ago (%) - Multirace
Geographical mobility - Same house 1 year ago (%) - Other Race
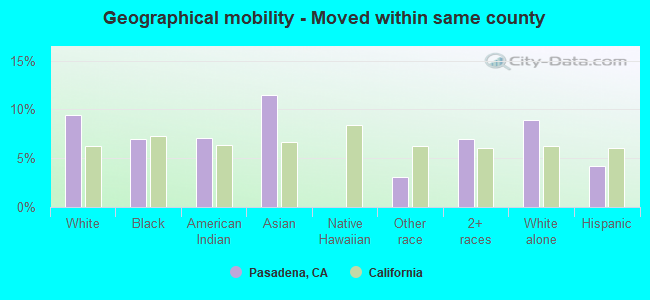
Geographical mobility - Moved within same county (%)
Geographical mobility - Moved within same county (%) - White
Geographical mobility - Moved within same county (%) - Black or African American
Geographical mobility - Moved within same county (%) - Asian
Geographical mobility - Moved within same county (%) - Hispanic or Latino
Geographical mobility - Moved within same county (%) - American Indian and Alaska Native
Geographical mobility - Moved within same county (%) - Multirace
Geographical mobility - Moved within same county (%) - Other Race
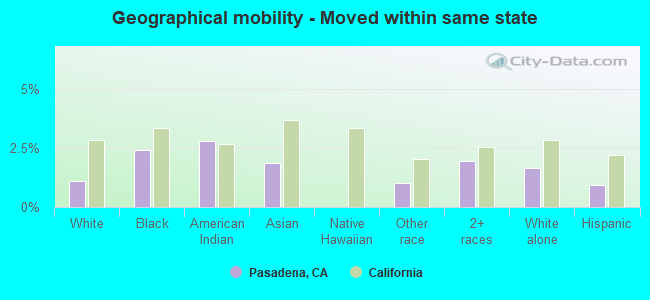
Geographical mobility - Moved from different county within same state (%)
Geographical mobility - Moved from different county within same state (%) - White
Geographical mobility - Moved from different county within same state (%) - Black or African American
Geographical mobility - Moved from different county within same state (%) - Asian
Geographical mobility - Moved from different county within same state (%) - Hispanic or Latino
Geographical mobility - Moved from different county within same state (%) - American Indian and Alaska Native
Geographical mobility - Moved from different county within same state (%) - Multirace
Geographical mobility - Moved from different county within same state (%) - Other Race
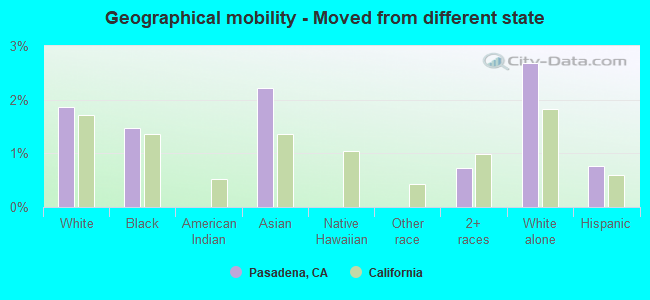
Geographical mobility - Moved from different state (%)
Geographical mobility - Moved from different state (%) - White
Geographical mobility - Moved from different state (%) - Black or African American
Geographical mobility - Moved from different state (%) - Asian
Geographical mobility - Moved from different state (%) - Hispanic or Latino
Geographical mobility - Moved from different state (%) - American Indian and Alaska Native
Geographical mobility - Moved from different state (%) - Multirace
Geographical mobility - Moved from different state (%) - Other Race
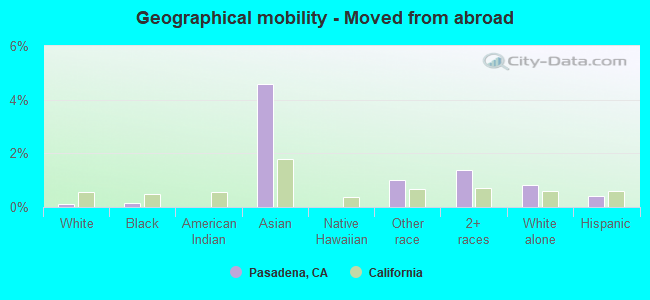
Geographical mobility - Moved from abroad (%)
Geographical mobility - Moved from abroad (%) - White
Geographical mobility - Moved from abroad (%) - Black or African American
Geographical mobility - Moved from abroad (%) - Asian
Geographical mobility - Moved from abroad (%) - Hispanic or Latino
Geographical mobility - Moved from abroad (%) - American Indian and Alaska Native
Geographical mobility - Moved from abroad (%) - Multirace
Geographical mobility - Moved from abroad (%) - Other Race
Place of birth for the foreign-born population - Ireland (%)
Place of birth for the foreign-born population - Denmark (%)
Place of birth for the foreign-born population - Norway (%)
Place of birth for the foreign-born population - Sweden (%)
Place of birth for the foreign-born population - United Kingdom (%)
Place of birth for the foreign-born population - England (%)
Place of birth for the foreign-born population - Scotland (%)
Place of birth for the foreign-born population - Other Northern Europe (%)
Place of birth for the foreign-born population - Austria (%)
Place of birth for the foreign-born population - Belgium (%)
Place of birth for the foreign-born population - France (%)
Place of birth for the foreign-born population - Germany (%)
Place of birth for the foreign-born population - Netherlands (%)
Place of birth for the foreign-born population - Switzerland (%)
Place of birth for the foreign-born population - Other Western Europe (%)
Place of birth for the foreign-born population - Greece (%)
Place of birth for the foreign-born population - Italy (%)
Place of birth for the foreign-born population - Portugal (%)
Place of birth for the foreign-born population - Spain (%)
Place of birth for the foreign-born population - Other Southern Europe (%)
Place of birth for the foreign-born population - Albania (%)
Place of birth for the foreign-born population - Belarus (%)
Place of birth for the foreign-born population - Bosnia and Herzegovina (%)
Place of birth for the foreign-born population - Bulgaria (%)
Place of birth for the foreign-born population - Croatia (%)
Place of birth for the foreign-born population - Czechoslovakia (%)
Place of birth for the foreign-born population - Hungary (%)
Place of birth for the foreign-born population - Latvia (%)
Place of birth for the foreign-born population - Lithuania (%)
Place of birth for the foreign-born population - North Macedonia (Macedonia) (%)
Place of birth for the foreign-born population - Moldova (%)
Place of birth for the foreign-born population - Poland (%)
Place of birth for the foreign-born population - Romania (%)
Place of birth for the foreign-born population - Russia (%)
Place of birth for the foreign-born population - Serbia (%)
Place of birth for the foreign-born population - Ukraine (%)
Place of birth for the foreign-born population - Other Eastern Europe (%)
Place of birth for the foreign-born population - China (%)
Place of birth for the foreign-born population - Hong Kong (%)
Place of birth for the foreign-born population - Taiwan (%)
Place of birth for the foreign-born population - Japan (%)
Place of birth for the foreign-born population - Korea (%)
Place of birth for the foreign-born population - Other Eastern Asia (%)
Place of birth for the foreign-born population - Afghanistan (%)
Place of birth for the foreign-born population - Bangladesh (%)
Place of birth for the foreign-born population - India (%)
Place of birth for the foreign-born population - Iran (%)
Place of birth for the foreign-born population - Kazakhstan (%)
Place of birth for the foreign-born population - Nepal (%)
Place of birth for the foreign-born population - Pakistan (%)
Place of birth for the foreign-born population - Sri Lanka (%)
Place of birth for the foreign-born population - Uzbekistan (%)
Place of birth for the foreign-born population - Other South Central Asia (%)
Place of birth for the foreign-born population - Burma (%)
Place of birth for the foreign-born population - Cambodia (%)
Place of birth for the foreign-born population - Indonesia (%)
Place of birth for the foreign-born population - Laos (%)
Place of birth for the foreign-born population - Malaysia (%)
Place of birth for the foreign-born population - Philippines (%)
Place of birth for the foreign-born population - Singapore (%)
Place of birth for the foreign-born population - Thailand (%)
Place of birth for the foreign-born population - Vietnam (%)
Place of birth for the foreign-born population - Other South Eastern Asia (%)
Place of birth for the foreign-born population - Armenia (%)
Place of birth for the foreign-born population - Iraq (%)
Place of birth for the foreign-born population - Israel (%)
Place of birth for the foreign-born population - Jordan (%)
Place of birth for the foreign-born population - Kuwait (%)
Place of birth for the foreign-born population - Lebanon (%)
Place of birth for the foreign-born population - Saudi Arabia (%)
Place of birth for the foreign-born population - Syria (%)
Place of birth for the foreign-born population - Turkey (%)
Place of birth for the foreign-born population - Yemen (%)
Place of birth for the foreign-born population - Other Western Asia (%)
Place of birth for the foreign-born population - Eritrea (%)
Place of birth for the foreign-born population - Ethiopia (%)
Place of birth for the foreign-born population - Kenya (%)
Place of birth for the foreign-born population - Somalia (%)
Place of birth for the foreign-born population - Uganda (%)
Place of birth for the foreign-born population - Zimbabwe (%)
Place of birth for the foreign-born population - Other Eastern Africa (%)
Place of birth for the foreign-born population - Cameroon (%)
Place of birth for the foreign-born population - Congo (%)
Place of birth for the foreign-born population - Democratic Republic of Congo (Zaire) (%)
Place of birth for the foreign-born population - Other Middle Africa (%)
Place of birth for the foreign-born population - Egypt (%)
Place of birth for the foreign-born population - Morocco (%)
Place of birth for the foreign-born population - Sudan (%)
Place of birth for the foreign-born population - Other Northern Africa (%)
Place of birth for the foreign-born population - South Africa (%)
Place of birth for the foreign-born population - Other Southern Africa (%)
Place of birth for the foreign-born population - Cabo Verde (%)
Place of birth for the foreign-born population - Ghana (%)
Place of birth for the foreign-born population - Liberia (%)
Place of birth for the foreign-born population - Nigeria (%)
Place of birth for the foreign-born population - Senegal (%)
Place of birth for the foreign-born population - Sierra Leone (%)
Place of birth for the foreign-born population - Other Western Africa (%)
Place of birth for the foreign-born population - Australia (%)
Place of birth for the foreign-born population - New Zealand (%)
Place of birth for the foreign-born population - Fiji (%)
Place of birth for the foreign-born population - Micronesia (%)
Place of birth for the foreign-born population - Bahamas (%)
Place of birth for the foreign-born population - Barbados (%)
Place of birth for the foreign-born population - Cuba (%)
Place of birth for the foreign-born population - Dominica (%)
Place of birth for the foreign-born population - Dominican Republic (%)
Place of birth for the foreign-born population - Grenada (%)
Place of birth for the foreign-born population - Haiti (%)
Place of birth for the foreign-born population - Jamaica (%)
Place of birth for the foreign-born population - St. Vincent and the Grenadines (%)
Place of birth for the foreign-born population - Trinidad and Tobago (%)
Place of birth for the foreign-born population - West Indies (%)
Place of birth for the foreign-born population - Other Caribbean (%)
Place of birth for the foreign-born population - Belize (%)
Place of birth for the foreign-born population - Costa Rica (%)
Place of birth for the foreign-born population - El Salvador (%)
Place of birth for the foreign-born population - Guatemala (%)
Place of birth for the foreign-born population - Honduras (%)
Place of birth for the foreign-born population - Mexico (%)
Place of birth for the foreign-born population - Nicaragua (%)
Place of birth for the foreign-born population - Panama (%)
Place of birth for the foreign-born population - Other Central America (%)
Place of birth for the foreign-born population - Argentina (%)
Place of birth for the foreign-born population - Bolivia (%)
Place of birth for the foreign-born population - Brazil (%)
Place of birth for the foreign-born population - Chile (%)
Place of birth for the foreign-born population - Colombia (%)
Place of birth for the foreign-born population - Ecuador (%)
Place of birth for the foreign-born population - Guyana (%)
Place of birth for the foreign-born population - Peru (%)
Place of birth for the foreign-born population - Uruguay (%)
Place of birth for the foreign-born population - Venezuela (%)
Place of birth for the foreign-born population - Other South America (%)
Place of birth for the foreign-born population - Canada (%)
Place of birth for the foreign-born population - Other Northern America (%)
Place of birth for the foreign-born population - Other (%)
Latest news about races in Pasadena, CA collected exclusively by city-data.com from local newspapers, TV, and radio stations
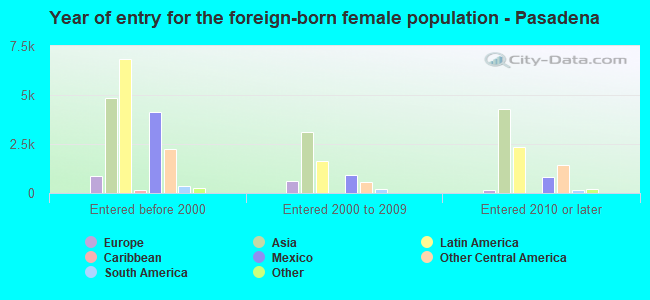
According to 2022 data, the most numerous races in Pasadena, CA are Hispanic (49,232 residents), White alone (50,698 residents), and Asian alone (25,525 residents). 55.4% of Pasadena residents speak English at home. 30.5% of Pasadena, CA residents are foreign-born (13.6% born in Latin America, 13.0% born in Asia), which is 14.7% greater than the foreign-born rate of 26.0% across the entire state of California.
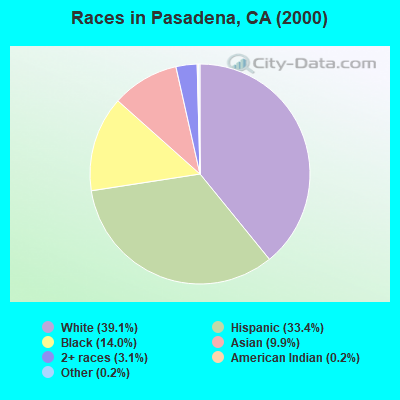
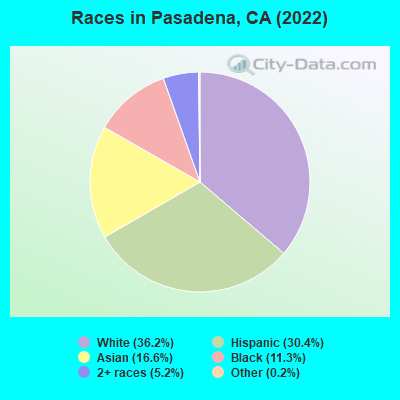
Race distribution in Pasadena
2000 2022
52,381 39.1% White alone 44,734 33.4% Hispanic 18,711 14.0% Black alone 13,253 9.9% Asian alone 4,127 3.1% Two or more races 302 0.2% Other race alone 324 0.2% American Indian alone 104 0.08% Native Hawaiian and Other
50,698 35.9% White alone 49,232 34.8% Hispanic 25,525 18.1% Asian alone 7,794 5.5% Black alone 7,537 5.3% Two or more races 749 0.5% Other race alone 248 0.2% American Indian alone 66 0.05% Native Hawaiian and Other
2000 2022
15,816,790 46.7% White alone 10,966,556 32.4% Hispanic 3,648,860 10.8% Asian alone 2,181,926 6.4% Black alone 903,115 2.7% Two or more races 178,984 0.5% American Indian alone 103,736 0.3% Native Hawaiian and Other 71,681 0.2% Other race alone
15,732,184 40.3% Hispanic 13,160,426 33.7% White alone 5,957,867 15.3% Asian alone 2,025,218 5.2% Black alone 1,663,222 4.3% Two or more races 251,618 0.6% Other race alone 135,777 0.3% Native Hawaiian and Other 103,030 0.3% American Indian alone
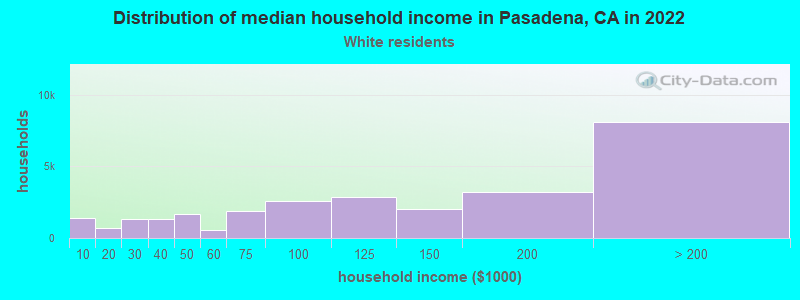
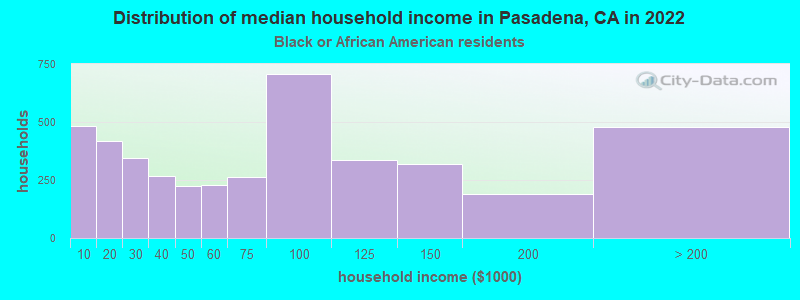
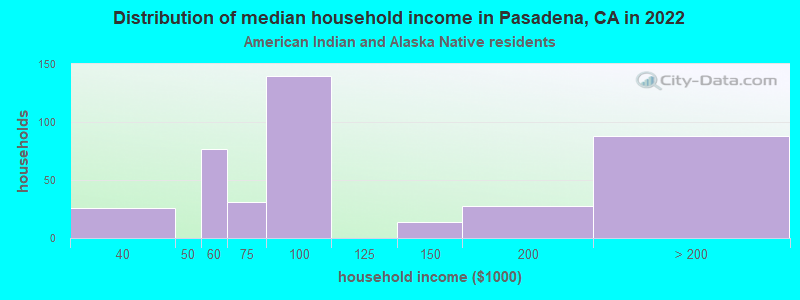
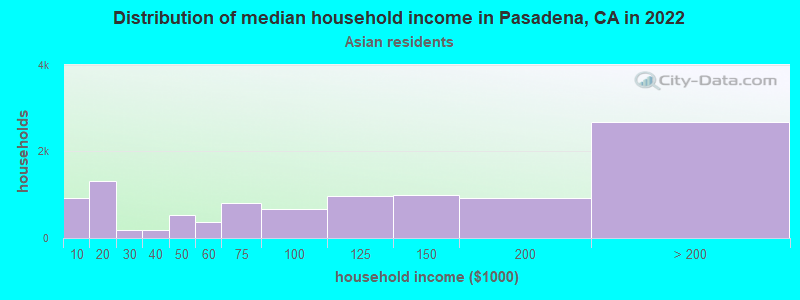
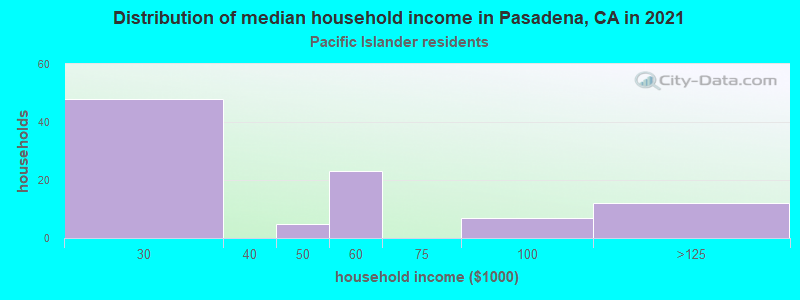
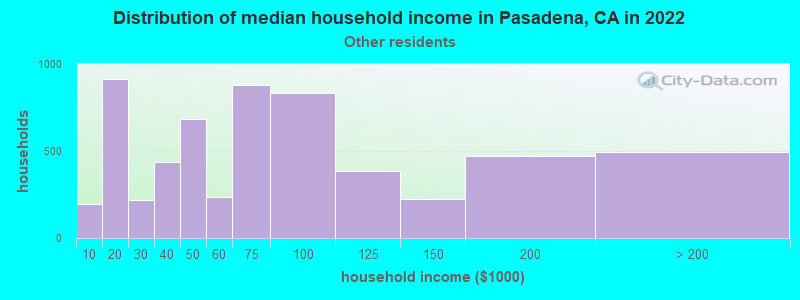
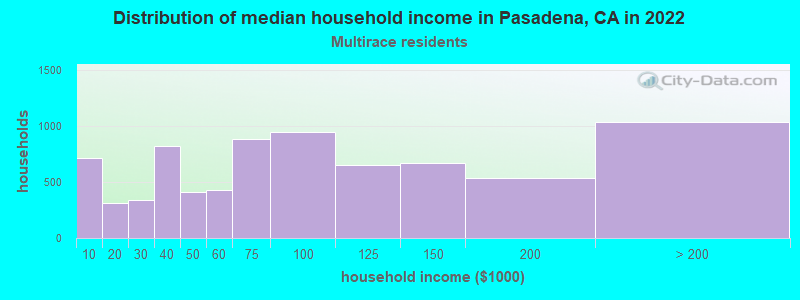
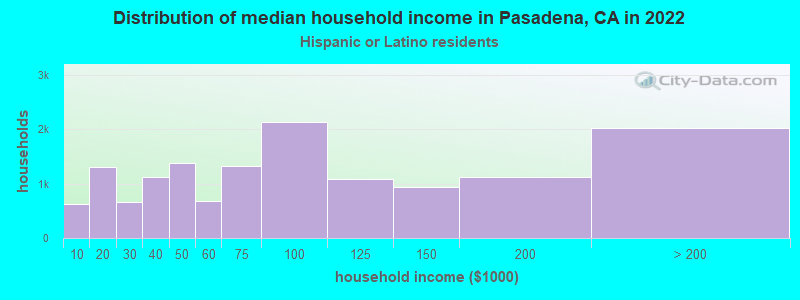
Income and house value in Pasadena Median household income in 2022 $127,017 White non-Hispanic householders$61,898 Black householdersover $200,000 American Indian and Alaska Native householders$136,155 Asian householders$152,110 Native Hawaiian and other Pacific Islander householders$78,741 Some other race householders$112,110 Two or more races householders$81,960 Hispanic or Latino race householdersMedian 2022 house value over $1,000,000 White Non-Hispanic householders$719,139 Black or African American householders$601,802 American Indian or Alaska Native householders $996,285 Asian householders$674,868 Native Hawaiian and other Pacific Islander householders$638,155 Some other race householders$883,987 Two or more races householders$709,781 Hispanic or Latino householders
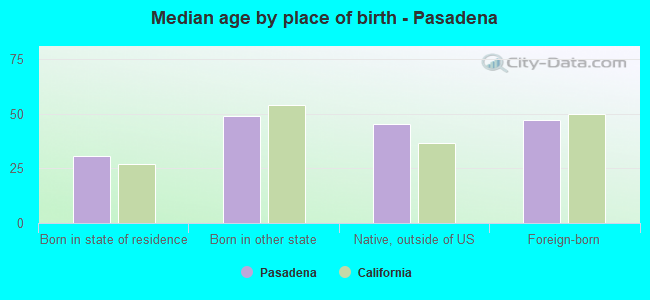
Median age by race in Pasadena
44.1 Median age for White residents43.8 44.8 47.8 Median age for Black or African American residents34.2 58.6 32.7 Median age for American Indian / Alaska Native residents32.2 32.8 37.8 Median age for Asian residents35.6 39.4 42.6 Median age for Native Hawaiian / Pacific Islander residents36.0 46.9 37.0 Median age for Other race residents35.4 37.8 35.2 Median age for Two or more races residents28.7 42.5 46.6 Median age for White alone residents43.4 49.7 35.1 Median age for Hispanic or Latino residents34.3 35.6
Owner/renter occupied households by race in Pasadena
House owners and renters - White residents 12,102 43.5% Owner occupied15,705 56.5% Renter occupiedHouse owners and renters - Black or African American residents 1,026 36.2% Owner occupied1,806 63.8% Renter occupiedHouse owners and renters - American Indian / Alaska Native residents 143 60.5% Owner occupied94 39.5% Renter occupiedHouse owners and renters - Asian residents 5,069 44.9% Owner occupied6,225 55.1% Renter occupiedHouse owners and renters - Native Hawaiian / Pacific Islander residents 50 35.4% Owner occupied91 64.6% Renter occupiedHouse owners and renters - Other race residents 2,012 21.8% Owner occupied7,226 78.2% Renter occupiedHouse owners and renters - Two or more races residents 2,465 28.3% Owner occupied6,232 71.7% Renter occupiedHouse owners and renters - White alone residents 11,386 44.2% Owner occupied14,397 55.8% Renter occupiedHouse owners and renters - Hispanic or Latino residents 3,957 27.1% Owner occupied10,660 72.9% Renter occupied
Language usage in Pasadena
English speakers - Total 55.4% of residents of Pasadena speak English at home.
26.9% of residents speak Spanish at home 22,420 62.8% Speak English very well13,275 37.2% Speak English less than very well17.8% of residents speak other language at home 15,328 64.7% Speak English very well8,367 35.3% Speak English less than very well
English speakers - Born in the United States 89.4% of residents of Pasadena speak English at home.
5.6% of residents speak Spanish at home 1,295 87.4% Speak English very well187 12.6% Speak English less than very well5.0% of residents speak other language at home 1,241 94.2% Speak English very well76 5.8% Speak English less than very well
English speakers - Native, born elsewhere 60.8% of residents of Pasadena speak English at home.
14.5% of residents speak Spanish at home 217 93.9% Speak English very well14 6.1% Speak English less than very well24.2% of residents speak other language at home 216 56.1% Speak English very well169 43.9% Speak English less than very well
English speakers - Foreign-born 16.3% of residents of Pasadena speak English at home.
41.1% of residents speak Spanish at home 5,569 32.4% Speak English very well11,596 67.6% Speak English less than very well43.3% of residents speak other language at home 10,260 56.7% Speak English very well7,825 43.3% Speak English less than very well
White (Caucasian) - Speak only English Native:
88.7% (41,387)Foreign-born:
39.1% (2,975)
White (Caucasian) - Speak another language Native:
12.5% (5,829)Foreign-born:
67.2% (5,112)
Black or African American - Speak only English Native:
95.5% (9,810)Foreign-born:
52.2% (622)
Black or African American - Speak another language Native:
4.3% (444)Foreign-born:
43.6% (519)
American Indian / Alaska Native - Speak only English Native:
59.5% (305)Foreign-born:
20.7% (16)
American Indian / Alaska Native - Speak another language Native:
44.6% (228)Foreign-born:
80.7% (63)
Asian - Speak only English Native:
62.9% (5,625)Foreign-born:
16.0% (2,474)
Asian - Speak another language Native:
37.4% (3,347)Foreign-born:
84.5% (13,057)
Native Hawaiian / Pacific Islander - Speak only English Native:
42.1% (86)Foreign-born:
23.2% (16)
Native Hawaiian / Pacific Islander - Speak another language Native:
48.1% (98)Foreign-born:
78.4% (52)
Other race - Speak only English Native:
23.5% (3,426)Foreign-born:
4.3% (750)
Other race - Speak another language Native:
75.4% (11,006)Foreign-born:
95.3% (16,679)
Two or more races - Speak only English Native:
66.9% (9,832)Foreign-born:
2.7% (148)
Two or more races - Speak another language Native:
27.7% (4,074)Foreign-born:
100.0% (5,422)
White alone - Speak only English Native:
94.4% (39,752)Foreign-born:
41.6% (2,857)
White alone - Speak another language Native:
5.7% (2,382)Foreign-born:
58.2% (3,996)
Hispanic or Latino - Speak only English Native:
31.2% (7,913)Foreign-born:
5.8% (1,126)
Hispanic or Latino - Speak another language Native:
67.9% (17,211)Foreign-born:
94.3% (18,423)
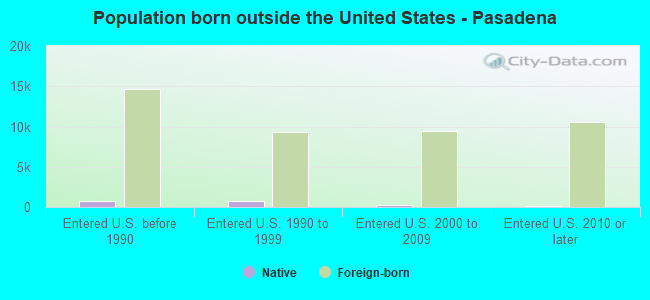
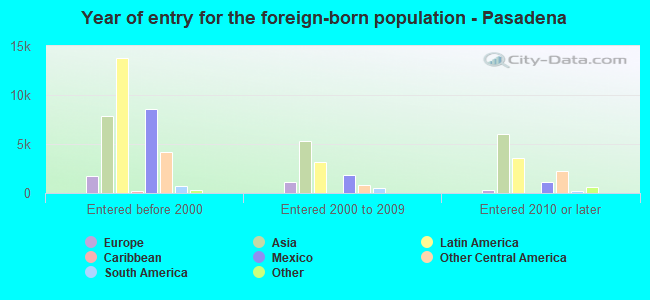
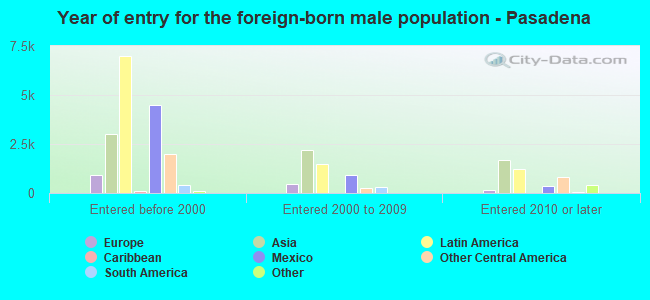
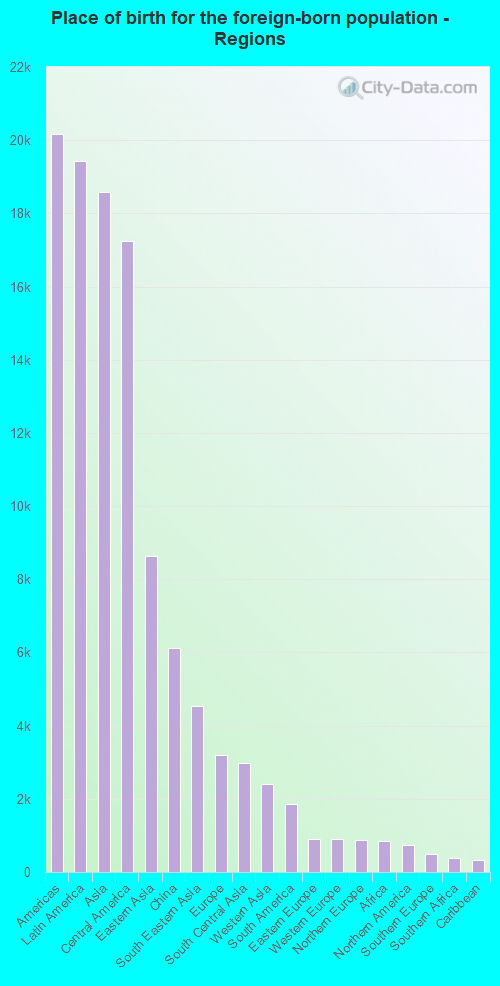
Foreign-born residents in Pasadena 42,946 residents are foreign born (13.6% Latin America , 13.0% Asia ).
This city:
30.5%California:
100.0%
Marital status for residents in Pasadena Marital status - White (Caucasian) population 15 years and over
Males 37.0% Never married50.1% Now married2.3% Separated2.4% Widowed8.3% DivorcedFemales 32.8% Never married45.5% Now married1.3% Separated8.6% Widowed11.9% DivorcedWomen who gave birth in the past 12 months Now married:
99.9% (611)Unmarried:
0.1% (1)
Women who did not give birth in the past 12 months Now married:
41.5% (4,829)Unmarried:
58.5% (6,820)
Marital status - Black or African American population 15 years and over
Males 65.1% Never married30.4% Now married3.2% Separated1.3% Widowed0.0% DivorcedFemales 36.0% Never married19.6% Now married0.0% Separated22.6% Widowed21.8% DivorcedWomen who gave birth in the past 12 months Now married:
87.3% (89)Unmarried:
12.7% (13)
Women who did not give birth in the past 12 months Now married:
18.2% (501)Unmarried:
81.8% (2,248)
Marital status - American Indian / Alaska Native population 15 years and over
Males 45.1% Never married49.0% Now married0.0% Separated0.0% Widowed5.9% DivorcedFemales 53.7% Never married24.7% Now married0.0% Separated6.2% Widowed15.4% DivorcedWomen who gave birth in the past 12 months Now married:
100.0% (22)Unmarried:
0.0% (0)
Women who did not give birth in the past 12 months Now married:
17.6% (39)Unmarried:
82.4% (184)
Marital status - Asian population 15 years and over
Males 38.6% Never married53.2% Now married0.9% Separated4.2% Widowed3.0% DivorcedFemales 30.5% Never married58.3% Now married1.3% Separated3.6% Widowed6.3% DivorcedWomen who gave birth in the past 12 months Now married:
100.0% (246)Unmarried:
0.0% (0)
Women who did not give birth in the past 12 months Now married:
54.5% (4,831)Unmarried:
45.5% (4,030)
Marital status - Native Hawaiian / Pacific Islander population 15 years and over
Males 37.7% Never married62.3% Now married0.0% Separated0.0% Widowed0.0% DivorcedFemales 53.0% Never married28.8% Now married0.0% Separated13.7% Widowed4.6% DivorcedWomen who did not give birth in the past 12 months Now married:
17.6% (28)Unmarried:
82.4% (131)
Marital status - Other race population 15 years and over
Males 46.5% Never married50.7% Now married0.4% Separated0.0% Widowed2.4% DivorcedFemales 47.8% Never married36.5% Now married3.3% Separated6.3% Widowed6.1% DivorcedWomen who gave birth in the past 12 months Now married:
100.0% (215)Unmarried:
0.0% (0)
Women who did not give birth in the past 12 months Now married:
34.5% (3,331)Unmarried:
65.5% (6,333)
Marital status - Two or more races population 15 years and over
Males 51.5% Never married44.9% Now married0.0% Separated0.0% Widowed3.6% DivorcedFemales 37.6% Never married36.7% Now married0.0% Separated5.1% Widowed20.7% DivorcedWomen who gave birth in the past 12 months Now married:
100.0% (79)Unmarried:
0.0% (0)
Women who did not give birth in the past 12 months Now married:
26.8% (1,468)Unmarried:
73.2% (4,000)
Marital status - White alone, not Hispanic / Latino population 15 years and over
Males 36.5% Never married50.8% Now married1.7% Separated2.7% Widowed8.4% DivorcedFemales 28.7% Never married47.5% Now married1.2% Separated9.7% Widowed12.9% DivorcedWomen who gave birth in the past 12 months Now married:
100.0% (538)Unmarried:
0.0% (0)
Women who did not give birth in the past 12 months Now married:
45.8% (4,390)Unmarried:
54.2% (5,186)
Marital status - Hispanic or Latino population 15 years and over
Males 43.6% Never married49.7% Now married1.8% Separated0.4% Widowed4.5% DivorcedFemales 46.8% Never married37.5% Now married2.7% Separated6.2% Widowed6.9% DivorcedWomen who gave birth in the past 12 months Now married:
99.7% (397)Unmarried:
0.3% (1)
Women who did not give birth in the past 12 months Now married:
34.7% (4,779)Unmarried:
65.3% (8,974)
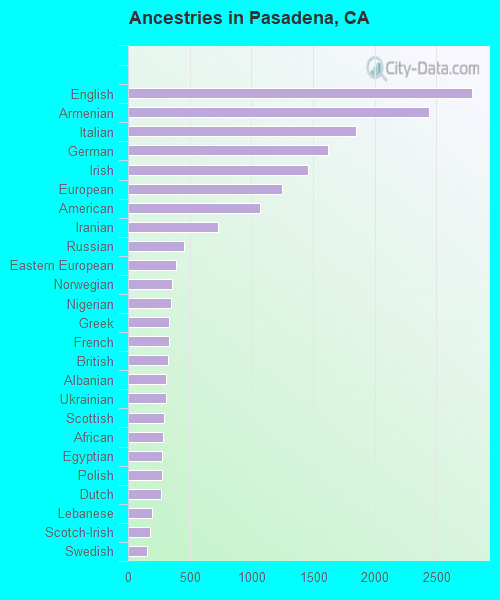
Ancestries in Pasadena
3,236 3.7% Armenian2,919 3.3% English1,793 2.0% Irish1,700 1.9% European1,426 1.6% German1,342 1.5% Italian1,173 1.3% American735 0.8% Iranian604 0.7% British460 0.5% African443 0.5% Russian423 0.5% Polish412 0.5% Eastern European409 0.5% French369 0.4% Northern European364 0.4% Greek277 0.3% Scottish265 0.3% Egyptian237 0.3% Dutch225 0.3% Nigerian218 0.2% Albanian209 0.2% Norwegian196 0.2% Swedish194 0.2% Brazilian185 0.2% Scotch-Irish182 0.2% Scandinavian136 0.2% Israeli126 0.1% Canadian126 0.1% Jamaican116 0.1% Syrian113 0.1% South African112 0.1% Hungarian112 0.1% Ethiopian101 0.1% Arab99 0.1% Portuguese99 0.1% Swiss96 0.1% Welsh95 0.1% Lithuanian95 0.1% French Canadian93 0.1% Lebanese82 0.09% Ukrainian82 0.09% Danish71 0.08% Belizean70 0.08% Romanian63 0.07% Croatian57 0.06% Australian46 0.05% Czech43 0.05% Austrian43 0.05% Turkish42 0.05% Yugoslavian37 0.04% Jordanian34 0.04% Slovak33 0.04% Ugandan33 0.04% Icelander28 0.03% Serbian25 0.03% Finnish25 0.03% Guyanese25 0.03% Barbadian21 0.02% Slovene20 0.02% Kenyan18 0.02% West Indian16 0.02% Basque15 0.02% Slavic15 0.02% Bermudan9 0.01% German Russian6 0.01% Maltese5 0.01% Haitian5 0.01% Pennsylvania German
Geographical mobility in Pasadena Same house 1 year ago 48,627 87.2% White (Caucasian)10,531 89.4% Black or African American593 90.9% American Indian / Alaska Native19,967 78.3% Asian305 100.0% Native Hawaiian / Pacific Islander33,301 95.8% Other race16,561 88.8% Two or more races40,688 85.5% White alone, not Hispanic / Latino46,553 94.2% Hispanic or LatinoMoved within same county 5,269 9.4% White / Caucasian817 6.9% Black or African American46 7.1% American Indian / Alaska Native2,922 11.5% Asian1,056 3.0% Other race1,297 7.0% Two or more races4,223 8.9% White alone, not Hispanic / Latino2,101 4.2% Hispanic or LatinoMoved within same state 619 1.1% White / Caucasian286 2.4% Black or African American18 2.8% American Indian / Alaska Native470 1.8% Asian351 1.0% Other race359 1.9% Two or more races789 1.7% White alone, not Hispanic / Latino457 0.9% Hispanic or LatinoMoved from different state 1,039 1.9% White / Caucasian174 1.5% Black or African American565 2.2% Asian136 0.7% Two or more races1,279 2.7% White alone, not Hispanic / Latino376 0.8% Hispanic or LatinoMoved from abroad 68 0.1% White16 0.1% Black or African American1,169 4.6% Asian348 1.0% Other race260 1.4% Two or more races392 0.8% White alone, not Hispanic / Latino197 0.4% Hispanic or Latino
Children Nativity (place of birth) in Pasadena
Children under 6 years - Living with two parents Both parents native 4,090 100.0% NativeBoth parents foreign-born 1,540 95.3% Native75 4.7% Foreign-bornOne native, one foreign-born parent 1,093 100.0% NativeChildren under 6 years - Living with one parent Native parent 1,179 100.0% NativeForeign-born parent 525 100.0% NativeChildren 6 to 17 years - Living with two parents Both parents native 4,308 100.0% NativeBoth parents foreign-born 2,854 100.0% NativeOne native, one foreign-born parent 1,120 100.0% NativeChildren 6 to 17 years - Living with one parent Native parent 2,768 100.0% NativeForeign-born parent 1,088 50.0% Native1,087 50.0% Foreign-born
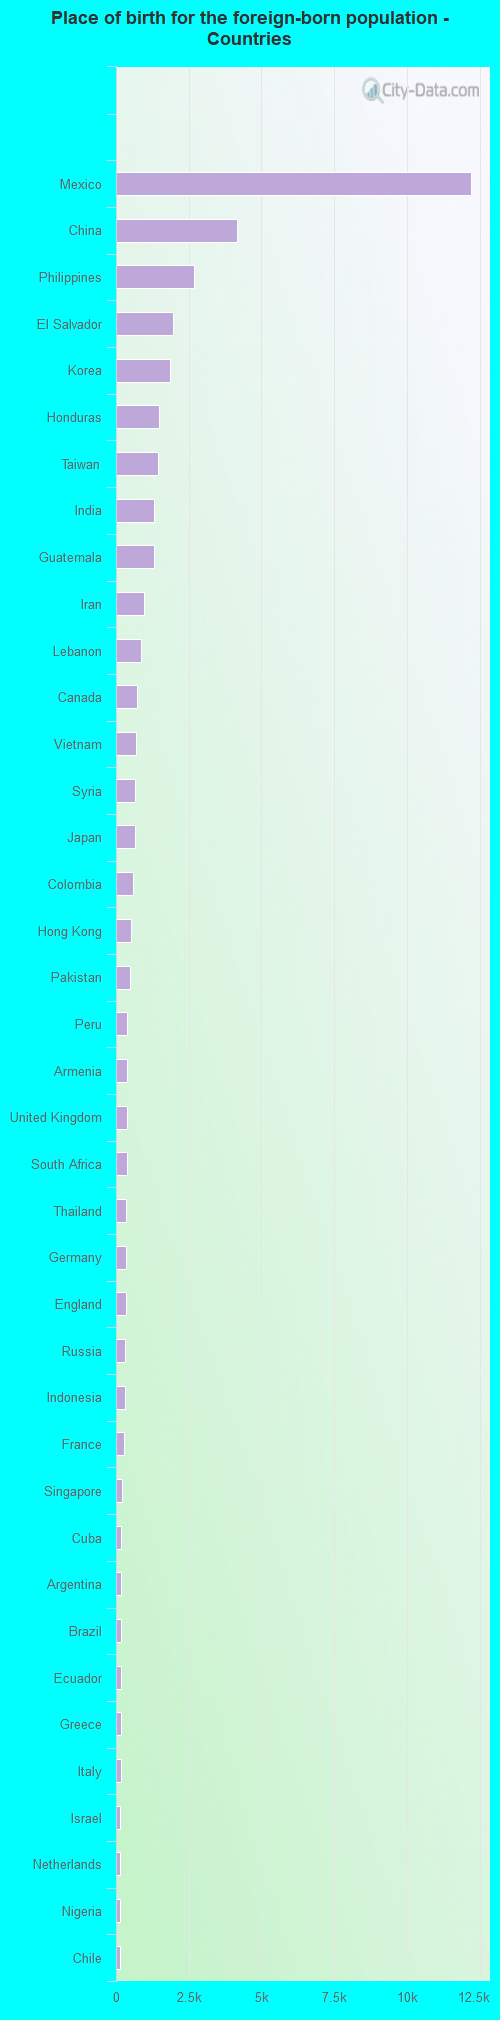
Place of birth for residents in Pasadena 20,157 Americas19,427 Latin America18,573 Asia17,250 Central America8,630 Eastern Asia6,128 China4,528 South Eastern Asia3,197 Europe2,976 South Central Asia2,411 Western Asia1,851 South America913 Eastern Europe896 Western Europe885 Northern Europe860 Africa729 Northern America502 Southern Europe383 Southern Africa326 Caribbean178 Eastern Africa156 Oceania154 Western Africa133 Northern Africa93 Australia and New Zealand Subregion12,215 Mexico4,170 China2,691 Philippines1,963 El Salvador1,860 Korea1,493 Honduras1,442 Taiwan1,313 India1,302 Guatemala962 Iran854 Lebanon705 Canada698 Vietnam651 Syria641 Japan568 Colombia515 Hong Kong465 Pakistan387 Peru382 Armenia376 United Kingdom372 South Africa354 Thailand348 Germany346 England297 Russia293 Indonesia282 France215 Singapore189 Cuba189 Argentina187 Brazil174 Ecuador170 Greece168 Italy152 Israel150 Netherlands141 Nigeria125 Chile109 Romania109 Spain107 Poland102 Iraq101 Burma98 Egypt96 Jamaica94 Turkey88 Belize85 Venezuela84 Sri Lanka84 Switzerland80 Ethiopia79 Kuwait77 Australia76 Laos73 Costa Rica72 Hungary68 Ireland65 Uzbekistan63 Nicaragua62 Albania61 Uganda55 Lithuania54 Portugal53 Cambodia48 Panama46 Bangladesh45 Bolivia42 Malaysia41 Belarus36 Scotland36 Ukraine35 Kazakhstan30 Austria28 Czechoslovakia27 Croatia25 Kenya23 Jordan21 Guyana20 Trinidad and Tobago20 Barbados17 Norway15 New Zealand13 Ghana11 Zimbabwe10 Uruguay9 Sudan9 Moldova8 Latvia7 Morocco7 Denmark7 Sweden5 Serbia4 Micronesia3 Afghanistan
Grandparents responsible for own grandchildren in Pasadena
Grandparents (30 to 59 years) White / Caucasian 9 5.5% Responsible for grandchildren153 94.5% Not responsible for grandchildrenBlack or African American 8 8.0% Responsible for grandchildren88 92.0% Not responsible for grandchildrenAsian 51 84.3% Responsible for grandchildren10 15.7% Not responsible for grandchildrenOther race 53 7.7% Responsible for grandchildren631 92.3% Not responsible for grandchildrenTwo or more races 10 8.8% Responsible for grandchildren107 91.2% Not responsible for grandchildrenWhite alone, not Hispanic / Latino 7 19.8% Responsible for grandchildren28 80.2% Not responsible for grandchildrenHispanic or Latino 57 6.7% Responsible for grandchildren792 93.3% Not responsible for grandchildrenGrandparents (60 years and over) White / Caucasian 42 10.2% Responsible for grandchildren373 89.8% Not responsible for grandchildrenBlack or African American 13 8.0% Responsible for grandchildren150 92.0% Not responsible for grandchildrenAsian 29 17.8% Responsible for grandchildren133 82.2% Not responsible for grandchildrenOther race 39 9.1% Responsible for grandchildren389 90.9% Not responsible for grandchildrenTwo or more races 117 43.8% Responsible for grandchildren150 56.2% Not responsible for grandchildrenWhite alone, not Hispanic / Latino 41 13.0% Responsible for grandchildren273 87.0% Not responsible for grandchildrenHispanic or Latino 60 9.4% Responsible for grandchildren581 90.6% Not responsible for grandchildren