Races in Parkland, Florida (FL) Detailed Stats
Data:
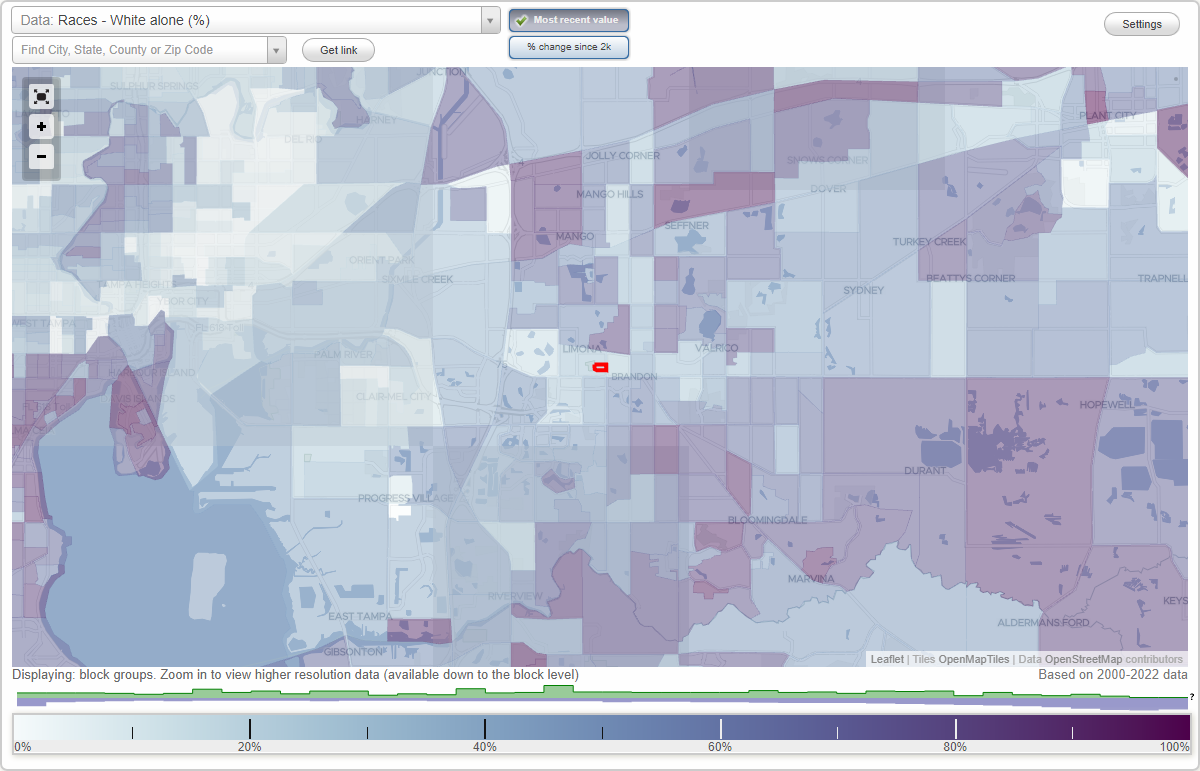
Races - White alone (%)
Races - White alone (% change since 2000)
Races - Black alone (%)
Races - Black alone (% change since 2000)
Races - American Indian alone (%)
Races - American Indian alone (% change since 2000)
Races - Asian alone (%)
Races - Asian alone (% change since 2000)
Races - Hispanic (%)
Races - Hispanic (% change since 2000)
Races - Native Hawaiian and Other Pacific Islander alone (%)
Races - Native Hawaiian and Other Pacific Islander alone (% change since 2000)
Races - Two or more races(%)
Races - Two or more races(% change since 2000)
Races - Other race alone (%)
Races - Other race alone (% change since 2000)
Racial diversity
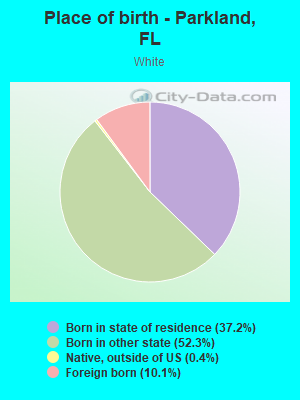
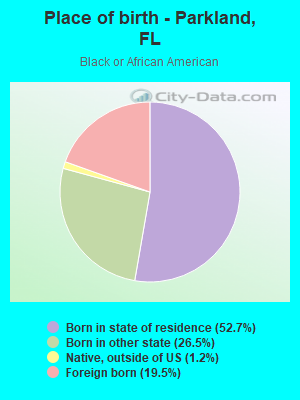
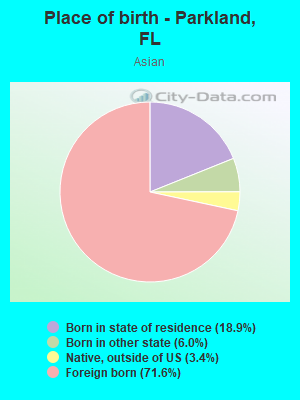
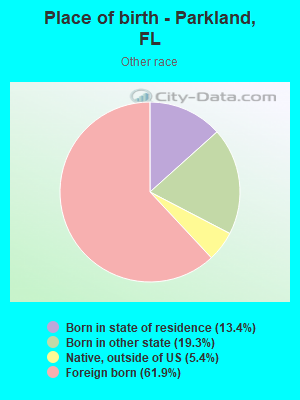
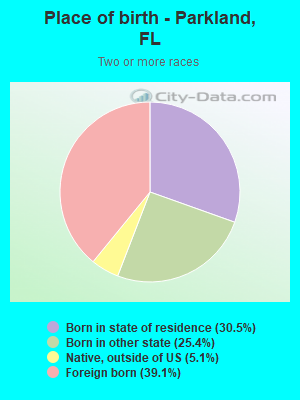
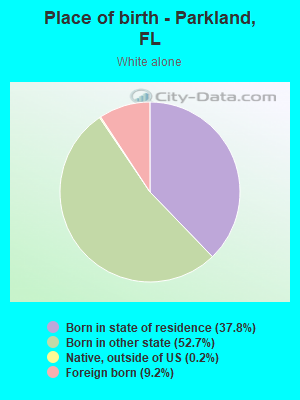
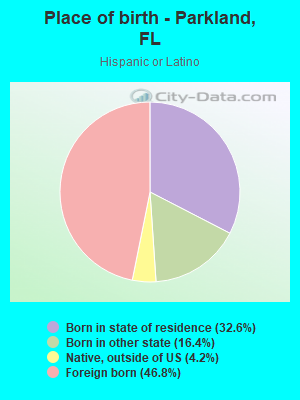
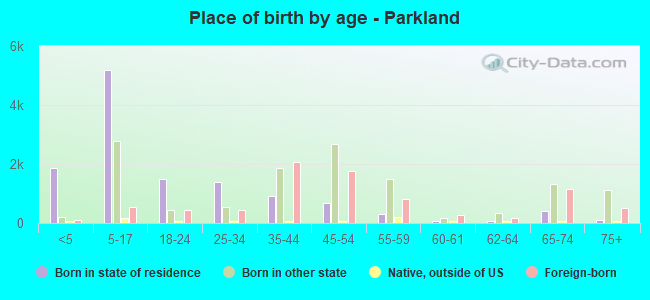
Place of birth - Born in state of residence (%)
Place of birth - Born in state of residence (%) - White
Place of birth - Born in state of residence (%) - Black or African American
Place of birth - Born in state of residence (%) - Asian
Place of birth - Born in state of residence (%) - Hispanic or Latino
Place of birth - Born in state of residence (%) - American Indian and Alaska Native
Place of birth - Born in state of residence (%) - Multirace
Place of birth - Born in state of residence (%) - Other Race
Place of birth - Born in other state (%)
Place of birth - Born in other state (%) - White
Place of birth - Born in other state (%) - Black or African American
Place of birth - Born in other state (%) - Asian
Place of birth - Born in other state (%) - Hispanic or Latino
Place of birth - Born in other state (%) - American Indian and Alaska Native
Place of birth - Born in other state (%) - Multirace
Place of birth - Born in other state (%) - Other Race
Place of birth - Native, outside of US (%)
Place of birth - Native, outside of US (%) - White
Place of birth - Native, outside of US (%) - Black or African American
Place of birth - Native, outside of US (%) - Asian
Place of birth - Native, outside of US (%) - Hispanic or Latino
Place of birth - Native, outside of US (%) - American Indian and Alaska Native
Place of birth - Native, outside of US (%) - Multirace
Place of birth - Native, outside of US (%) - Other Race
Place of birth - Foreign born (%)
Place of birth - Foreign born (%) - White
Place of birth - Foreign born (%) - Black or African American
Place of birth - Foreign born (%) - Asian
Place of birth - Foreign born (%) - Hispanic or Latino
Place of birth - Foreign born (%) - American Indian and Alaska Native
Place of birth - Foreign born (%) - Multirace
Place of birth - Foreign born (%) - Other Race
Residents speaking English at home (%)
Residents speaking English at home - Born in the United States (%)
Residents speaking English at home - Native, born elsewhere (%)
Residents speaking English at home - Foreign born (%)
Residents speaking Spanish at home (%)
Residents speaking Spanish at home - Born in the United States (%)
Residents speaking Spanish at home - Native, born elsewhere (%)
Residents speaking Spanish at home - Foreign born (%)
Residents speaking other language at home (%)
Residents speaking other language at home - Born in the United States (%)
Residents speaking other language at home - Native, born elsewhere (%)
Residents speaking other language at home - Foreign born (%)
Marital status - Never married (%)
Marital status - Now married (%)
Marital status - Separated (%)
Marital status - Widowed (%)
Marital status - Divorced (%)
Ancestries Reported - Arab (%)
Ancestries Reported - Czech (%)
Ancestries Reported - Danish (%)
Ancestries Reported - Dutch (%)
Ancestries Reported - English (%)
Ancestries Reported - French (%)
Ancestries Reported - French Canadian (%)
Ancestries Reported - German (%)
Ancestries Reported - Greek (%)
Ancestries Reported - Hungarian (%)
Ancestries Reported - Irish (%)
Ancestries Reported - Italian (%)
Ancestries Reported - Lithuanian (%)
Ancestries Reported - Norwegian (%)
Ancestries Reported - Polish (%)
Ancestries Reported - Portuguese (%)
Ancestries Reported - Russian (%)
Ancestries Reported - Scotch-Irish (%)
Ancestries Reported - Scottish (%)
Ancestries Reported - Slovak (%)
Ancestries Reported - Subsaharan African (%)
Ancestries Reported - Swedish (%)
Ancestries Reported - Swiss (%)
Ancestries Reported - Ukrainian (%)
Ancestries Reported - United States (%)
Ancestries Reported - Welsh (%)
Ancestries Reported - West Indian (%)
Ancestries Reported - Other (%)
Geographical mobility - Same house 1 year ago (%)
Geographical mobility - Same house 1 year ago (%) - White
Geographical mobility - Same house 1 year ago (%) - Black or African American
Geographical mobility - Same house 1 year ago (%) - Asian
Geographical mobility - Same house 1 year ago (%) - Hispanic or Latino
Geographical mobility - Same house 1 year ago (%) - American Indian and Alaska Native
Geographical mobility - Same house 1 year ago (%) - Multirace
Geographical mobility - Same house 1 year ago (%) - Other Race
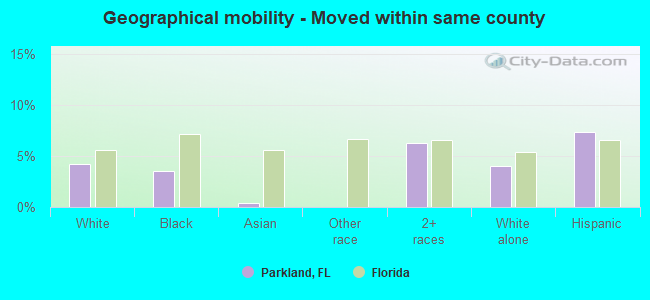
Geographical mobility - Moved within same county (%)
Geographical mobility - Moved within same county (%) - White
Geographical mobility - Moved within same county (%) - Black or African American
Geographical mobility - Moved within same county (%) - Asian
Geographical mobility - Moved within same county (%) - Hispanic or Latino
Geographical mobility - Moved within same county (%) - American Indian and Alaska Native
Geographical mobility - Moved within same county (%) - Multirace
Geographical mobility - Moved within same county (%) - Other Race
Geographical mobility - Moved from different county within same state (%)
Geographical mobility - Moved from different county within same state (%) - White
Geographical mobility - Moved from different county within same state (%) - Black or African American
Geographical mobility - Moved from different county within same state (%) - Asian
Geographical mobility - Moved from different county within same state (%) - Hispanic or Latino
Geographical mobility - Moved from different county within same state (%) - American Indian and Alaska Native
Geographical mobility - Moved from different county within same state (%) - Multirace
Geographical mobility - Moved from different county within same state (%) - Other Race
Geographical mobility - Moved from different state (%)
Geographical mobility - Moved from different state (%) - White
Geographical mobility - Moved from different state (%) - Black or African American
Geographical mobility - Moved from different state (%) - Asian
Geographical mobility - Moved from different state (%) - Hispanic or Latino
Geographical mobility - Moved from different state (%) - American Indian and Alaska Native
Geographical mobility - Moved from different state (%) - Multirace
Geographical mobility - Moved from different state (%) - Other Race
Geographical mobility - Moved from abroad (%)
Geographical mobility - Moved from abroad (%) - White
Geographical mobility - Moved from abroad (%) - Black or African American
Geographical mobility - Moved from abroad (%) - Asian
Geographical mobility - Moved from abroad (%) - Hispanic or Latino
Geographical mobility - Moved from abroad (%) - American Indian and Alaska Native
Geographical mobility - Moved from abroad (%) - Multirace
Geographical mobility - Moved from abroad (%) - Other Race
Place of birth for the foreign-born population - Ireland (%)
Place of birth for the foreign-born population - Denmark (%)
Place of birth for the foreign-born population - Norway (%)
Place of birth for the foreign-born population - Sweden (%)
Place of birth for the foreign-born population - United Kingdom (%)
Place of birth for the foreign-born population - England (%)
Place of birth for the foreign-born population - Scotland (%)
Place of birth for the foreign-born population - Other Northern Europe (%)
Place of birth for the foreign-born population - Austria (%)
Place of birth for the foreign-born population - Belgium (%)
Place of birth for the foreign-born population - France (%)
Place of birth for the foreign-born population - Germany (%)
Place of birth for the foreign-born population - Netherlands (%)
Place of birth for the foreign-born population - Switzerland (%)
Place of birth for the foreign-born population - Other Western Europe (%)
Place of birth for the foreign-born population - Greece (%)
Place of birth for the foreign-born population - Italy (%)
Place of birth for the foreign-born population - Portugal (%)
Place of birth for the foreign-born population - Spain (%)
Place of birth for the foreign-born population - Other Southern Europe (%)
Place of birth for the foreign-born population - Albania (%)
Place of birth for the foreign-born population - Belarus (%)
Place of birth for the foreign-born population - Bosnia and Herzegovina (%)
Place of birth for the foreign-born population - Bulgaria (%)
Place of birth for the foreign-born population - Croatia (%)
Place of birth for the foreign-born population - Czechoslovakia (%)
Place of birth for the foreign-born population - Hungary (%)
Place of birth for the foreign-born population - Latvia (%)
Place of birth for the foreign-born population - Lithuania (%)
Place of birth for the foreign-born population - North Macedonia (Macedonia) (%)
Place of birth for the foreign-born population - Moldova (%)
Place of birth for the foreign-born population - Poland (%)
Place of birth for the foreign-born population - Romania (%)
Place of birth for the foreign-born population - Russia (%)
Place of birth for the foreign-born population - Serbia (%)
Place of birth for the foreign-born population - Ukraine (%)
Place of birth for the foreign-born population - Other Eastern Europe (%)
Place of birth for the foreign-born population - China (%)
Place of birth for the foreign-born population - Hong Kong (%)
Place of birth for the foreign-born population - Taiwan (%)
Place of birth for the foreign-born population - Japan (%)
Place of birth for the foreign-born population - Korea (%)
Place of birth for the foreign-born population - Other Eastern Asia (%)
Place of birth for the foreign-born population - Afghanistan (%)
Place of birth for the foreign-born population - Bangladesh (%)
Place of birth for the foreign-born population - India (%)
Place of birth for the foreign-born population - Iran (%)
Place of birth for the foreign-born population - Kazakhstan (%)
Place of birth for the foreign-born population - Nepal (%)
Place of birth for the foreign-born population - Pakistan (%)
Place of birth for the foreign-born population - Sri Lanka (%)
Place of birth for the foreign-born population - Uzbekistan (%)
Place of birth for the foreign-born population - Other South Central Asia (%)
Place of birth for the foreign-born population - Burma (%)
Place of birth for the foreign-born population - Cambodia (%)
Place of birth for the foreign-born population - Indonesia (%)
Place of birth for the foreign-born population - Laos (%)
Place of birth for the foreign-born population - Malaysia (%)
Place of birth for the foreign-born population - Philippines (%)
Place of birth for the foreign-born population - Singapore (%)
Place of birth for the foreign-born population - Thailand (%)
Place of birth for the foreign-born population - Vietnam (%)
Place of birth for the foreign-born population - Other South Eastern Asia (%)
Place of birth for the foreign-born population - Armenia (%)
Place of birth for the foreign-born population - Iraq (%)
Place of birth for the foreign-born population - Israel (%)
Place of birth for the foreign-born population - Jordan (%)
Place of birth for the foreign-born population - Kuwait (%)
Place of birth for the foreign-born population - Lebanon (%)
Place of birth for the foreign-born population - Saudi Arabia (%)
Place of birth for the foreign-born population - Syria (%)
Place of birth for the foreign-born population - Turkey (%)
Place of birth for the foreign-born population - Yemen (%)
Place of birth for the foreign-born population - Other Western Asia (%)
Place of birth for the foreign-born population - Eritrea (%)
Place of birth for the foreign-born population - Ethiopia (%)
Place of birth for the foreign-born population - Kenya (%)
Place of birth for the foreign-born population - Somalia (%)
Place of birth for the foreign-born population - Uganda (%)
Place of birth for the foreign-born population - Zimbabwe (%)
Place of birth for the foreign-born population - Other Eastern Africa (%)
Place of birth for the foreign-born population - Cameroon (%)
Place of birth for the foreign-born population - Congo (%)
Place of birth for the foreign-born population - Democratic Republic of Congo (Zaire) (%)
Place of birth for the foreign-born population - Other Middle Africa (%)
Place of birth for the foreign-born population - Egypt (%)
Place of birth for the foreign-born population - Morocco (%)
Place of birth for the foreign-born population - Sudan (%)
Place of birth for the foreign-born population - Other Northern Africa (%)
Place of birth for the foreign-born population - South Africa (%)
Place of birth for the foreign-born population - Other Southern Africa (%)
Place of birth for the foreign-born population - Cabo Verde (%)
Place of birth for the foreign-born population - Ghana (%)
Place of birth for the foreign-born population - Liberia (%)
Place of birth for the foreign-born population - Nigeria (%)
Place of birth for the foreign-born population - Senegal (%)
Place of birth for the foreign-born population - Sierra Leone (%)
Place of birth for the foreign-born population - Other Western Africa (%)
Place of birth for the foreign-born population - Australia (%)
Place of birth for the foreign-born population - New Zealand (%)
Place of birth for the foreign-born population - Fiji (%)
Place of birth for the foreign-born population - Micronesia (%)
Place of birth for the foreign-born population - Bahamas (%)
Place of birth for the foreign-born population - Barbados (%)
Place of birth for the foreign-born population - Cuba (%)
Place of birth for the foreign-born population - Dominica (%)
Place of birth for the foreign-born population - Dominican Republic (%)
Place of birth for the foreign-born population - Grenada (%)
Place of birth for the foreign-born population - Haiti (%)
Place of birth for the foreign-born population - Jamaica (%)
Place of birth for the foreign-born population - St. Vincent and the Grenadines (%)
Place of birth for the foreign-born population - Trinidad and Tobago (%)
Place of birth for the foreign-born population - West Indies (%)
Place of birth for the foreign-born population - Other Caribbean (%)
Place of birth for the foreign-born population - Belize (%)
Place of birth for the foreign-born population - Costa Rica (%)
Place of birth for the foreign-born population - El Salvador (%)
Place of birth for the foreign-born population - Guatemala (%)
Place of birth for the foreign-born population - Honduras (%)
Place of birth for the foreign-born population - Mexico (%)
Place of birth for the foreign-born population - Nicaragua (%)
Place of birth for the foreign-born population - Panama (%)
Place of birth for the foreign-born population - Other Central America (%)
Place of birth for the foreign-born population - Argentina (%)
Place of birth for the foreign-born population - Bolivia (%)
Place of birth for the foreign-born population - Brazil (%)
Place of birth for the foreign-born population - Chile (%)
Place of birth for the foreign-born population - Colombia (%)
Place of birth for the foreign-born population - Ecuador (%)
Place of birth for the foreign-born population - Guyana (%)
Place of birth for the foreign-born population - Peru (%)
Place of birth for the foreign-born population - Uruguay (%)
Place of birth for the foreign-born population - Venezuela (%)
Place of birth for the foreign-born population - Other South America (%)
Place of birth for the foreign-born population - Canada (%)
Place of birth for the foreign-born population - Other Northern America (%)
Place of birth for the foreign-born population - Other (%)
Latest news about races in Parkland, FL collected exclusively by city-data.com from local newspapers, TV, and radio stations
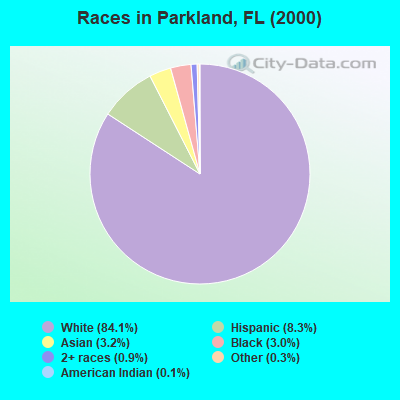
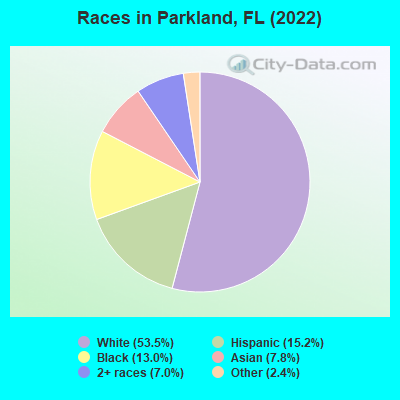
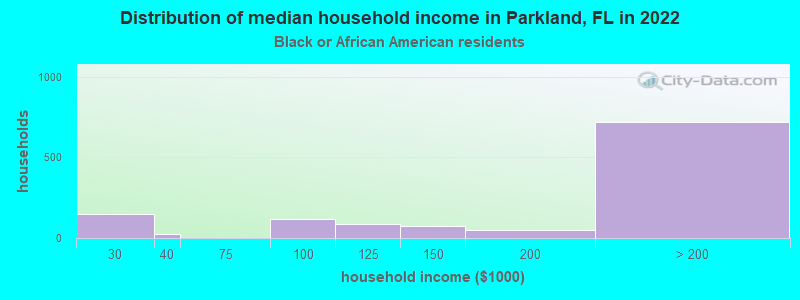
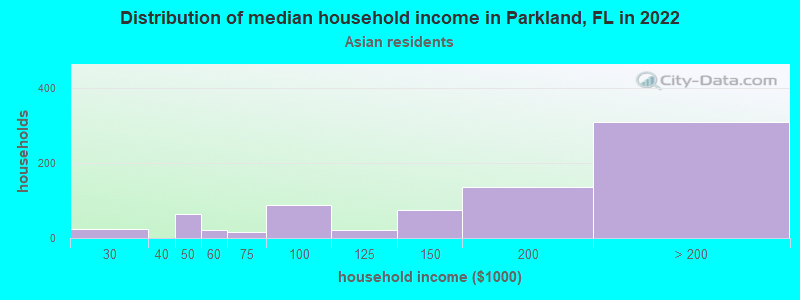
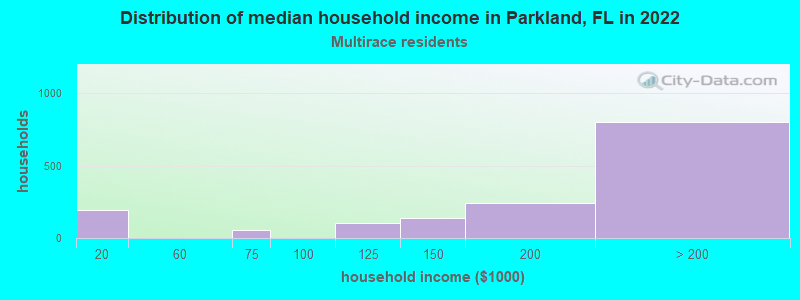
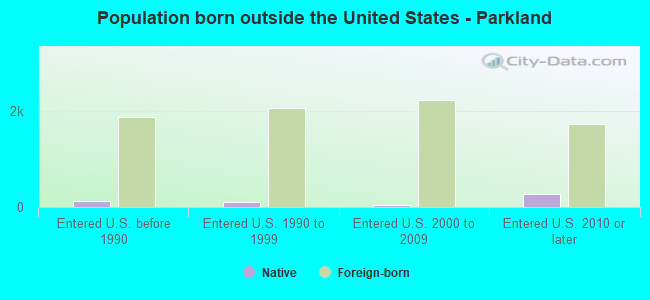
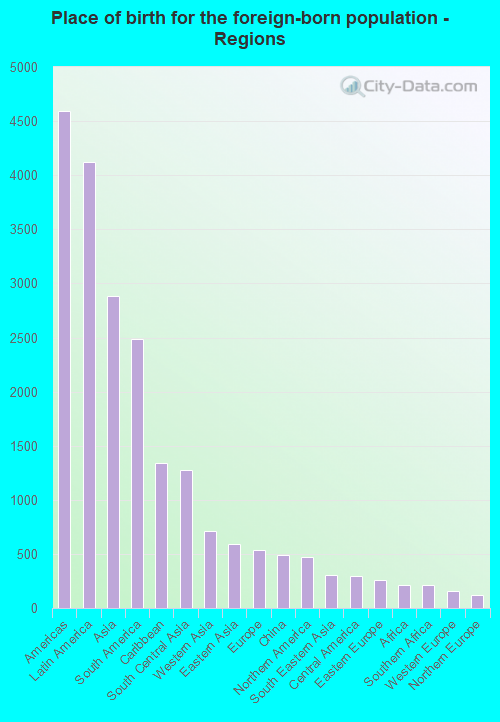
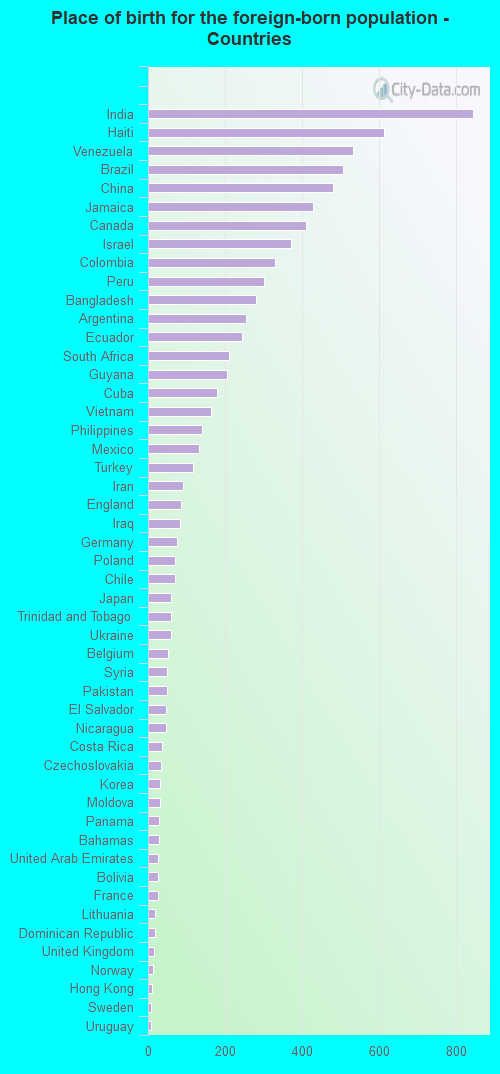
According to 2022 data, the most numerous races in Parkland, FL are White alone (18,686 residents), Hispanic (5,317 residents), and Black alone (4,538 residents). 72.2% of Parkland residents speak English at home. 23.5% of Parkland, FL residents are foreign-born (11.1% born in Latin America, 7.8% born in Asia), which is 10.8% greater than the foreign-born rate of 21.0% across the entire state of Florida.
Race distribution in Parkland
2000 2022
10,458,509 65.4% White alone 2,682,715 16.8% Hispanic 2,264,268 14.2% Black alone 261,693 1.6% Asian alone 236,954 1.5% Two or more races 42,358 0.3% American Indian alone 28,994 0.2% Other race alone 6,887 0.04% Native Hawaiian and Other
11,309,403 50.8% White alone 6,025,039 27.1% Hispanic 3,241,015 14.6% Black alone 861,630 3.9% Two or more races 623,692 2.8% Asian alone 152,054 0.7% Other race alone 22,504 0.1% American Indian alone 9,486 0.04% Native Hawaiian and Other
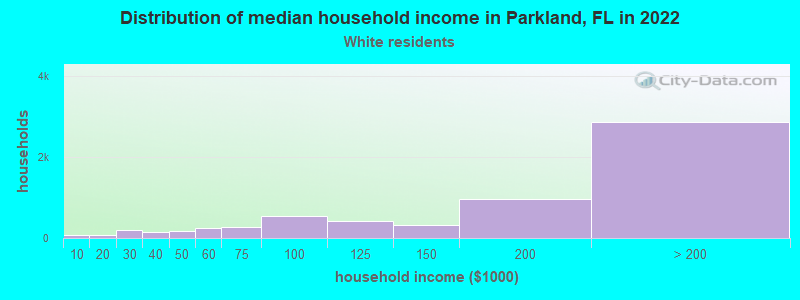
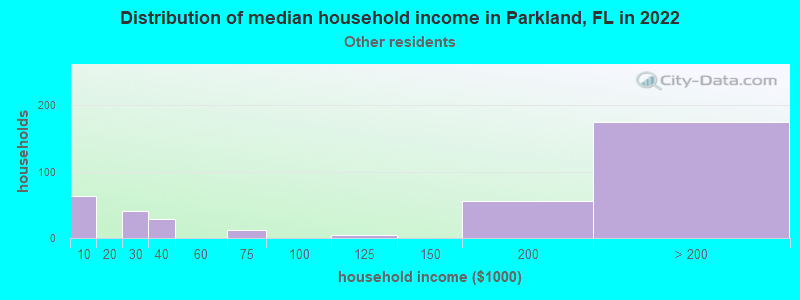
Income and house value in Parkland Median household income in 2022 $189,060 White non-Hispanic householdersover $200,000 Black householders$165,972 Asian householdersover $200,000 Two or more races householders$188,209 Hispanic or Latino race householdersMedian 2022 house value $929,808 White Non-Hispanic householders$927,434 Black or African American householders over $1,000,000 Asian householders$724,437 Some other race householders$839,290 Two or more races householders$710,488 Hispanic or Latino householders
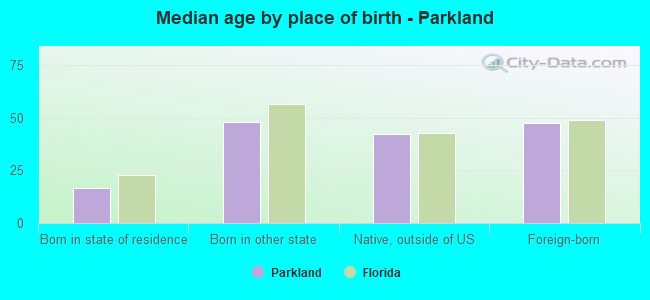
Median age by race in Parkland
41.2 Median age for White residents35.5 47.0 32.4 Median age for Black or African American residents43.7 24.7 -660,098,521.5 Median age for American Indian / Alaska Native residents-518,333,332.8 -735,362,996.9 42.1 Median age for Asian residents41.7 42.2 -437,357,630.5 Median age for Native Hawaiian / Pacific Islander residents-454,756,380.1 -666,666,666.0 39.9 Median age for Other race residents43.1 38.2 36.9 Median age for Two or more races residents37.0 36.8 39.6 Median age for White alone residents34.0 46.0 39.9 Median age for Hispanic or Latino residents35.4 43.7
Owner/renter occupied households by race in Parkland
House owners and renters - White residents 5,461 88.0% Owner occupied742 12.0% Renter occupiedHouse owners and renters - Black or African American residents 978 78.6% Owner occupied266 21.4% Renter occupiedHouse owners and renters - Asian residents 683 93.2% Owner occupied50 6.8% Renter occupiedHouse owners and renters - Other race residents 250 73.4% Owner occupied91 26.6% Renter occupiedHouse owners and renters - Two or more races residents 1,329 90.0% Owner occupied148 10.0% Renter occupiedHouse owners and renters - White alone residents 5,423 87.4% Owner occupied781 12.6% Renter occupiedHouse owners and renters - Hispanic or Latino residents 1,483 88.4% Owner occupied195 11.6% Renter occupied
Language usage in Parkland
English speakers - Total 72.2% of residents of Parkland speak English at home.
12.2% of residents speak Spanish at home 3,083 76.9% Speak English very well927 23.1% Speak English less than very well14.3% of residents speak other language at home 3,977 84.7% Speak English very well716 15.3% Speak English less than very well
English speakers - Born in the United States 90.9% of residents of Parkland speak English at home.
5.4% of residents speak Spanish at home 640 92.1% Speak English very well55 7.9% Speak English less than very well3.6% of residents speak other language at home 434 91.9% Speak English very well38 8.1% Speak English less than very well
English speakers - Native, born elsewhere 62.4% of residents of Parkland speak English at home.
28.8% of residents speak Spanish at home 119 83.2% Speak English very well24 16.8% Speak English less than very well6.8% of residents speak other language at home 34 100.0% Speak English very well
English speakers - Foreign-born 27.7% of residents of Parkland speak English at home.
27.2% of residents speak Spanish at home 1,410 63.6% Speak English very well806 36.4% Speak English less than very well43.9% of residents speak other language at home 2,935 82.2% Speak English very well635 17.8% Speak English less than very well
White (Caucasian) - Speak only English Native:
97.2% (15,165)Foreign-born:
37.9% (715)
White (Caucasian) - Speak another language Native:
6.2% (963)Foreign-born:
68.2% (1,288)
Black or African American - Speak only English Native:
92.0% (3,378)Foreign-born:
51.0% (473)
Black or African American - Speak another language Native:
8.3% (304)Foreign-born:
48.8% (453)
Asian - Speak only English Native:
21.7% (147)Foreign-born:
22.0% (427)
Asian - Speak another language Native:
83.3% (565)Foreign-born:
77.9% (1,514)
Other race - Speak only English Native:
83.5% (363)Foreign-born:
63.9% (468)
Other race - Speak another language Native:
21.5% (93)Foreign-born:
38.0% (278)
Two or more races - Speak only English Native:
69.4% (1,856)Foreign-born:
12.1% (264)
Two or more races - Speak another language Native:
29.4% (787)Foreign-born:
87.4% (1,909)
White alone - Speak only English Native:
95.3% (15,095)Foreign-born:
36.7% (628)
White alone - Speak another language Native:
4.7% (740)Foreign-born:
63.8% (1,093)
Hispanic or Latino - Speak only English Native:
54.3% (1,381)Foreign-born:
10.8% (268)
Hispanic or Latino - Speak another language Native:
46.1% (1,172)Foreign-born:
89.5% (2,212)
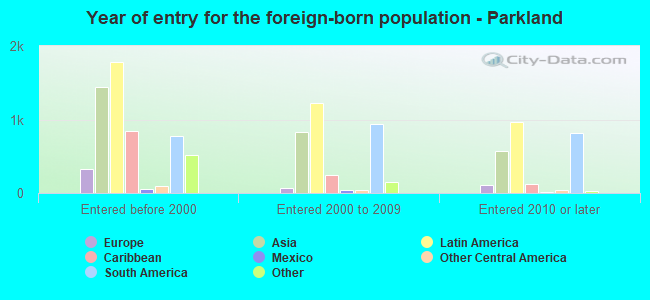
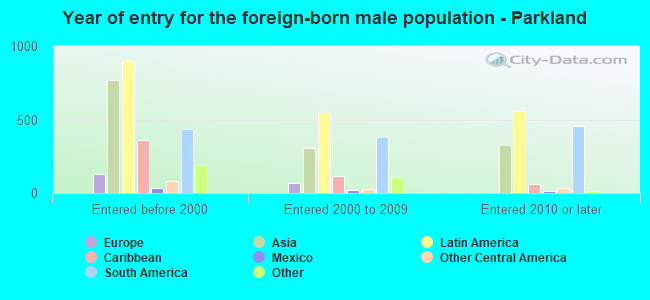
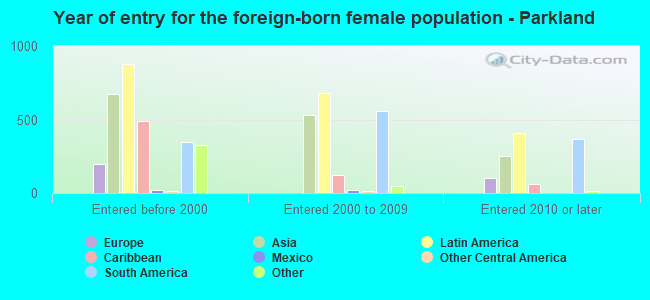
Foreign-born residents in Parkland 8,223 residents are foreign born (11.1% Latin America , 7.8% Asia ).
This city:
23.5%Florida:
21.1%
Marital status for residents in Parkland Marital status - White (Caucasian) population 15 years and over
Males 28.5% Never married63.8% Now married0.0% Separated0.8% Widowed6.9% DivorcedFemales 19.4% Never married68.1% Now married0.2% Separated4.8% Widowed7.4% DivorcedWomen who gave birth in the past 12 months Now married:
100.0% (294)Unmarried:
0.0% (0)
Women who did not give birth in the past 12 months Now married:
58.2% (1,839)Unmarried:
41.8% (1,320)
Marital status - Black or African American population 15 years and over
Males 30.1% Never married61.3% Now married1.2% Separated0.0% Widowed7.3% DivorcedFemales 52.8% Never married34.3% Now married0.8% Separated7.8% Widowed4.3% DivorcedWomen who did not give birth in the past 12 months Now married:
27.2% (424)Unmarried:
72.8% (1,133)
Marital status - Asian population 15 years and over
Males 16.3% Never married69.3% Now married0.0% Separated3.6% Widowed10.7% DivorcedFemales 14.2% Never married66.5% Now married4.0% Separated6.4% Widowed8.8% DivorcedWomen who gave birth in the past 12 months Now married:
100.0% (24)Unmarried:
0.0% (0)
Women who did not give birth in the past 12 months Now married:
74.7% (615)Unmarried:
25.3% (208)
Marital status - Other race population 15 years and over
Males 17.8% Never married66.2% Now married0.0% Separated0.0% Widowed16.0% DivorcedFemales 28.4% Never married44.8% Now married0.0% Separated18.3% Widowed8.5% DivorcedWomen who did not give birth in the past 12 months Now married:
44.4% (143)Unmarried:
55.6% (179)
Marital status - Two or more races population 15 years and over
Males 14.5% Never married77.9% Now married1.2% Separated0.0% Widowed6.4% DivorcedFemales 23.3% Never married63.8% Now married0.0% Separated0.9% Widowed12.0% DivorcedWomen who did not give birth in the past 12 months Now married:
57.6% (615)Unmarried:
42.4% (454)
Marital status - White alone, not Hispanic / Latino population 15 years and over
Males 28.2% Never married63.1% Now married0.0% Separated0.9% Widowed7.8% DivorcedFemales 18.9% Never married67.4% Now married0.3% Separated5.2% Widowed8.2% DivorcedWomen who gave birth in the past 12 months Now married:
100.0% (286)Unmarried:
0.0% (0)
Women who did not give birth in the past 12 months Now married:
56.0% (1,726)Unmarried:
44.0% (1,358)
Marital status - Hispanic or Latino population 15 years and over
Males 23.3% Never married69.1% Now married0.8% Separated0.0% Widowed6.8% DivorcedFemales 19.9% Never married67.3% Now married0.0% Separated4.1% Widowed8.6% DivorcedWomen who gave birth in the past 12 months Now married:
100.0% (78)Unmarried:
0.0% (0)
Women who did not give birth in the past 12 months Now married:
64.1% (854)Unmarried:
35.9% (478)
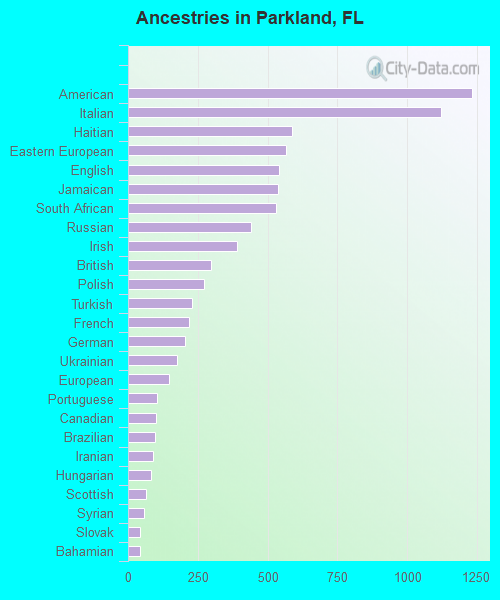
Ancestries in Parkland
1,232 7.0% American1,122 6.4% Italian589 3.4% Haitian566 3.2% Eastern European542 3.1% English538 3.1% Jamaican529 3.0% South African439 2.5% Russian390 2.2% Irish296 1.7% British272 1.6% Polish228 1.3% Turkish220 1.3% French206 1.2% German177 1.0% Ukrainian148 0.8% European105 0.6% Portuguese100 0.6% Canadian95 0.5% Brazilian91 0.5% Iranian81 0.5% Hungarian66 0.4% Scottish56 0.3% Syrian43 0.2% Slovak43 0.2% Bahamian40 0.2% Czech38 0.2% Lithuanian34 0.2% Israeli33 0.2% Latvian32 0.2% Swedish21 0.1% Arab17 0.10% West Indian16 0.09% Scotch-Irish13 0.07% Lebanese13 0.07% Norwegian12 0.07% Macedonian11 0.06% Dutch10 0.06% French Canadian8 0.05% Greek5 0.03% Czechoslovakian
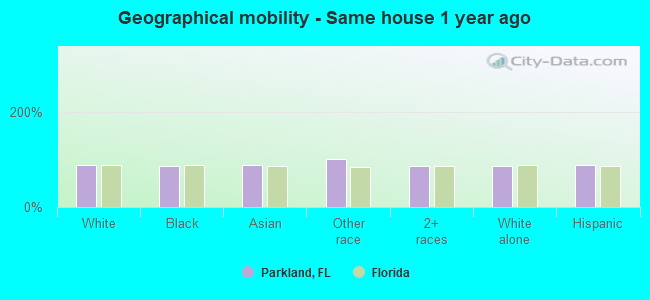
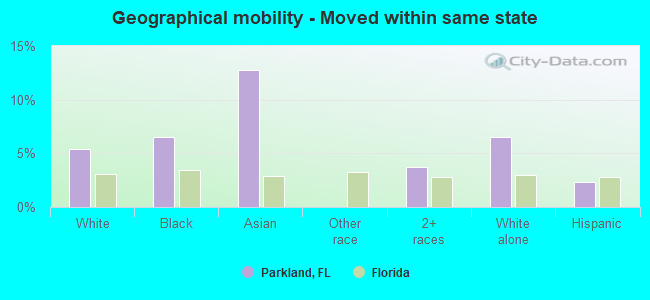
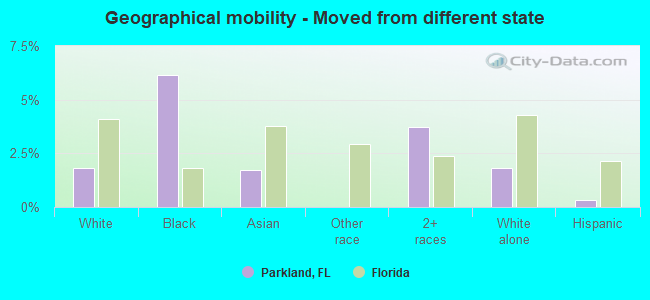
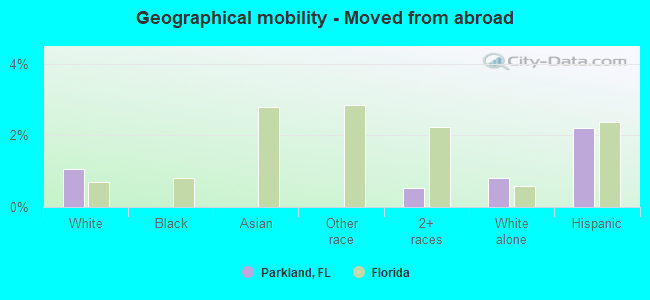
Geographical mobility in Parkland Same house 1 year ago 15,420 86.7% White (Caucasian)3,988 84.6% Black or African American2,447 88.6% Asian1,191 100.0% Other race4,649 85.2% Two or more races15,956 85.9% White alone, not Hispanic / Latino4,658 87.8% Hispanic or LatinoMoved within same county 742 4.2% White / Caucasian165 3.5% Black or African American12 0.4% Asian341 6.2% Two or more races752 4.0% White alone, not Hispanic / Latino388 7.3% Hispanic or LatinoMoved within same state 963 5.4% White / Caucasian309 6.6% Black or African American352 12.7% Asian203 3.7% Two or more races1,206 6.5% White alone, not Hispanic / Latino125 2.3% Hispanic or LatinoMoved from different state 323 1.8% White / Caucasian290 6.2% Black or African American47 1.7% Asian204 3.7% Two or more races340 1.8% White alone, not Hispanic / Latino18 0.3% Hispanic or LatinoMoved from abroad 188 1.1% White29 0.5% Two or more races152 0.8% White alone, not Hispanic / Latino116 2.2% Hispanic or Latino
Children Nativity (place of birth) in Parkland
Children under 6 years - Living with two parents Both parents native 1,615 99.5% Native7 0.5% Foreign-bornBoth parents foreign-born 283 79.1% Native75 20.9% Foreign-bornOne native, one foreign-born parent 584 100.0% NativeChildren under 6 years - Living with one parent Native parent 132 100.0% NativeForeign-born parent 39 100.0% NativeChildren 6 to 17 years - Living with two parents Both parents native 3,497 99.1% Native33 0.9% Foreign-bornBoth parents foreign-born 1,741 81.1% Native405 18.9% Foreign-bornOne native, one foreign-born parent 722 86.7% Native111 13.3% Foreign-bornChildren 6 to 17 years - Living with one parent Native parent 1,011 100.0% NativeForeign-born parent 175 57.4% Native129 42.6% Foreign-born
Grandparents responsible for own grandchildren in Parkland
Grandparents (30 to 59 years) Black or African American 14 100.0% Not responsible for grandchildren
Grandparents (60 years and over) Black or African American 64 100.0% Not responsible for grandchildren