Races in Parker, South Carolina (SC) Detailed Stats
Data:
Races - White alone (%)
Races - White alone (% change since 2000)
Races - Black alone (%)
Races - Black alone (% change since 2000)
Races - American Indian alone (%)
Races - American Indian alone (% change since 2000)
Races - Asian alone (%)
Races - Asian alone (% change since 2000)
Races - Hispanic (%)
Races - Hispanic (% change since 2000)
Races - Native Hawaiian and Other Pacific Islander alone (%)
Races - Native Hawaiian and Other Pacific Islander alone (% change since 2000)
Races - Two or more races(%)
Races - Two or more races(% change since 2000)
Races - Other race alone (%)
Races - Other race alone (% change since 2000)
Racial diversity
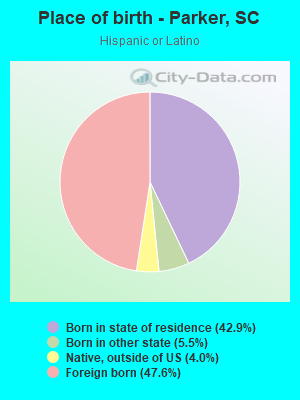
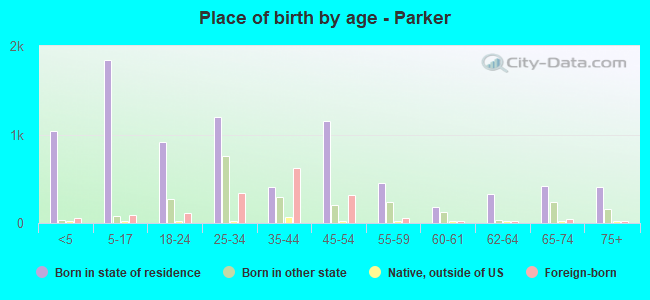
Place of birth - Born in state of residence (%)
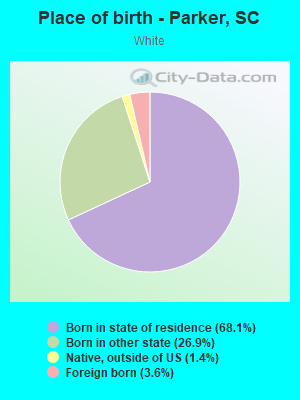
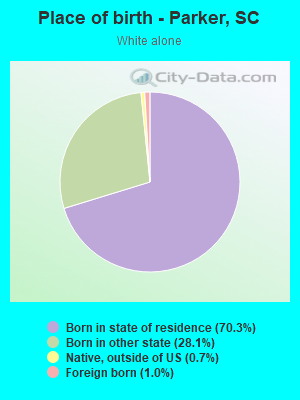
Place of birth - Born in state of residence (%) - White
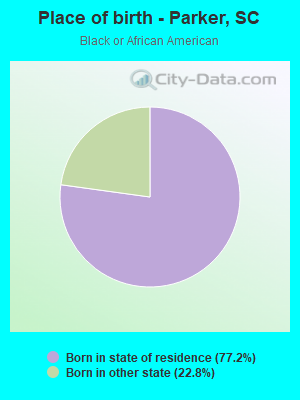
Place of birth - Born in state of residence (%) - Black or African American
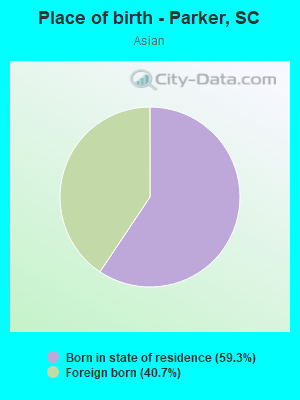
Place of birth - Born in state of residence (%) - Asian
Place of birth - Born in state of residence (%) - Hispanic or Latino
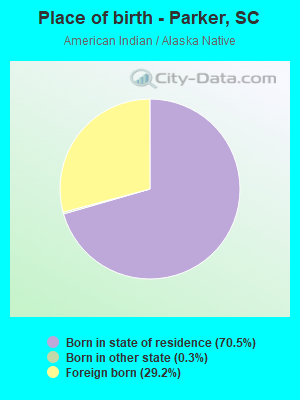
Place of birth - Born in state of residence (%) - American Indian and Alaska Native
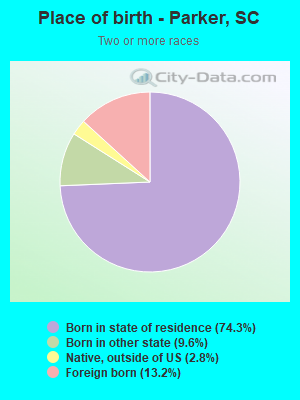
Place of birth - Born in state of residence (%) - Multirace
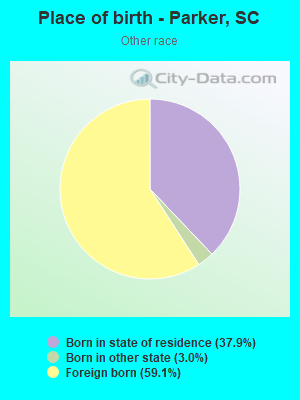
Place of birth - Born in state of residence (%) - Other Race
Place of birth - Born in other state (%)
Place of birth - Born in other state (%) - White
Place of birth - Born in other state (%) - Black or African American
Place of birth - Born in other state (%) - Asian
Place of birth - Born in other state (%) - Hispanic or Latino
Place of birth - Born in other state (%) - American Indian and Alaska Native
Place of birth - Born in other state (%) - Multirace
Place of birth - Born in other state (%) - Other Race
Place of birth - Native, outside of US (%)
Place of birth - Native, outside of US (%) - White
Place of birth - Native, outside of US (%) - Black or African American
Place of birth - Native, outside of US (%) - Asian
Place of birth - Native, outside of US (%) - Hispanic or Latino
Place of birth - Native, outside of US (%) - American Indian and Alaska Native
Place of birth - Native, outside of US (%) - Multirace
Place of birth - Native, outside of US (%) - Other Race
Place of birth - Foreign born (%)
Place of birth - Foreign born (%) - White
Place of birth - Foreign born (%) - Black or African American
Place of birth - Foreign born (%) - Asian
Place of birth - Foreign born (%) - Hispanic or Latino
Place of birth - Foreign born (%) - American Indian and Alaska Native
Place of birth - Foreign born (%) - Multirace
Place of birth - Foreign born (%) - Other Race
Residents speaking English at home (%)
Residents speaking English at home - Born in the United States (%)
Residents speaking English at home - Native, born elsewhere (%)
Residents speaking English at home - Foreign born (%)
Residents speaking Spanish at home (%)
Residents speaking Spanish at home - Born in the United States (%)
Residents speaking Spanish at home - Native, born elsewhere (%)
Residents speaking Spanish at home - Foreign born (%)
Residents speaking other language at home (%)
Residents speaking other language at home - Born in the United States (%)
Residents speaking other language at home - Native, born elsewhere (%)
Residents speaking other language at home - Foreign born (%)
Marital status - Never married (%)
Marital status - Now married (%)
Marital status - Separated (%)
Marital status - Widowed (%)
Marital status - Divorced (%)
Ancestries Reported - Arab (%)
Ancestries Reported - Czech (%)
Ancestries Reported - Danish (%)
Ancestries Reported - Dutch (%)
Ancestries Reported - English (%)
Ancestries Reported - French (%)
Ancestries Reported - French Canadian (%)
Ancestries Reported - German (%)
Ancestries Reported - Greek (%)
Ancestries Reported - Hungarian (%)
Ancestries Reported - Irish (%)
Ancestries Reported - Italian (%)
Ancestries Reported - Lithuanian (%)
Ancestries Reported - Norwegian (%)
Ancestries Reported - Polish (%)
Ancestries Reported - Portuguese (%)
Ancestries Reported - Russian (%)
Ancestries Reported - Scotch-Irish (%)
Ancestries Reported - Scottish (%)
Ancestries Reported - Slovak (%)
Ancestries Reported - Subsaharan African (%)
Ancestries Reported - Swedish (%)
Ancestries Reported - Swiss (%)
Ancestries Reported - Ukrainian (%)
Ancestries Reported - United States (%)
Ancestries Reported - Welsh (%)
Ancestries Reported - West Indian (%)
Ancestries Reported - Other (%)
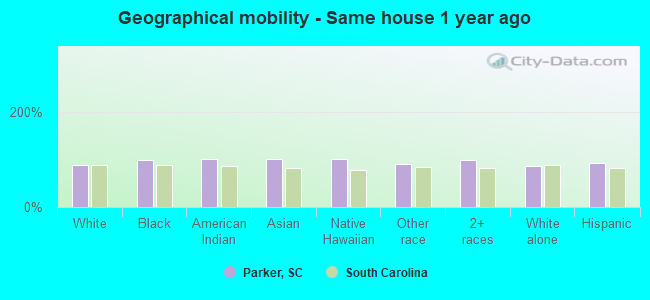
Geographical mobility - Same house 1 year ago (%)
Geographical mobility - Same house 1 year ago (%) - White
Geographical mobility - Same house 1 year ago (%) - Black or African American
Geographical mobility - Same house 1 year ago (%) - Asian
Geographical mobility - Same house 1 year ago (%) - Hispanic or Latino
Geographical mobility - Same house 1 year ago (%) - American Indian and Alaska Native
Geographical mobility - Same house 1 year ago (%) - Multirace
Geographical mobility - Same house 1 year ago (%) - Other Race
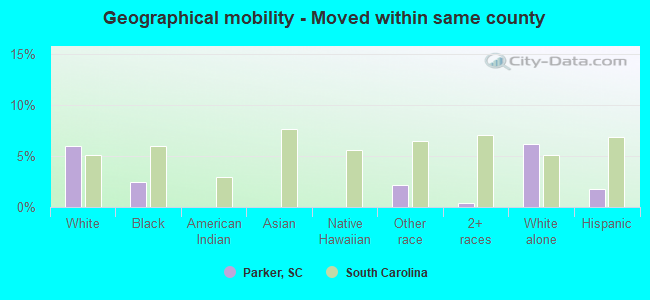
Geographical mobility - Moved within same county (%)
Geographical mobility - Moved within same county (%) - White
Geographical mobility - Moved within same county (%) - Black or African American
Geographical mobility - Moved within same county (%) - Asian
Geographical mobility - Moved within same county (%) - Hispanic or Latino
Geographical mobility - Moved within same county (%) - American Indian and Alaska Native
Geographical mobility - Moved within same county (%) - Multirace
Geographical mobility - Moved within same county (%) - Other Race
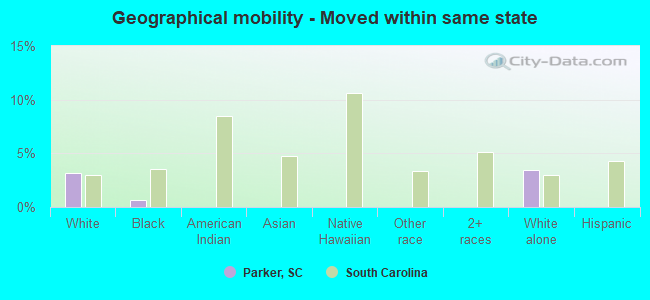
Geographical mobility - Moved from different county within same state (%)
Geographical mobility - Moved from different county within same state (%) - White
Geographical mobility - Moved from different county within same state (%) - Black or African American
Geographical mobility - Moved from different county within same state (%) - Asian
Geographical mobility - Moved from different county within same state (%) - Hispanic or Latino
Geographical mobility - Moved from different county within same state (%) - American Indian and Alaska Native
Geographical mobility - Moved from different county within same state (%) - Multirace
Geographical mobility - Moved from different county within same state (%) - Other Race
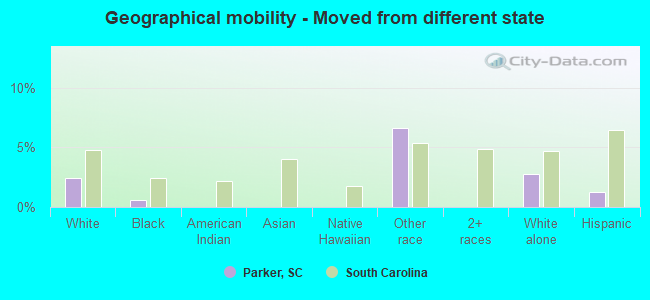
Geographical mobility - Moved from different state (%)
Geographical mobility - Moved from different state (%) - White
Geographical mobility - Moved from different state (%) - Black or African American
Geographical mobility - Moved from different state (%) - Asian
Geographical mobility - Moved from different state (%) - Hispanic or Latino
Geographical mobility - Moved from different state (%) - American Indian and Alaska Native
Geographical mobility - Moved from different state (%) - Multirace
Geographical mobility - Moved from different state (%) - Other Race
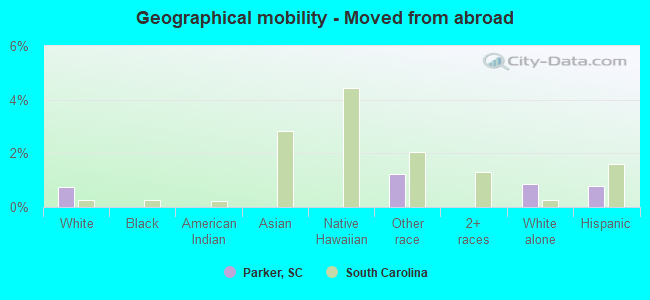
Geographical mobility - Moved from abroad (%)
Geographical mobility - Moved from abroad (%) - White
Geographical mobility - Moved from abroad (%) - Black or African American
Geographical mobility - Moved from abroad (%) - Asian
Geographical mobility - Moved from abroad (%) - Hispanic or Latino
Geographical mobility - Moved from abroad (%) - American Indian and Alaska Native
Geographical mobility - Moved from abroad (%) - Multirace
Geographical mobility - Moved from abroad (%) - Other Race
Place of birth for the foreign-born population - Ireland (%)
Place of birth for the foreign-born population - Denmark (%)
Place of birth for the foreign-born population - Norway (%)
Place of birth for the foreign-born population - Sweden (%)
Place of birth for the foreign-born population - United Kingdom (%)
Place of birth for the foreign-born population - England (%)
Place of birth for the foreign-born population - Scotland (%)
Place of birth for the foreign-born population - Other Northern Europe (%)
Place of birth for the foreign-born population - Austria (%)
Place of birth for the foreign-born population - Belgium (%)
Place of birth for the foreign-born population - France (%)
Place of birth for the foreign-born population - Germany (%)
Place of birth for the foreign-born population - Netherlands (%)
Place of birth for the foreign-born population - Switzerland (%)
Place of birth for the foreign-born population - Other Western Europe (%)
Place of birth for the foreign-born population - Greece (%)
Place of birth for the foreign-born population - Italy (%)
Place of birth for the foreign-born population - Portugal (%)
Place of birth for the foreign-born population - Spain (%)
Place of birth for the foreign-born population - Other Southern Europe (%)
Place of birth for the foreign-born population - Albania (%)
Place of birth for the foreign-born population - Belarus (%)
Place of birth for the foreign-born population - Bosnia and Herzegovina (%)
Place of birth for the foreign-born population - Bulgaria (%)
Place of birth for the foreign-born population - Croatia (%)
Place of birth for the foreign-born population - Czechoslovakia (%)
Place of birth for the foreign-born population - Hungary (%)
Place of birth for the foreign-born population - Latvia (%)
Place of birth for the foreign-born population - Lithuania (%)
Place of birth for the foreign-born population - North Macedonia (Macedonia) (%)
Place of birth for the foreign-born population - Moldova (%)
Place of birth for the foreign-born population - Poland (%)
Place of birth for the foreign-born population - Romania (%)
Place of birth for the foreign-born population - Russia (%)
Place of birth for the foreign-born population - Serbia (%)
Place of birth for the foreign-born population - Ukraine (%)
Place of birth for the foreign-born population - Other Eastern Europe (%)
Place of birth for the foreign-born population - China (%)
Place of birth for the foreign-born population - Hong Kong (%)
Place of birth for the foreign-born population - Taiwan (%)
Place of birth for the foreign-born population - Japan (%)
Place of birth for the foreign-born population - Korea (%)
Place of birth for the foreign-born population - Other Eastern Asia (%)
Place of birth for the foreign-born population - Afghanistan (%)
Place of birth for the foreign-born population - Bangladesh (%)
Place of birth for the foreign-born population - India (%)
Place of birth for the foreign-born population - Iran (%)
Place of birth for the foreign-born population - Kazakhstan (%)
Place of birth for the foreign-born population - Nepal (%)
Place of birth for the foreign-born population - Pakistan (%)
Place of birth for the foreign-born population - Sri Lanka (%)
Place of birth for the foreign-born population - Uzbekistan (%)
Place of birth for the foreign-born population - Other South Central Asia (%)
Place of birth for the foreign-born population - Burma (%)
Place of birth for the foreign-born population - Cambodia (%)
Place of birth for the foreign-born population - Indonesia (%)
Place of birth for the foreign-born population - Laos (%)
Place of birth for the foreign-born population - Malaysia (%)
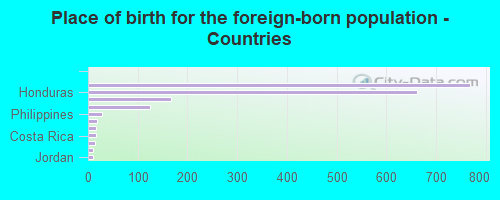
Place of birth for the foreign-born population - Philippines (%)
Place of birth for the foreign-born population - Singapore (%)
Place of birth for the foreign-born population - Thailand (%)
Place of birth for the foreign-born population - Vietnam (%)
Place of birth for the foreign-born population - Other South Eastern Asia (%)
Place of birth for the foreign-born population - Armenia (%)
Place of birth for the foreign-born population - Iraq (%)
Place of birth for the foreign-born population - Israel (%)
Place of birth for the foreign-born population - Jordan (%)
Place of birth for the foreign-born population - Kuwait (%)
Place of birth for the foreign-born population - Lebanon (%)
Place of birth for the foreign-born population - Saudi Arabia (%)
Place of birth for the foreign-born population - Syria (%)
Place of birth for the foreign-born population - Turkey (%)
Place of birth for the foreign-born population - Yemen (%)
Place of birth for the foreign-born population - Other Western Asia (%)
Place of birth for the foreign-born population - Eritrea (%)
Place of birth for the foreign-born population - Ethiopia (%)
Place of birth for the foreign-born population - Kenya (%)
Place of birth for the foreign-born population - Somalia (%)
Place of birth for the foreign-born population - Uganda (%)
Place of birth for the foreign-born population - Zimbabwe (%)
Place of birth for the foreign-born population - Other Eastern Africa (%)
Place of birth for the foreign-born population - Cameroon (%)
Place of birth for the foreign-born population - Congo (%)
Place of birth for the foreign-born population - Democratic Republic of Congo (Zaire) (%)
Place of birth for the foreign-born population - Other Middle Africa (%)
Place of birth for the foreign-born population - Egypt (%)
Place of birth for the foreign-born population - Morocco (%)
Place of birth for the foreign-born population - Sudan (%)
Place of birth for the foreign-born population - Other Northern Africa (%)
Place of birth for the foreign-born population - South Africa (%)
Place of birth for the foreign-born population - Other Southern Africa (%)
Place of birth for the foreign-born population - Cabo Verde (%)
Place of birth for the foreign-born population - Ghana (%)
Place of birth for the foreign-born population - Liberia (%)
Place of birth for the foreign-born population - Nigeria (%)
Place of birth for the foreign-born population - Senegal (%)
Place of birth for the foreign-born population - Sierra Leone (%)
Place of birth for the foreign-born population - Other Western Africa (%)
Place of birth for the foreign-born population - Australia (%)
Place of birth for the foreign-born population - New Zealand (%)
Place of birth for the foreign-born population - Fiji (%)
Place of birth for the foreign-born population - Micronesia (%)
Place of birth for the foreign-born population - Bahamas (%)
Place of birth for the foreign-born population - Barbados (%)
Place of birth for the foreign-born population - Cuba (%)
Place of birth for the foreign-born population - Dominica (%)
Place of birth for the foreign-born population - Dominican Republic (%)
Place of birth for the foreign-born population - Grenada (%)
Place of birth for the foreign-born population - Haiti (%)
Place of birth for the foreign-born population - Jamaica (%)
Place of birth for the foreign-born population - St. Vincent and the Grenadines (%)
Place of birth for the foreign-born population - Trinidad and Tobago (%)
Place of birth for the foreign-born population - West Indies (%)
Place of birth for the foreign-born population - Other Caribbean (%)
Place of birth for the foreign-born population - Belize (%)
Place of birth for the foreign-born population - Costa Rica (%)
Place of birth for the foreign-born population - El Salvador (%)
Place of birth for the foreign-born population - Guatemala (%)
Place of birth for the foreign-born population - Honduras (%)
Place of birth for the foreign-born population - Mexico (%)
Place of birth for the foreign-born population - Nicaragua (%)
Place of birth for the foreign-born population - Panama (%)
Place of birth for the foreign-born population - Other Central America (%)
Place of birth for the foreign-born population - Argentina (%)
Place of birth for the foreign-born population - Bolivia (%)
Place of birth for the foreign-born population - Brazil (%)
Place of birth for the foreign-born population - Chile (%)
Place of birth for the foreign-born population - Colombia (%)
Place of birth for the foreign-born population - Ecuador (%)
Place of birth for the foreign-born population - Guyana (%)
Place of birth for the foreign-born population - Peru (%)
Place of birth for the foreign-born population - Uruguay (%)
Place of birth for the foreign-born population - Venezuela (%)
Place of birth for the foreign-born population - Other South America (%)
Place of birth for the foreign-born population - Canada (%)
Place of birth for the foreign-born population - Other Northern America (%)
Place of birth for the foreign-born population - Other (%)
Latest news about races in Parker, SC collected exclusively by city-data.com from local newspapers, TV, and radio stations
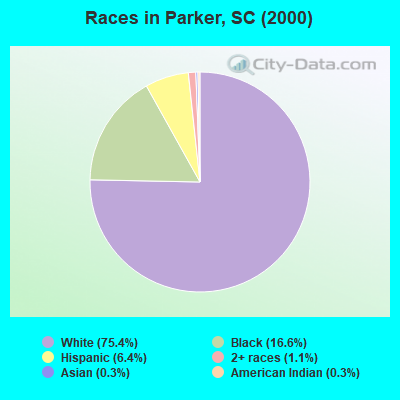
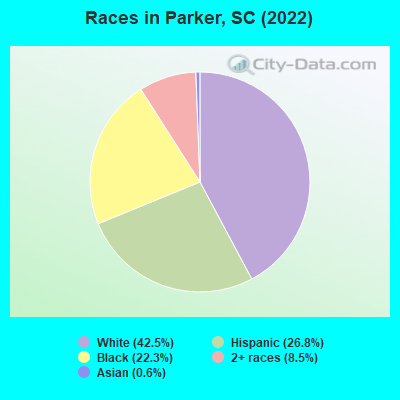
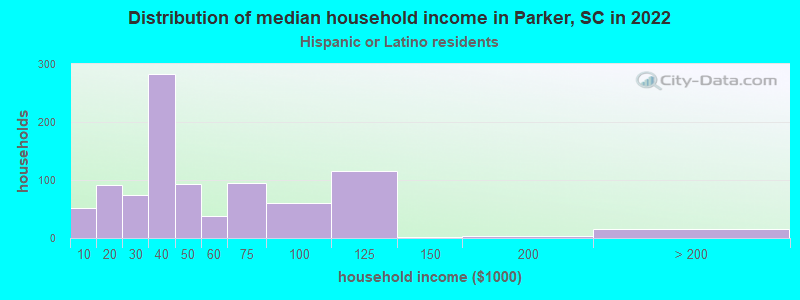
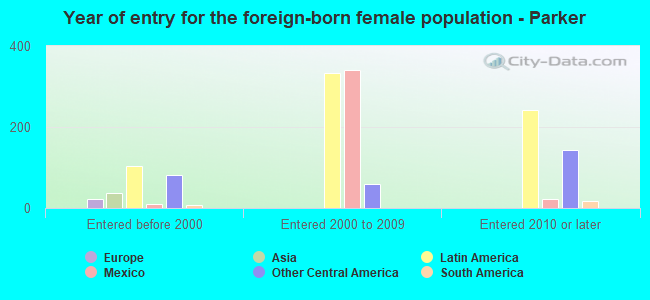
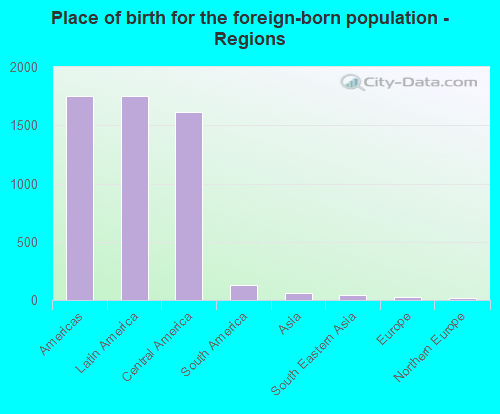
According to 2022 data, the most numerous races in Parker, SC are White alone (5,495 residents), Black alone (2,889 residents), and Hispanic (3,459 residents). 76.0% of Parker residents speak English at home. 14.2% of Parker, SC residents are foreign-born (13.9% born in Latin America), which is 64.8% greater than the foreign-born rate of 5.0% across the entire state of South Carolina.
Race distribution in Parker
2000 2022
2,652,291 66.1% White alone 1,178,486 29.4% Black alone 95,076 2.4% Hispanic 35,568 0.9% Asian alone 33,290 0.8% Two or more races 12,765 0.3% American Indian alone 3,266 0.08% Other race alone 1,270 0.03% Native Hawaiian and Other
3,301,739 62.5% White alone 1,313,290 24.9% Black alone 343,783 6.5% Hispanic 190,508 3.6% Two or more races 89,888 1.7% Asian alone 29,390 0.6% Other race alone 12,112 0.2% American Indian alone 1,924 0.04% Native Hawaiian and Other
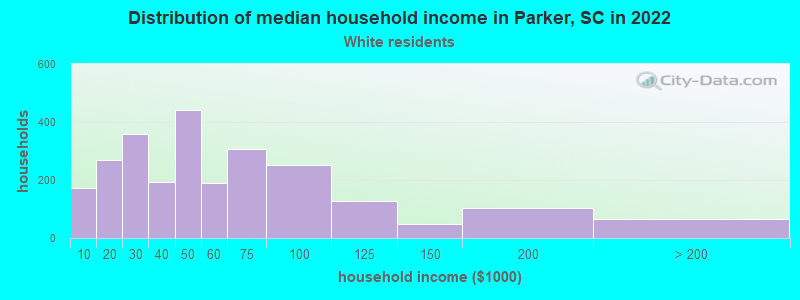
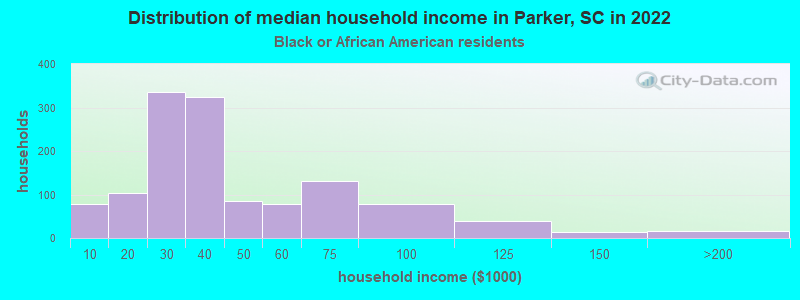
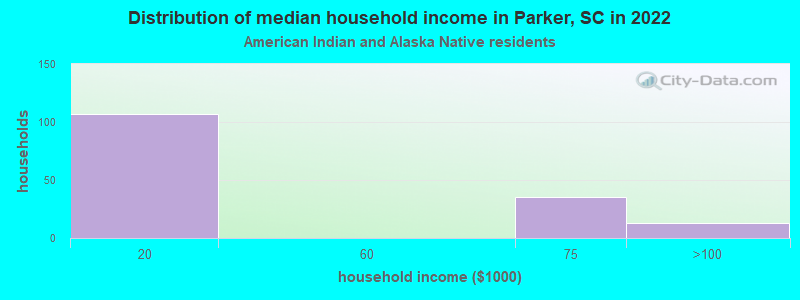
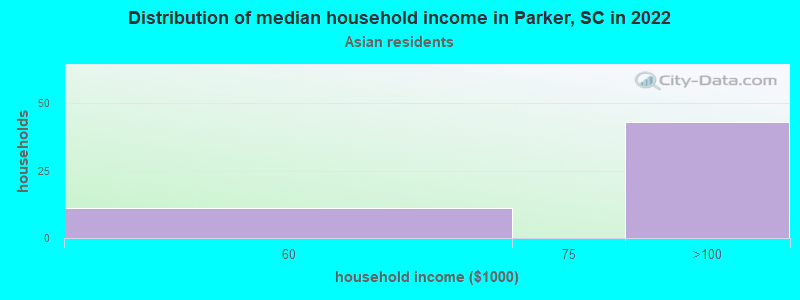
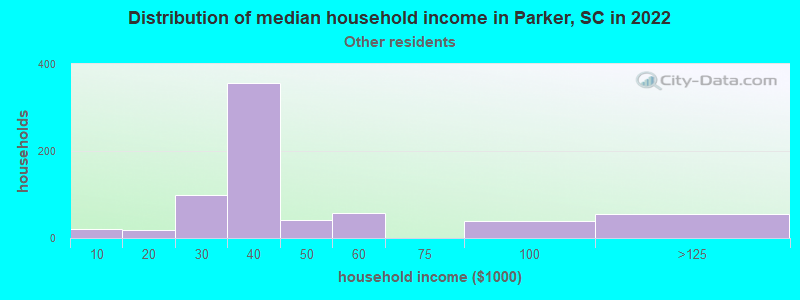
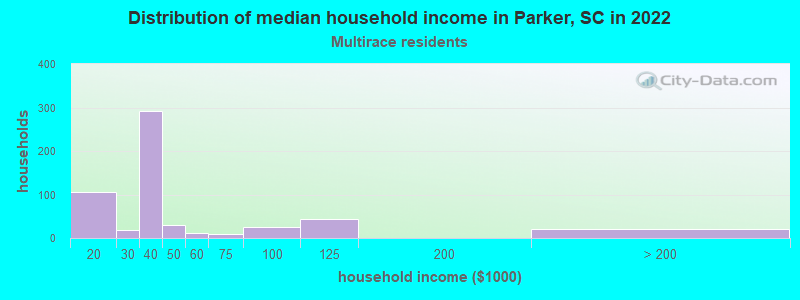
Income and house value in Parker Median household income in 2022 $43,455 White non-Hispanic householders$37,405 Black householders$38,594 Some other race householders$35,119 Two or more races householders$42,256 Hispanic or Latino race householdersMedian 2022 house value $127,790 White Non-Hispanic householders$121,024 Black or African American householders$137,813 American Indian or Alaska Native householders $187,926 Asian householders$137,813 Some other race householders$122,277 Two or more races householders$201,958 Hispanic or Latino householders
Median age by race in Parker
40.8 Median age for White residents30.6 48.3 33.4 Median age for Black or African American residents29.5 47.4 21.4 Median age for American Indian / Alaska Native residents59.0 14.3 29.7 Median age for Asian residents-702,317,289.9 30.2 -698,412,697.7 Median age for Native Hawaiian / Pacific Islander residents-551,574,375.1 -1,016,109,044.8 23.5 Median age for Other race residents28.8 22.2 12.2 Median age for Two or more races residents3.5 33.2 44.6 Median age for White alone residents32.4 49.6 24.5 Median age for Hispanic or Latino residents27.0 23.0
Owner/renter occupied households by race in Parker
House owners and renters - White residents 1,572 61.9% Owner occupied968 38.1% Renter occupiedHouse owners and renters - Black or African American residents 312 25.4% Owner occupied919 74.6% Renter occupiedHouse owners and renters - American Indian / Alaska Native residents 55 49.6% Owner occupied56 50.4% Renter occupiedHouse owners and renters - Asian residents 11 17.6% Owner occupied52 82.4% Renter occupiedHouse owners and renters - Native Hawaiian / Pacific Islander residents 24 100.0% Renter occupiedHouse owners and renters - Other race residents 156 20.5% Owner occupied607 79.5% Renter occupiedHouse owners and renters - Two or more races residents 166 30.0% Owner occupied388 70.0% Renter occupiedHouse owners and renters - White alone residents 1,549 62.5% Owner occupied931 37.5% Renter occupiedHouse owners and renters - Hispanic or Latino residents 288 29.5% Owner occupied689 70.5% Renter occupied
Language usage in Parker
English speakers - Total 76.0% of residents of Parker speak English at home.
22.5% of residents speak Spanish at home 1,115 42.2% Speak English very well1,530 57.8% Speak English less than very well0.7% of residents speak other language at home 58 65.9% Speak English very well30 34.1% Speak English less than very well
English speakers - Born in the United States 91.8% of residents of Parker speak English at home.
7.5% of residents speak Spanish at home 131 72.4% Speak English very well50 27.6% Speak English less than very well1.3% of residents speak other language at home 32 100.0% Speak English very well
English speakers - Native, born elsewhere 25.3% of residents of Parker speak English at home.
82.7% of residents speak Spanish at home 102 82.3% Speak English very well22 17.7% Speak English less than very well
English speakers - Foreign-born 11.0% of residents of Parker speak English at home.
74.9% of residents speak Spanish at home 238 19.1% Speak English very well1,005 80.9% Speak English less than very well3.3% of residents speak other language at home 24 43.6% Speak English very well31 56.4% Speak English less than very well
White (Caucasian) - Speak only English Native:
95.0% (5,145)Foreign-born:
45.0% (76)
White (Caucasian) - Speak another language Native:
4.4% (237)Foreign-born:
55.8% (95)
American Indian / Alaska Native - Speak another language Native:
100.0% (99)Foreign-born:
100.0% (330)
Asian - Speak another language Native:
7.4% (4)Foreign-born:
99.6% (31)
Other race - Speak only English Native:
7.0% (63)Foreign-born:
10.5% (121)
Other race - Speak another language Native:
85.9% (777)Foreign-born:
89.1% (1,026)
Two or more races - Speak another language Native:
24.8% (274)Foreign-born:
100.0% (266)
White alone - Speak only English Native:
97.7% (5,119)Foreign-born:
60.3% (31)
White alone - Speak another language Native:
2.3% (118)Foreign-born:
41.3% (21)
Hispanic or Latino - Speak only English Native:
12.5% (179)Foreign-born:
11.8% (177)
Hispanic or Latino - Speak another language Native:
78.1% (1,115)Foreign-born:
89.1% (1,336)
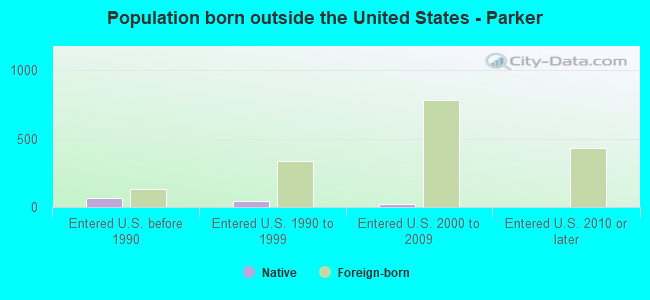
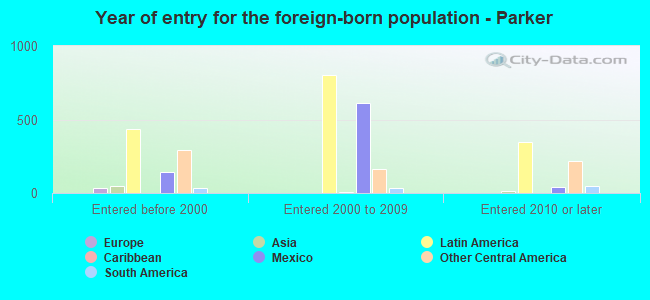
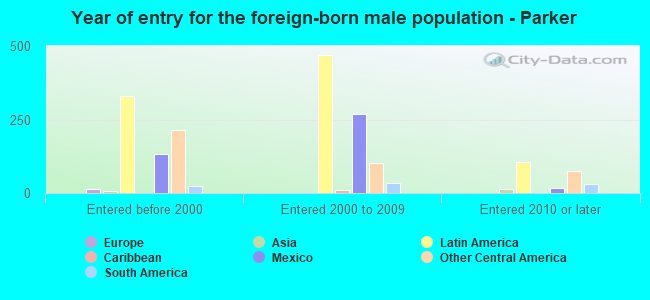
Foreign-born residents in Parker 1,839 residents are foreign born (13.9% Latin America ).
This city:
14.2%South Carolina:
5.3%
Marital status for residents in Parker Marital status - White (Caucasian) population 15 years and over
Males 49.6% Never married33.4% Now married3.0% Separated3.1% Widowed10.9% DivorcedFemales 32.6% Never married30.5% Now married2.1% Separated16.5% Widowed18.4% DivorcedWomen who gave birth in the past 12 months Now married:
65.9% (27)Unmarried:
34.1% (14)
Women who did not give birth in the past 12 months Now married:
32.1% (377)Unmarried:
67.9% (799)
Marital status - Black or African American population 15 years and over
Males 67.9% Never married20.7% Now married1.1% Separated1.6% Widowed8.7% DivorcedFemales 52.7% Never married20.2% Now married4.6% Separated5.2% Widowed17.2% DivorcedWomen who gave birth in the past 12 months Now married:
0.0% (0)Unmarried:
100.0% (15)
Women who did not give birth in the past 12 months Now married:
8.5% (54)Unmarried:
91.5% (582)
Marital status - American Indian / Alaska Native population 15 years and over
Males 0.9% Never married45.9% Now married53.2% Separated0.0% Widowed0.0% DivorcedFemales 0.9% Never married72.4% Now married0.0% Separated26.7% Widowed0.0% DivorcedWomen who did not give birth in the past 12 months Now married:
98.8% (115)Unmarried:
1.2% (1)
Marital status - Asian population 15 years and over
Males 42.9% Never married57.1% Now married0.0% Separated0.0% Widowed0.0% DivorcedFemales 61.2% Never married38.8% Now married0.0% Separated0.0% Widowed0.0% DivorcedWomen who did not give birth in the past 12 months Now married:
19.6% (11)Unmarried:
80.4% (45)
Marital status - Other race population 15 years and over
Males 71.4% Never married24.8% Now married1.0% Separated0.0% Widowed2.7% DivorcedFemales 75.8% Never married15.5% Now married1.2% Separated0.0% Widowed7.5% DivorcedWomen who gave birth in the past 12 months Now married:
0.0% (0)Unmarried:
100.0% (90)
Women who did not give birth in the past 12 months Now married:
18.5% (142)Unmarried:
81.5% (623)
Marital status - Two or more races population 15 years and over
Males 38.4% Never married60.5% Now married0.0% Separated0.0% Widowed1.1% DivorcedFemales 68.0% Never married28.3% Now married1.0% Separated1.4% Widowed1.4% DivorcedWomen who gave birth in the past 12 months Now married:
100.0% (45)Unmarried:
0.0% (0)
Women who did not give birth in the past 12 months Now married:
15.6% (72)Unmarried:
84.4% (391)
Marital status - White alone, not Hispanic / Latino population 15 years and over
Males 50.4% Never married31.9% Now married3.1% Separated3.3% Widowed11.3% DivorcedFemales 33.1% Never married28.9% Now married1.6% Separated17.3% Widowed19.1% DivorcedWomen who gave birth in the past 12 months Now married:
41.7% (10)Unmarried:
58.3% (14)
Women who did not give birth in the past 12 months Now married:
30.4% (347)Unmarried:
69.6% (793)
Marital status - Hispanic or Latino population 15 years and over
Males 54.8% Never married37.2% Now married6.1% Separated0.0% Widowed2.0% DivorcedFemales 56.0% Never married33.6% Now married2.1% Separated2.9% Widowed5.3% DivorcedWomen who gave birth in the past 12 months Now married:
39.5% (63)Unmarried:
60.5% (96)
Women who did not give birth in the past 12 months Now married:
33.8% (312)Unmarried:
66.2% (610)
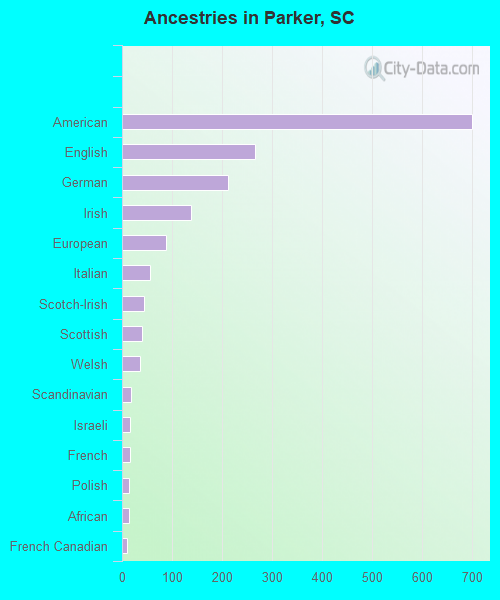
Ancestries in Parker
700 8.3% American267 3.2% English212 2.5% German138 1.6% Irish89 1.1% European56 0.7% Italian44 0.5% Scotch-Irish40 0.5% Scottish37 0.4% Welsh18 0.2% Scandinavian17 0.2% Israeli16 0.2% French14 0.2% Polish14 0.2% African10 0.1% French Canadian6 0.07% Hungarian3 0.04% British
Geographical mobility in Parker Same house 1 year ago 5,041 86.5% White (Caucasian)2,839 98.6% Black or African American474 100.0% American Indian / Alaska Native86 100.0% Asian24 100.0% Native Hawaiian / Pacific Islander2,046 91.4% Other race1,897 98.9% Two or more races4,682 85.4% White alone, not Hispanic / Latino3,082 92.8% Hispanic or LatinoMoved within same county 348 6.0% White / Caucasian71 2.5% Black or African American48 2.1% Other race7 0.4% Two or more races338 6.2% White alone, not Hispanic / Latino57 1.7% Hispanic or LatinoMoved within same state 184 3.2% White / Caucasian18 0.6% Black or African American188 3.4% White alone, not Hispanic / LatinoMoved from different state 143 2.5% White / Caucasian17 0.6% Black or African American148 6.6% Other race152 2.8% White alone, not Hispanic / Latino42 1.3% Hispanic or LatinoMoved from abroad 43 0.7% White27 1.2% Other race46 0.8% White alone, not Hispanic / Latino25 0.8% Hispanic or Latino
Children Nativity (place of birth) in Parker
Children under 6 years - Living with two parents Both parents native 213 100.0% NativeBoth parents foreign-born 315 100.0% NativeChildren under 6 years - Living with one parent Native parent 545 100.0% NativeForeign-born parent 94 54.5% Native78 45.5% Foreign-bornChildren 6 to 17 years - Living with two parents Both parents native 489 100.0% NativeBoth parents foreign-born 125 100.0% NativeOne native, one foreign-born parent 8 100.0% NativeChildren 6 to 17 years - Living with one parent Native parent 377 100.0% NativeForeign-born parent 422 54.2% Native356 45.8% Foreign-born
Grandparents responsible for own grandchildren in Parker
Grandparents (30 to 59 years) White / Caucasian 8 27.8% Responsible for grandchildren22 72.2% Not responsible for grandchildrenBlack or African American 43 100.0% Responsible for grandchildrenOther race 50 100.0% Responsible for grandchildrenTwo or more races 36 100.0% Responsible for grandchildrenWhite alone, not Hispanic / Latino 8 25.6% Responsible for grandchildren25 74.4% Not responsible for grandchildrenHispanic or Latino 30 100.0% Responsible for grandchildrenGrandparents (60 years and over) White / Caucasian 48 64.3% Responsible for grandchildren26 35.7% Not responsible for grandchildrenBlack or African American 31 100.0% Responsible for grandchildrenWhite alone, not Hispanic / Latino 49 64.5% Responsible for grandchildren27 35.5% Not responsible for grandchildren