Races in Park City, Utah (UT) Detailed Stats
Data:
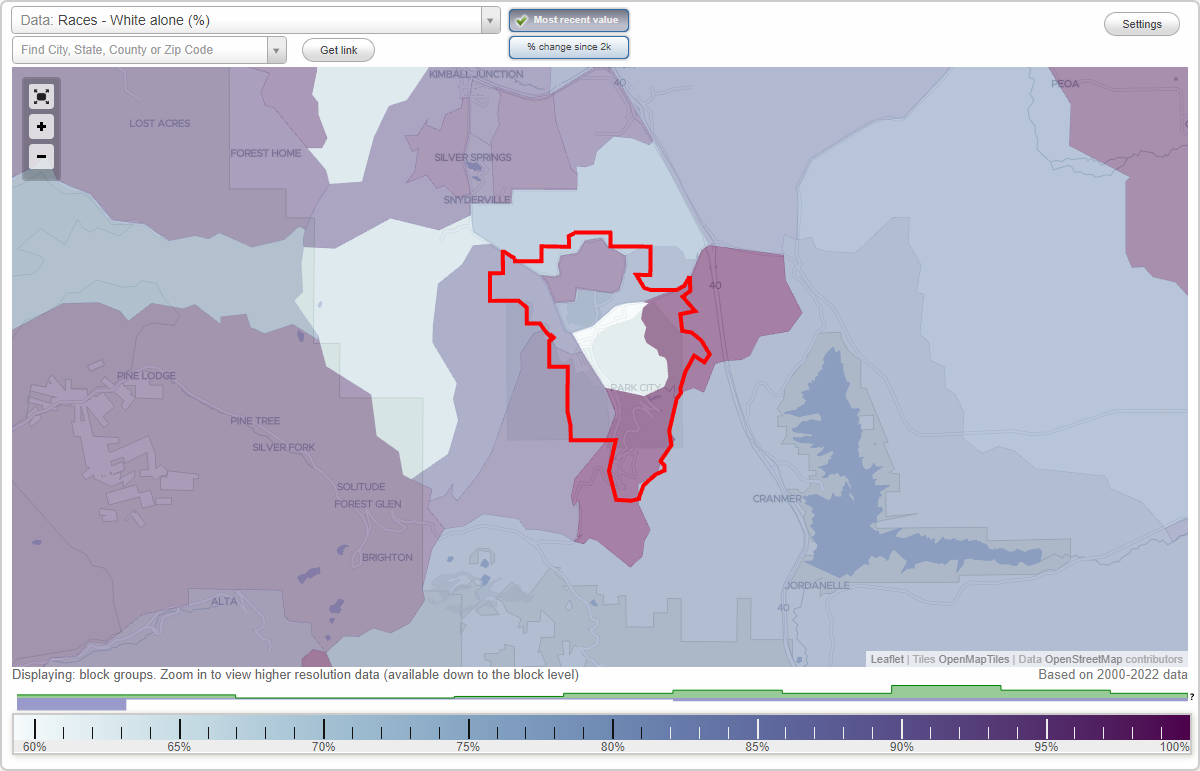
Races - White alone (%)
Races - White alone (% change since 2000)
Races - Black alone (%)
Races - Black alone (% change since 2000)
Races - American Indian alone (%)
Races - American Indian alone (% change since 2000)
Races - Asian alone (%)
Races - Asian alone (% change since 2000)
Races - Hispanic (%)
Races - Hispanic (% change since 2000)
Races - Native Hawaiian and Other Pacific Islander alone (%)
Races - Native Hawaiian and Other Pacific Islander alone (% change since 2000)
Races - Two or more races(%)
Races - Two or more races(% change since 2000)
Races - Other race alone (%)
Races - Other race alone (% change since 2000)
Racial diversity
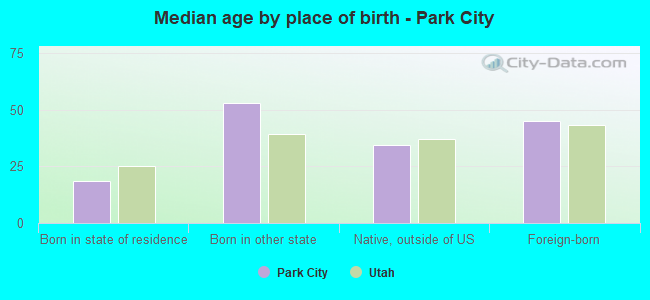
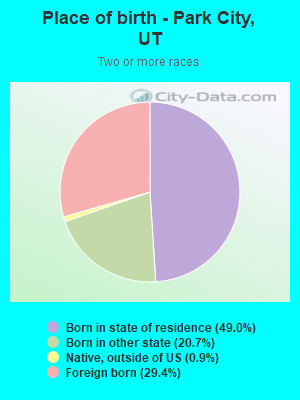
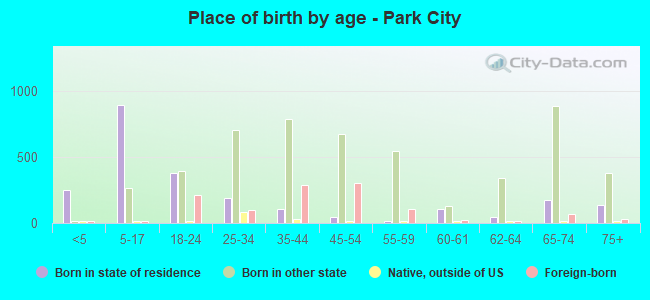
Place of birth - Born in state of residence (%)
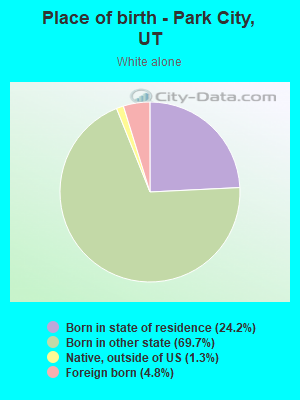
Place of birth - Born in state of residence (%) - White
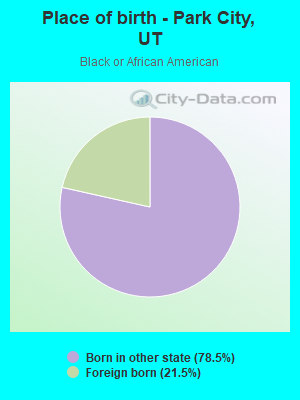
Place of birth - Born in state of residence (%) - Black or African American
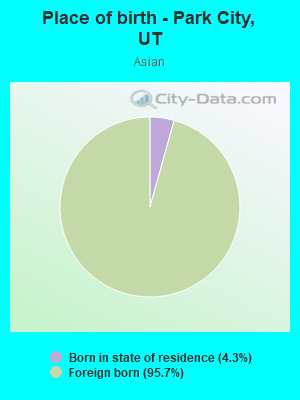
Place of birth - Born in state of residence (%) - Asian
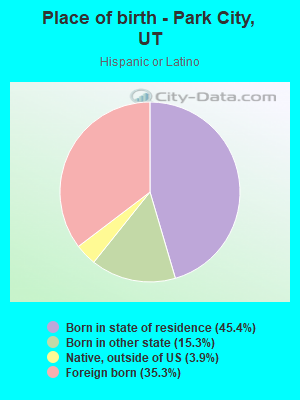
Place of birth - Born in state of residence (%) - Hispanic or Latino
Place of birth - Born in state of residence (%) - American Indian and Alaska Native
Place of birth - Born in state of residence (%) - Multirace
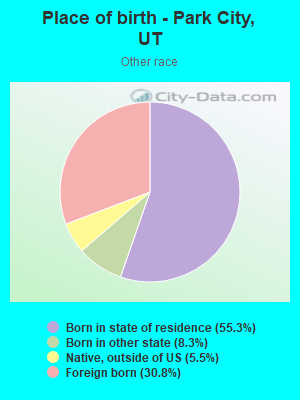
Place of birth - Born in state of residence (%) - Other Race
Place of birth - Born in other state (%)
Place of birth - Born in other state (%) - White
Place of birth - Born in other state (%) - Black or African American
Place of birth - Born in other state (%) - Asian
Place of birth - Born in other state (%) - Hispanic or Latino
Place of birth - Born in other state (%) - American Indian and Alaska Native
Place of birth - Born in other state (%) - Multirace
Place of birth - Born in other state (%) - Other Race
Place of birth - Native, outside of US (%)
Place of birth - Native, outside of US (%) - White
Place of birth - Native, outside of US (%) - Black or African American
Place of birth - Native, outside of US (%) - Asian
Place of birth - Native, outside of US (%) - Hispanic or Latino
Place of birth - Native, outside of US (%) - American Indian and Alaska Native
Place of birth - Native, outside of US (%) - Multirace
Place of birth - Native, outside of US (%) - Other Race
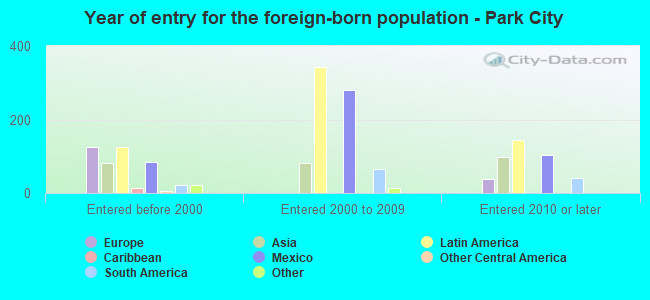
Place of birth - Foreign born (%)
Place of birth - Foreign born (%) - White
Place of birth - Foreign born (%) - Black or African American
Place of birth - Foreign born (%) - Asian
Place of birth - Foreign born (%) - Hispanic or Latino
Place of birth - Foreign born (%) - American Indian and Alaska Native
Place of birth - Foreign born (%) - Multirace
Place of birth - Foreign born (%) - Other Race
Residents speaking English at home (%)
Residents speaking English at home - Born in the United States (%)
Residents speaking English at home - Native, born elsewhere (%)
Residents speaking English at home - Foreign born (%)
Residents speaking Spanish at home (%)
Residents speaking Spanish at home - Born in the United States (%)
Residents speaking Spanish at home - Native, born elsewhere (%)
Residents speaking Spanish at home - Foreign born (%)
Residents speaking other language at home (%)
Residents speaking other language at home - Born in the United States (%)
Residents speaking other language at home - Native, born elsewhere (%)
Residents speaking other language at home - Foreign born (%)
Marital status - Never married (%)
Marital status - Now married (%)
Marital status - Separated (%)
Marital status - Widowed (%)
Marital status - Divorced (%)
Ancestries Reported - Arab (%)
Ancestries Reported - Czech (%)
Ancestries Reported - Danish (%)
Ancestries Reported - Dutch (%)
Ancestries Reported - English (%)
Ancestries Reported - French (%)
Ancestries Reported - French Canadian (%)
Ancestries Reported - German (%)
Ancestries Reported - Greek (%)
Ancestries Reported - Hungarian (%)
Ancestries Reported - Irish (%)
Ancestries Reported - Italian (%)
Ancestries Reported - Lithuanian (%)
Ancestries Reported - Norwegian (%)
Ancestries Reported - Polish (%)
Ancestries Reported - Portuguese (%)
Ancestries Reported - Russian (%)
Ancestries Reported - Scotch-Irish (%)
Ancestries Reported - Scottish (%)
Ancestries Reported - Slovak (%)
Ancestries Reported - Subsaharan African (%)
Ancestries Reported - Swedish (%)
Ancestries Reported - Swiss (%)
Ancestries Reported - Ukrainian (%)
Ancestries Reported - United States (%)
Ancestries Reported - Welsh (%)
Ancestries Reported - West Indian (%)
Ancestries Reported - Other (%)
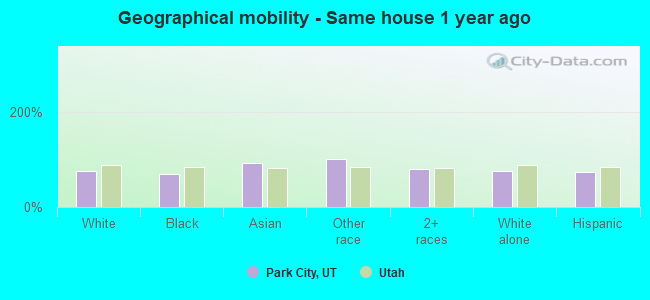
Geographical mobility - Same house 1 year ago (%)
Geographical mobility - Same house 1 year ago (%) - White
Geographical mobility - Same house 1 year ago (%) - Black or African American
Geographical mobility - Same house 1 year ago (%) - Asian
Geographical mobility - Same house 1 year ago (%) - Hispanic or Latino
Geographical mobility - Same house 1 year ago (%) - American Indian and Alaska Native
Geographical mobility - Same house 1 year ago (%) - Multirace
Geographical mobility - Same house 1 year ago (%) - Other Race
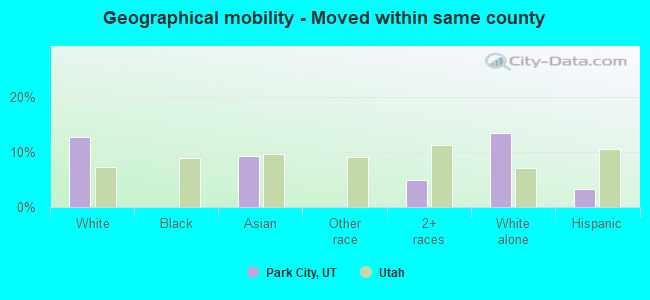
Geographical mobility - Moved within same county (%)
Geographical mobility - Moved within same county (%) - White
Geographical mobility - Moved within same county (%) - Black or African American
Geographical mobility - Moved within same county (%) - Asian
Geographical mobility - Moved within same county (%) - Hispanic or Latino
Geographical mobility - Moved within same county (%) - American Indian and Alaska Native
Geographical mobility - Moved within same county (%) - Multirace
Geographical mobility - Moved within same county (%) - Other Race
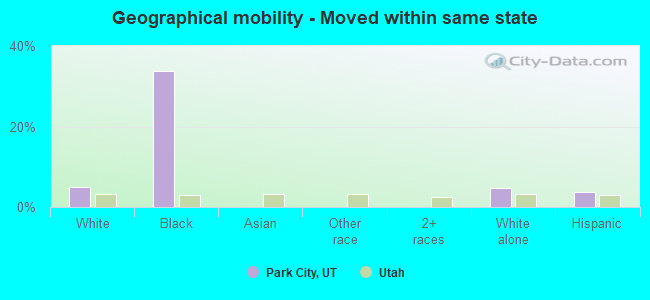
Geographical mobility - Moved from different county within same state (%)
Geographical mobility - Moved from different county within same state (%) - White
Geographical mobility - Moved from different county within same state (%) - Black or African American
Geographical mobility - Moved from different county within same state (%) - Asian
Geographical mobility - Moved from different county within same state (%) - Hispanic or Latino
Geographical mobility - Moved from different county within same state (%) - American Indian and Alaska Native
Geographical mobility - Moved from different county within same state (%) - Multirace
Geographical mobility - Moved from different county within same state (%) - Other Race
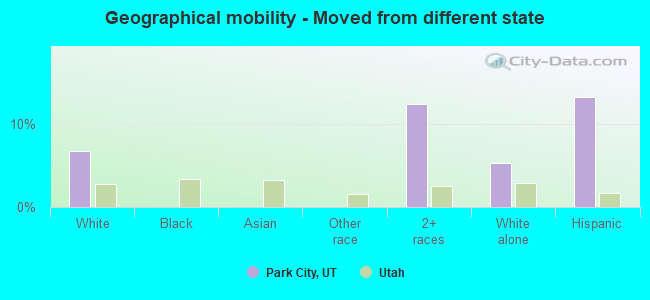
Geographical mobility - Moved from different state (%)
Geographical mobility - Moved from different state (%) - White
Geographical mobility - Moved from different state (%) - Black or African American
Geographical mobility - Moved from different state (%) - Asian
Geographical mobility - Moved from different state (%) - Hispanic or Latino
Geographical mobility - Moved from different state (%) - American Indian and Alaska Native
Geographical mobility - Moved from different state (%) - Multirace
Geographical mobility - Moved from different state (%) - Other Race
Geographical mobility - Moved from abroad (%)
Geographical mobility - Moved from abroad (%) - White
Geographical mobility - Moved from abroad (%) - Black or African American
Geographical mobility - Moved from abroad (%) - Asian
Geographical mobility - Moved from abroad (%) - Hispanic or Latino
Geographical mobility - Moved from abroad (%) - American Indian and Alaska Native
Geographical mobility - Moved from abroad (%) - Multirace
Geographical mobility - Moved from abroad (%) - Other Race
Place of birth for the foreign-born population - Ireland (%)
Place of birth for the foreign-born population - Denmark (%)
Place of birth for the foreign-born population - Norway (%)
Place of birth for the foreign-born population - Sweden (%)
Place of birth for the foreign-born population - United Kingdom (%)
Place of birth for the foreign-born population - England (%)
Place of birth for the foreign-born population - Scotland (%)
Place of birth for the foreign-born population - Other Northern Europe (%)
Place of birth for the foreign-born population - Austria (%)
Place of birth for the foreign-born population - Belgium (%)
Place of birth for the foreign-born population - France (%)
Place of birth for the foreign-born population - Germany (%)
Place of birth for the foreign-born population - Netherlands (%)
Place of birth for the foreign-born population - Switzerland (%)
Place of birth for the foreign-born population - Other Western Europe (%)
Place of birth for the foreign-born population - Greece (%)
Place of birth for the foreign-born population - Italy (%)
Place of birth for the foreign-born population - Portugal (%)
Place of birth for the foreign-born population - Spain (%)
Place of birth for the foreign-born population - Other Southern Europe (%)
Place of birth for the foreign-born population - Albania (%)
Place of birth for the foreign-born population - Belarus (%)
Place of birth for the foreign-born population - Bosnia and Herzegovina (%)
Place of birth for the foreign-born population - Bulgaria (%)
Place of birth for the foreign-born population - Croatia (%)
Place of birth for the foreign-born population - Czechoslovakia (%)
Place of birth for the foreign-born population - Hungary (%)
Place of birth for the foreign-born population - Latvia (%)
Place of birth for the foreign-born population - Lithuania (%)
Place of birth for the foreign-born population - North Macedonia (Macedonia) (%)
Place of birth for the foreign-born population - Moldova (%)
Place of birth for the foreign-born population - Poland (%)
Place of birth for the foreign-born population - Romania (%)
Place of birth for the foreign-born population - Russia (%)
Place of birth for the foreign-born population - Serbia (%)
Place of birth for the foreign-born population - Ukraine (%)
Place of birth for the foreign-born population - Other Eastern Europe (%)
Place of birth for the foreign-born population - China (%)
Place of birth for the foreign-born population - Hong Kong (%)
Place of birth for the foreign-born population - Taiwan (%)
Place of birth for the foreign-born population - Japan (%)
Place of birth for the foreign-born population - Korea (%)
Place of birth for the foreign-born population - Other Eastern Asia (%)
Place of birth for the foreign-born population - Afghanistan (%)
Place of birth for the foreign-born population - Bangladesh (%)
Place of birth for the foreign-born population - India (%)
Place of birth for the foreign-born population - Iran (%)
Place of birth for the foreign-born population - Kazakhstan (%)
Place of birth for the foreign-born population - Nepal (%)
Place of birth for the foreign-born population - Pakistan (%)
Place of birth for the foreign-born population - Sri Lanka (%)
Place of birth for the foreign-born population - Uzbekistan (%)
Place of birth for the foreign-born population - Other South Central Asia (%)
Place of birth for the foreign-born population - Burma (%)
Place of birth for the foreign-born population - Cambodia (%)
Place of birth for the foreign-born population - Indonesia (%)
Place of birth for the foreign-born population - Laos (%)
Place of birth for the foreign-born population - Malaysia (%)
Place of birth for the foreign-born population - Philippines (%)
Place of birth for the foreign-born population - Singapore (%)
Place of birth for the foreign-born population - Thailand (%)
Place of birth for the foreign-born population - Vietnam (%)
Place of birth for the foreign-born population - Other South Eastern Asia (%)
Place of birth for the foreign-born population - Armenia (%)
Place of birth for the foreign-born population - Iraq (%)
Place of birth for the foreign-born population - Israel (%)
Place of birth for the foreign-born population - Jordan (%)
Place of birth for the foreign-born population - Kuwait (%)
Place of birth for the foreign-born population - Lebanon (%)
Place of birth for the foreign-born population - Saudi Arabia (%)
Place of birth for the foreign-born population - Syria (%)
Place of birth for the foreign-born population - Turkey (%)
Place of birth for the foreign-born population - Yemen (%)
Place of birth for the foreign-born population - Other Western Asia (%)
Place of birth for the foreign-born population - Eritrea (%)
Place of birth for the foreign-born population - Ethiopia (%)
Place of birth for the foreign-born population - Kenya (%)
Place of birth for the foreign-born population - Somalia (%)
Place of birth for the foreign-born population - Uganda (%)
Place of birth for the foreign-born population - Zimbabwe (%)
Place of birth for the foreign-born population - Other Eastern Africa (%)
Place of birth for the foreign-born population - Cameroon (%)
Place of birth for the foreign-born population - Congo (%)
Place of birth for the foreign-born population - Democratic Republic of Congo (Zaire) (%)
Place of birth for the foreign-born population - Other Middle Africa (%)
Place of birth for the foreign-born population - Egypt (%)
Place of birth for the foreign-born population - Morocco (%)
Place of birth for the foreign-born population - Sudan (%)
Place of birth for the foreign-born population - Other Northern Africa (%)
Place of birth for the foreign-born population - South Africa (%)
Place of birth for the foreign-born population - Other Southern Africa (%)
Place of birth for the foreign-born population - Cabo Verde (%)
Place of birth for the foreign-born population - Ghana (%)
Place of birth for the foreign-born population - Liberia (%)
Place of birth for the foreign-born population - Nigeria (%)
Place of birth for the foreign-born population - Senegal (%)
Place of birth for the foreign-born population - Sierra Leone (%)
Place of birth for the foreign-born population - Other Western Africa (%)
Place of birth for the foreign-born population - Australia (%)
Place of birth for the foreign-born population - New Zealand (%)
Place of birth for the foreign-born population - Fiji (%)
Place of birth for the foreign-born population - Micronesia (%)
Place of birth for the foreign-born population - Bahamas (%)
Place of birth for the foreign-born population - Barbados (%)
Place of birth for the foreign-born population - Cuba (%)
Place of birth for the foreign-born population - Dominica (%)
Place of birth for the foreign-born population - Dominican Republic (%)
Place of birth for the foreign-born population - Grenada (%)
Place of birth for the foreign-born population - Haiti (%)
Place of birth for the foreign-born population - Jamaica (%)
Place of birth for the foreign-born population - St. Vincent and the Grenadines (%)
Place of birth for the foreign-born population - Trinidad and Tobago (%)
Place of birth for the foreign-born population - West Indies (%)
Place of birth for the foreign-born population - Other Caribbean (%)
Place of birth for the foreign-born population - Belize (%)
Place of birth for the foreign-born population - Costa Rica (%)
Place of birth for the foreign-born population - El Salvador (%)
Place of birth for the foreign-born population - Guatemala (%)
Place of birth for the foreign-born population - Honduras (%)
Place of birth for the foreign-born population - Mexico (%)
Place of birth for the foreign-born population - Nicaragua (%)
Place of birth for the foreign-born population - Panama (%)
Place of birth for the foreign-born population - Other Central America (%)
Place of birth for the foreign-born population - Argentina (%)
Place of birth for the foreign-born population - Bolivia (%)
Place of birth for the foreign-born population - Brazil (%)
Place of birth for the foreign-born population - Chile (%)
Place of birth for the foreign-born population - Colombia (%)
Place of birth for the foreign-born population - Ecuador (%)
Place of birth for the foreign-born population - Guyana (%)
Place of birth for the foreign-born population - Peru (%)
Place of birth for the foreign-born population - Uruguay (%)
Place of birth for the foreign-born population - Venezuela (%)
Place of birth for the foreign-born population - Other South America (%)
Place of birth for the foreign-born population - Canada (%)
Place of birth for the foreign-born population - Other Northern America (%)
Place of birth for the foreign-born population - Other (%)
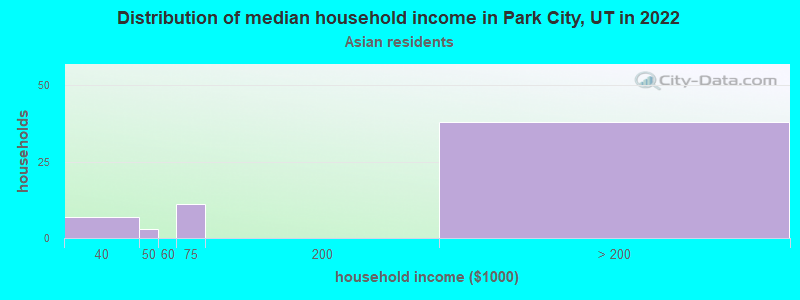
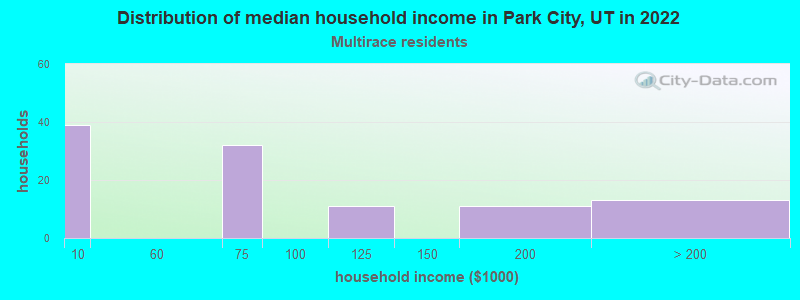
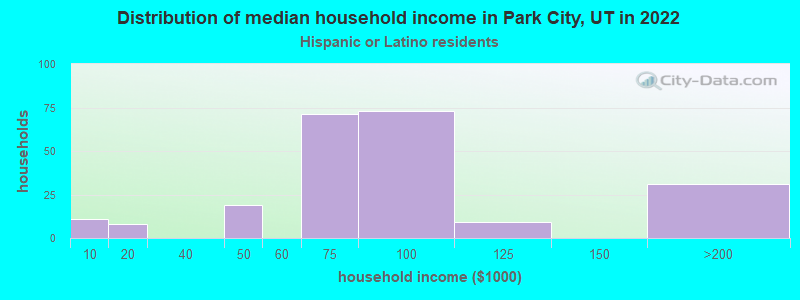
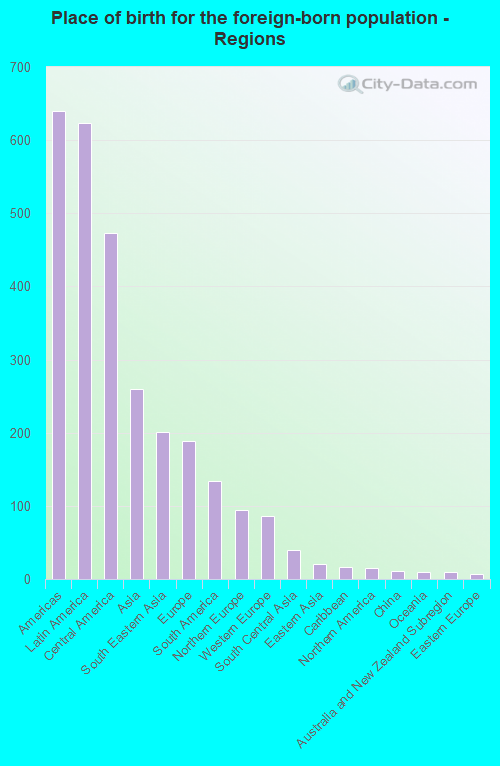
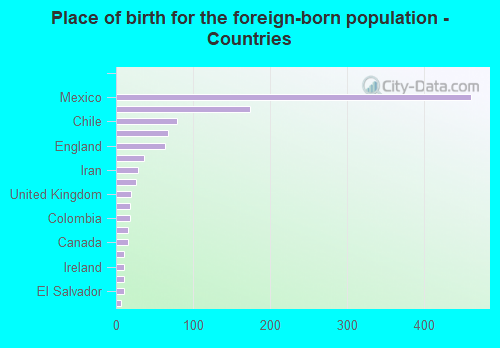
According to 2022 data, the most numerous races in Park City, UT are White alone (6,703 residents), Hispanic (1,364 residents), and Two or more races (174 residents). 78.8% of Park City residents speak English at home. 12.8% of Park City, UT residents are foreign-born (7.0% born in Latin America, 2.9% born in Asia, 2.1% born in Europe), which is 37.5% greater than the foreign-born rate of 8.0% across the entire state of Utah.
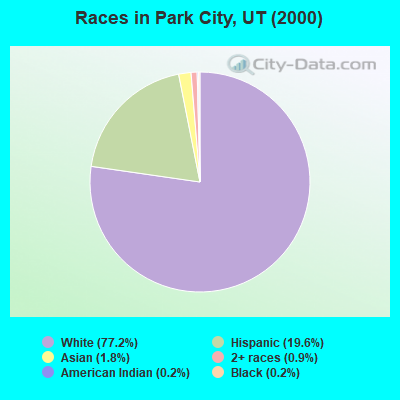
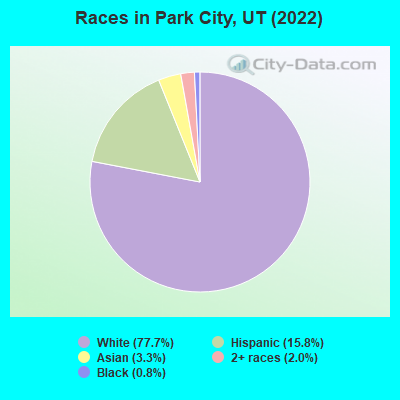
Race distribution in Park City
2000 2022
1,904,265 85.3% White alone 201,559 9.0% Hispanic 36,483 1.6% Asian alone 31,308 1.4% Two or more races 26,663 1.2% American Indian alone 14,806 0.7% Native Hawaiian and Other 16,137 0.7% Black alone 1,948 0.09% Other race alone
2,557,466 75.6% White alone 512,086 15.1% Hispanic 119,308 3.5% Two or more races 82,388 2.4% Asian alone 36,978 1.1% Native Hawaiian and Other 34,873 1.0% Black alone 22,803 0.7% American Indian alone 14,898 0.4% Other race alone
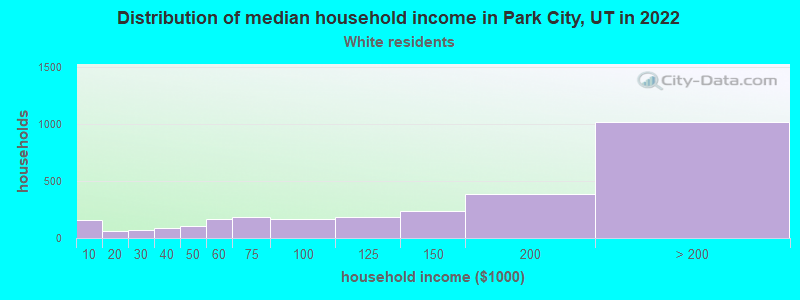
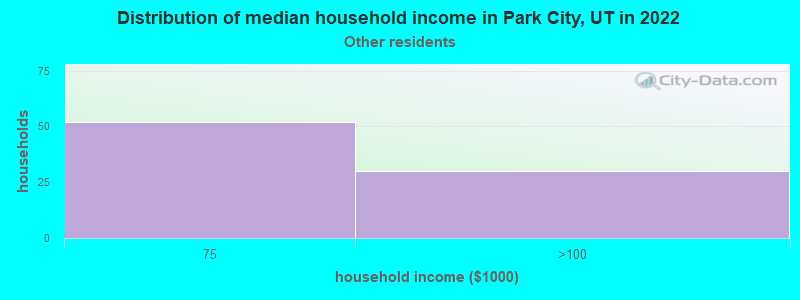
Income and house value in Park City Median household income in 2022 $146,274 White non-Hispanic householders$73,350 Some other race householders$74,640 Hispanic or Latino race householdersMedian 2022 house value over $1,000,000 White Non-Hispanic householders$622,303 Black or African American householdersover $1,000,000 Two or more races householdersover $1,000,000 Hispanic or Latino householders
Median age by race in Park City
47.4 Median age for White residents45.8 51.6 37.9 Median age for Black or African American residents-620,437,955.6 -686,357,242.6 -709,539,120.4 Median age for American Indian / Alaska Native residents-720,955,482.4 -694,006,308.5 30.6 Median age for Asian residents22.6 42.3 -664,268,584.5 Median age for Native Hawaiian / Pacific Islander residents-659,420,289.2 -664,285,713.6 22.6 Median age for Other race residents21.9 25.2 20.4 Median age for Two or more races residents12.4 33.4 48.4 Median age for White alone residents47.6 51.5 22.9 Median age for Hispanic or Latino residents20.7 25.7
Owner/renter occupied households by race in Park City
House owners and renters - White residents 2,193 79.9% Owner occupied552 20.1% Renter occupiedHouse owners and renters - Black or African American residents 25 100.0% Renter occupiedHouse owners and renters - Asian residents 12 18.8% Owner occupied51 81.2% Renter occupiedHouse owners and renters - Other race residents 78 100.0% Renter occupiedHouse owners and renters - Two or more races residents 69 63.2% Owner occupied40 36.8% Renter occupiedHouse owners and renters - White alone residents 2,204 81.9% Owner occupied487 18.1% Renter occupiedHouse owners and renters - Hispanic or Latino residents 30 13.6% Owner occupied189 86.4% Renter occupied
Language usage in Park City
English speakers - Total 78.8% of residents of Park City speak English at home.
16.1% of residents speak Spanish at home 1,043 77.1% Speak English very well309 22.9% Speak English less than very well4.8% of residents speak other language at home 380 93.6% Speak English very well26 6.4% Speak English less than very well
English speakers - Born in the United States 92.8% of residents of Park City speak English at home.
5.7% of residents speak Spanish at home 292 100.0% Speak English very well1.3% of residents speak other language at home 69 100.0% Speak English very well
English speakers - Native, born elsewhere 68.4% of residents of Park City speak English at home.
27.6% of residents speak Spanish at home 42 100.0% Speak English very well
English speakers - Foreign-born 18.7% of residents of Park City speak English at home.
50.3% of residents speak Spanish at home 263 47.4% Speak English very well292 52.6% Speak English less than very well29.5% of residents speak other language at home 300 92.0% Speak English very well26 8.0% Speak English less than very well
White (Caucasian) - Speak only English Native:
91.0% (5,854)Foreign-born:
31.9% (112)
White (Caucasian) - Speak another language Native:
8.2% (530)Foreign-born:
66.3% (232)
Black or African American - Speak only English Native:
91.5% (51)Foreign-born:
100.0% (14)
Asian - Speak only English Native:
90.5% (12)Foreign-born:
23.9% (66)
Other race - Speak another language Native:
25.5% (44)Foreign-born:
97.1% (124)
Two or more races - Speak another language Native:
40.6% (253)Foreign-born:
100.0% (269)
White alone - Speak only English Native:
93.4% (5,861)Foreign-born:
38.1% (123)
White alone - Speak another language Native:
6.6% (413)Foreign-born:
60.8% (196)
Hispanic or Latino - Speak another language Native:
57.8% (454)Foreign-born:
99.4% (477)
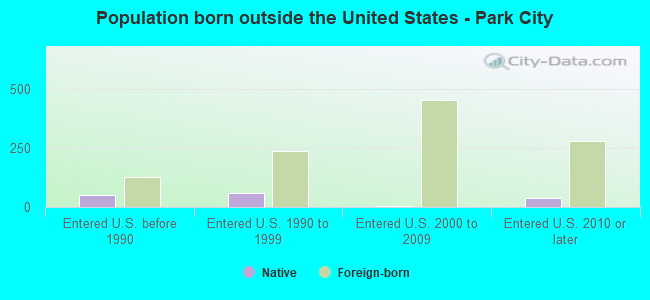
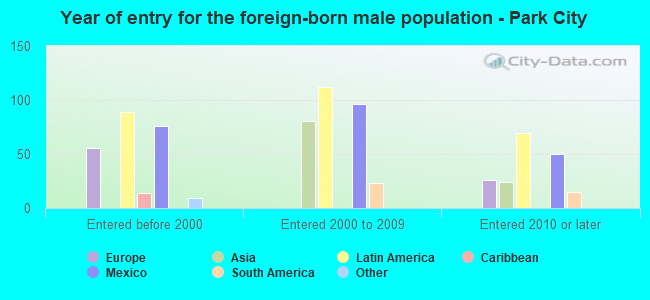
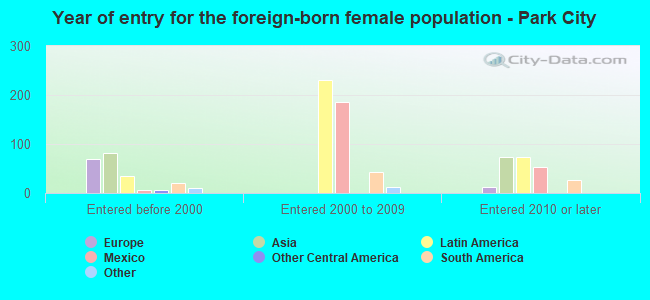
Foreign-born residents in Park City 1,105 residents are foreign born (7.0% Latin America , 2.9% Asia , 2.1% Europe ).
Marital status for residents in Park City Marital status - White (Caucasian) population 15 years and over
Males 34.3% Never married51.4% Now married0.4% Separated0.0% Widowed13.9% DivorcedFemales 30.0% Never married52.5% Now married0.0% Separated5.6% Widowed11.8% DivorcedWomen who gave birth in the past 12 months Now married:
100.0% (10)Unmarried:
0.0% (0)
Women who did not give birth in the past 12 months Now married:
27.0% (369)Unmarried:
73.0% (999)
Marital status - Black or African American population 15 years and over
Males 61.0% Never married39.0% Now married0.0% Separated0.0% Widowed0.0% DivorcedFemales 0.0% Never married0.0% Now married0.0% Separated0.0% Widowed100.0% DivorcedWomen who did not give birth in the past 12 months Now married:
0.0% (0)Unmarried:
100.0% (33)
Marital status - Asian population 15 years and over
Males 90.0% Never married3.8% Now married0.0% Separated0.0% Widowed6.2% DivorcedFemales 40.2% Never married34.8% Now married0.0% Separated25.0% Widowed0.0% DivorcedWomen who did not give birth in the past 12 months Now married:
28.3% (38)Unmarried:
71.7% (96)
Marital status - Other race population 15 years and over
Males 39.6% Never married60.4% Now married0.0% Separated0.0% Widowed0.0% DivorcedFemales 20.0% Never married33.6% Now married0.0% Separated0.0% Widowed46.4% DivorcedWomen who did not give birth in the past 12 months Now married:
37.5% (48)Unmarried:
62.5% (80)
Marital status - Two or more races population 15 years and over
Males 64.2% Never married35.8% Now married0.0% Separated0.0% Widowed0.0% DivorcedFemales 45.2% Never married12.4% Now married0.0% Separated0.0% Widowed42.4% DivorcedWomen who did not give birth in the past 12 months Now married:
13.2% (48)Unmarried:
86.8% (313)
Marital status - White alone, not Hispanic / Latino population 15 years and over
Males 33.1% Never married55.3% Now married0.5% Separated0.0% Widowed11.2% DivorcedFemales 27.9% Never married54.1% Now married0.0% Separated5.8% Widowed12.2% DivorcedWomen who gave birth in the past 12 months Now married:
100.0% (10)Unmarried:
0.0% (0)
Women who did not give birth in the past 12 months Now married:
28.9% (377)Unmarried:
71.1% (928)
Marital status - Hispanic or Latino population 15 years and over
Males 48.8% Never married21.3% Now married0.0% Separated0.0% Widowed30.0% DivorcedFemales 48.1% Never married15.5% Now married0.0% Separated0.0% Widowed36.4% DivorcedWomen who did not give birth in the past 12 months Now married:
15.3% (74)Unmarried:
84.7% (411)
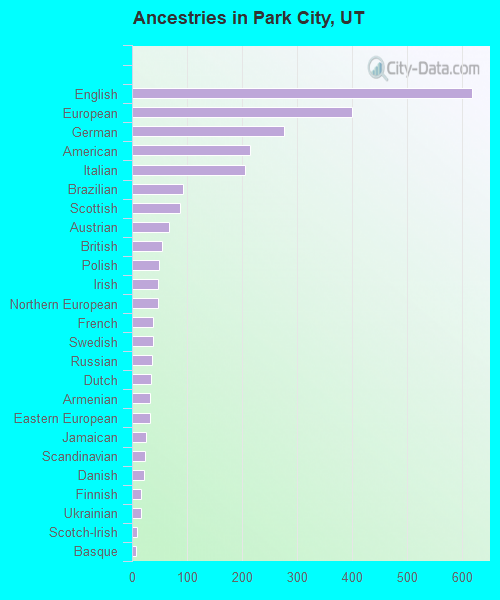
Ancestries in Park City
619 19.2% English401 12.5% European276 8.6% German215 6.7% American205 6.4% Italian92 2.9% Brazilian87 2.7% Scottish68 2.1% Austrian54 1.7% British49 1.5% Polish48 1.5% Irish47 1.5% Northern European39 1.2% French39 1.2% Swedish37 1.2% Russian35 1.1% Dutch33 1.0% Armenian32 1.0% Eastern European26 0.8% Jamaican24 0.7% Scandinavian22 0.7% Danish17 0.5% Finnish16 0.5% Ukrainian9 0.3% Scotch-Irish8 0.2% Basque8 0.2% Norwegian6 0.2% Hungarian
Children Nativity (place of birth) in Park City
Children under 6 years - Living with two parents Both parents native 120 100.0% NativeOne native, one foreign-born parent 71 100.0% NativeChildren 6 to 17 years - Living with two parents Both parents native 347 100.0% NativeBoth parents foreign-born 12 51.7% Native11 48.3% Foreign-bornOne native, one foreign-born parent 273 100.0% NativeChildren 6 to 17 years - Living with one parent Native parent 374 100.0% NativeForeign-born parent 148 50.7% Native144 49.3% Foreign-born
Grandparents responsible for own grandchildren in Park City
Grandparents (30 to 59 years) Asian 8 100.0% Responsible for grandchildren
Grandparents (60 years and over)