Races in Papillion, Nebraska (NE) Detailed Stats
Data:
Races - White alone (%)
Races - White alone (% change since 2000)
Races - Black alone (%)
Races - Black alone (% change since 2000)
Races - American Indian alone (%)
Races - American Indian alone (% change since 2000)
Races - Asian alone (%)
Races - Asian alone (% change since 2000)
Races - Hispanic (%)
Races - Hispanic (% change since 2000)
Races - Native Hawaiian and Other Pacific Islander alone (%)
Races - Native Hawaiian and Other Pacific Islander alone (% change since 2000)
Races - Two or more races(%)
Races - Two or more races(% change since 2000)
Races - Other race alone (%)
Races - Other race alone (% change since 2000)
Racial diversity
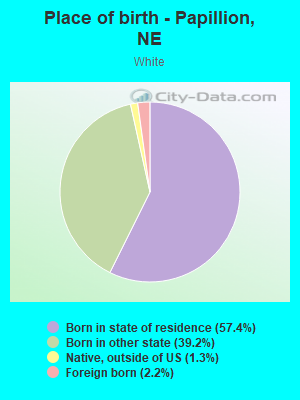
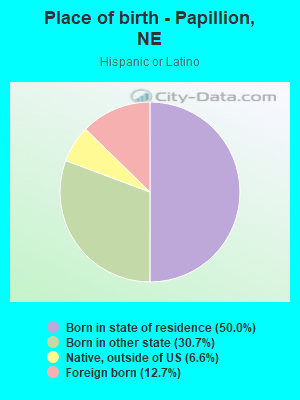
Place of birth - Born in state of residence (%)
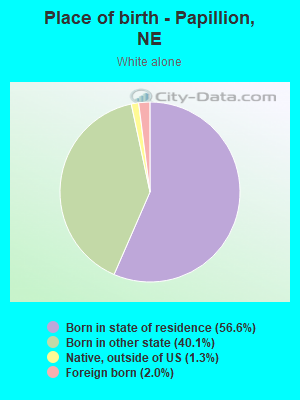
Place of birth - Born in state of residence (%) - White
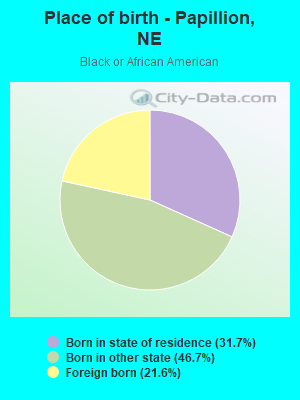
Place of birth - Born in state of residence (%) - Black or African American
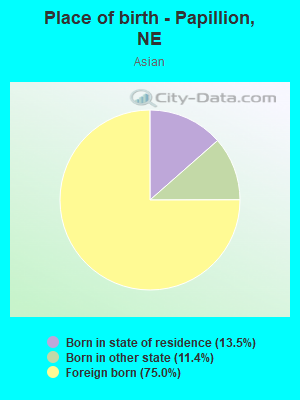
Place of birth - Born in state of residence (%) - Asian
Place of birth - Born in state of residence (%) - Hispanic or Latino
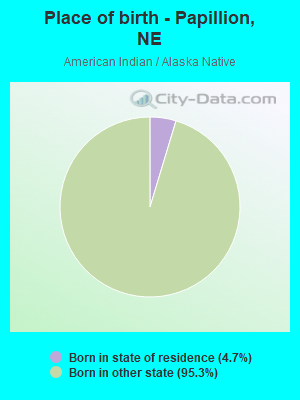
Place of birth - Born in state of residence (%) - American Indian and Alaska Native
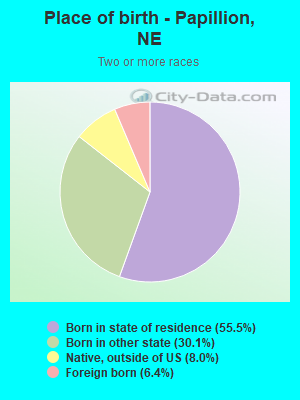
Place of birth - Born in state of residence (%) - Multirace
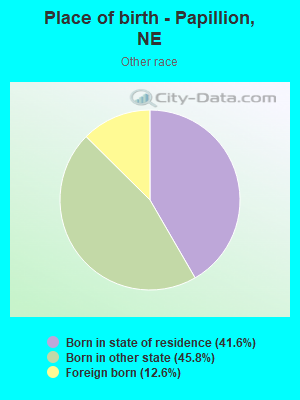
Place of birth - Born in state of residence (%) - Other Race
Place of birth - Born in other state (%)
Place of birth - Born in other state (%) - White
Place of birth - Born in other state (%) - Black or African American
Place of birth - Born in other state (%) - Asian
Place of birth - Born in other state (%) - Hispanic or Latino
Place of birth - Born in other state (%) - American Indian and Alaska Native
Place of birth - Born in other state (%) - Multirace
Place of birth - Born in other state (%) - Other Race
Place of birth - Native, outside of US (%)
Place of birth - Native, outside of US (%) - White
Place of birth - Native, outside of US (%) - Black or African American
Place of birth - Native, outside of US (%) - Asian
Place of birth - Native, outside of US (%) - Hispanic or Latino
Place of birth - Native, outside of US (%) - American Indian and Alaska Native
Place of birth - Native, outside of US (%) - Multirace
Place of birth - Native, outside of US (%) - Other Race
Place of birth - Foreign born (%)
Place of birth - Foreign born (%) - White
Place of birth - Foreign born (%) - Black or African American
Place of birth - Foreign born (%) - Asian
Place of birth - Foreign born (%) - Hispanic or Latino
Place of birth - Foreign born (%) - American Indian and Alaska Native
Place of birth - Foreign born (%) - Multirace
Place of birth - Foreign born (%) - Other Race
Residents speaking English at home (%)
Residents speaking English at home - Born in the United States (%)
Residents speaking English at home - Native, born elsewhere (%)
Residents speaking English at home - Foreign born (%)
Residents speaking Spanish at home (%)
Residents speaking Spanish at home - Born in the United States (%)
Residents speaking Spanish at home - Native, born elsewhere (%)
Residents speaking Spanish at home - Foreign born (%)
Residents speaking other language at home (%)
Residents speaking other language at home - Born in the United States (%)
Residents speaking other language at home - Native, born elsewhere (%)
Residents speaking other language at home - Foreign born (%)
Marital status - Never married (%)
Marital status - Now married (%)
Marital status - Separated (%)
Marital status - Widowed (%)
Marital status - Divorced (%)
Ancestries Reported - Arab (%)
Ancestries Reported - Czech (%)
Ancestries Reported - Danish (%)
Ancestries Reported - Dutch (%)
Ancestries Reported - English (%)
Ancestries Reported - French (%)
Ancestries Reported - French Canadian (%)
Ancestries Reported - German (%)
Ancestries Reported - Greek (%)
Ancestries Reported - Hungarian (%)
Ancestries Reported - Irish (%)
Ancestries Reported - Italian (%)
Ancestries Reported - Lithuanian (%)
Ancestries Reported - Norwegian (%)
Ancestries Reported - Polish (%)
Ancestries Reported - Portuguese (%)
Ancestries Reported - Russian (%)
Ancestries Reported - Scotch-Irish (%)
Ancestries Reported - Scottish (%)
Ancestries Reported - Slovak (%)
Ancestries Reported - Subsaharan African (%)
Ancestries Reported - Swedish (%)
Ancestries Reported - Swiss (%)
Ancestries Reported - Ukrainian (%)
Ancestries Reported - United States (%)
Ancestries Reported - Welsh (%)
Ancestries Reported - West Indian (%)
Ancestries Reported - Other (%)
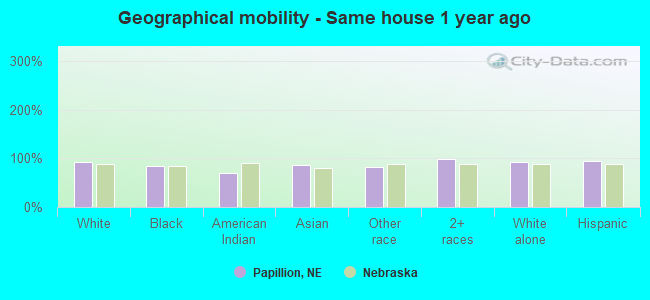
Geographical mobility - Same house 1 year ago (%)
Geographical mobility - Same house 1 year ago (%) - White
Geographical mobility - Same house 1 year ago (%) - Black or African American
Geographical mobility - Same house 1 year ago (%) - Asian
Geographical mobility - Same house 1 year ago (%) - Hispanic or Latino
Geographical mobility - Same house 1 year ago (%) - American Indian and Alaska Native
Geographical mobility - Same house 1 year ago (%) - Multirace
Geographical mobility - Same house 1 year ago (%) - Other Race
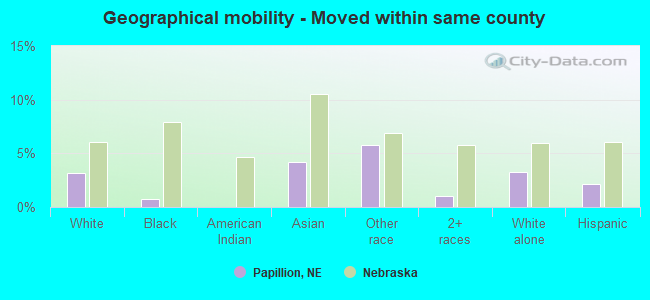
Geographical mobility - Moved within same county (%)
Geographical mobility - Moved within same county (%) - White
Geographical mobility - Moved within same county (%) - Black or African American
Geographical mobility - Moved within same county (%) - Asian
Geographical mobility - Moved within same county (%) - Hispanic or Latino
Geographical mobility - Moved within same county (%) - American Indian and Alaska Native
Geographical mobility - Moved within same county (%) - Multirace
Geographical mobility - Moved within same county (%) - Other Race
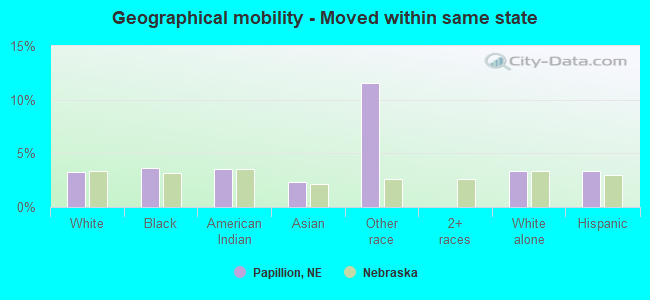
Geographical mobility - Moved from different county within same state (%)
Geographical mobility - Moved from different county within same state (%) - White
Geographical mobility - Moved from different county within same state (%) - Black or African American
Geographical mobility - Moved from different county within same state (%) - Asian
Geographical mobility - Moved from different county within same state (%) - Hispanic or Latino
Geographical mobility - Moved from different county within same state (%) - American Indian and Alaska Native
Geographical mobility - Moved from different county within same state (%) - Multirace
Geographical mobility - Moved from different county within same state (%) - Other Race
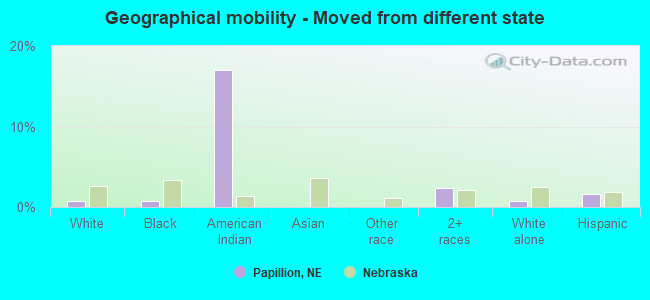
Geographical mobility - Moved from different state (%)
Geographical mobility - Moved from different state (%) - White
Geographical mobility - Moved from different state (%) - Black or African American
Geographical mobility - Moved from different state (%) - Asian
Geographical mobility - Moved from different state (%) - Hispanic or Latino
Geographical mobility - Moved from different state (%) - American Indian and Alaska Native
Geographical mobility - Moved from different state (%) - Multirace
Geographical mobility - Moved from different state (%) - Other Race
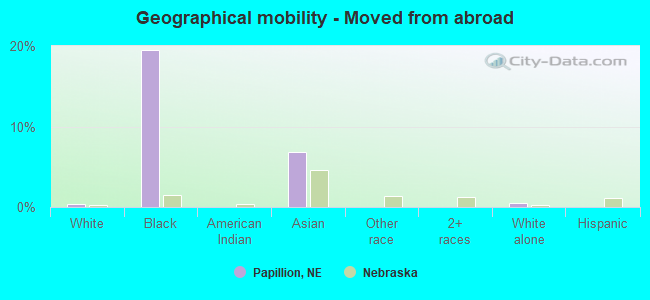
Geographical mobility - Moved from abroad (%)
Geographical mobility - Moved from abroad (%) - White
Geographical mobility - Moved from abroad (%) - Black or African American
Geographical mobility - Moved from abroad (%) - Asian
Geographical mobility - Moved from abroad (%) - Hispanic or Latino
Geographical mobility - Moved from abroad (%) - American Indian and Alaska Native
Geographical mobility - Moved from abroad (%) - Multirace
Geographical mobility - Moved from abroad (%) - Other Race
Place of birth for the foreign-born population - Ireland (%)
Place of birth for the foreign-born population - Denmark (%)
Place of birth for the foreign-born population - Norway (%)
Place of birth for the foreign-born population - Sweden (%)
Place of birth for the foreign-born population - United Kingdom (%)
Place of birth for the foreign-born population - England (%)
Place of birth for the foreign-born population - Scotland (%)
Place of birth for the foreign-born population - Other Northern Europe (%)
Place of birth for the foreign-born population - Austria (%)
Place of birth for the foreign-born population - Belgium (%)
Place of birth for the foreign-born population - France (%)
Place of birth for the foreign-born population - Germany (%)
Place of birth for the foreign-born population - Netherlands (%)
Place of birth for the foreign-born population - Switzerland (%)
Place of birth for the foreign-born population - Other Western Europe (%)
Place of birth for the foreign-born population - Greece (%)
Place of birth for the foreign-born population - Italy (%)
Place of birth for the foreign-born population - Portugal (%)
Place of birth for the foreign-born population - Spain (%)
Place of birth for the foreign-born population - Other Southern Europe (%)
Place of birth for the foreign-born population - Albania (%)
Place of birth for the foreign-born population - Belarus (%)
Place of birth for the foreign-born population - Bosnia and Herzegovina (%)
Place of birth for the foreign-born population - Bulgaria (%)
Place of birth for the foreign-born population - Croatia (%)
Place of birth for the foreign-born population - Czechoslovakia (%)
Place of birth for the foreign-born population - Hungary (%)
Place of birth for the foreign-born population - Latvia (%)
Place of birth for the foreign-born population - Lithuania (%)
Place of birth for the foreign-born population - North Macedonia (Macedonia) (%)
Place of birth for the foreign-born population - Moldova (%)
Place of birth for the foreign-born population - Poland (%)
Place of birth for the foreign-born population - Romania (%)
Place of birth for the foreign-born population - Russia (%)
Place of birth for the foreign-born population - Serbia (%)
Place of birth for the foreign-born population - Ukraine (%)
Place of birth for the foreign-born population - Other Eastern Europe (%)
Place of birth for the foreign-born population - China (%)
Place of birth for the foreign-born population - Hong Kong (%)
Place of birth for the foreign-born population - Taiwan (%)
Place of birth for the foreign-born population - Japan (%)
Place of birth for the foreign-born population - Korea (%)
Place of birth for the foreign-born population - Other Eastern Asia (%)
Place of birth for the foreign-born population - Afghanistan (%)
Place of birth for the foreign-born population - Bangladesh (%)
Place of birth for the foreign-born population - India (%)
Place of birth for the foreign-born population - Iran (%)
Place of birth for the foreign-born population - Kazakhstan (%)
Place of birth for the foreign-born population - Nepal (%)
Place of birth for the foreign-born population - Pakistan (%)
Place of birth for the foreign-born population - Sri Lanka (%)
Place of birth for the foreign-born population - Uzbekistan (%)
Place of birth for the foreign-born population - Other South Central Asia (%)
Place of birth for the foreign-born population - Burma (%)
Place of birth for the foreign-born population - Cambodia (%)
Place of birth for the foreign-born population - Indonesia (%)
Place of birth for the foreign-born population - Laos (%)
Place of birth for the foreign-born population - Malaysia (%)
Place of birth for the foreign-born population - Philippines (%)
Place of birth for the foreign-born population - Singapore (%)
Place of birth for the foreign-born population - Thailand (%)
Place of birth for the foreign-born population - Vietnam (%)
Place of birth for the foreign-born population - Other South Eastern Asia (%)
Place of birth for the foreign-born population - Armenia (%)
Place of birth for the foreign-born population - Iraq (%)
Place of birth for the foreign-born population - Israel (%)
Place of birth for the foreign-born population - Jordan (%)
Place of birth for the foreign-born population - Kuwait (%)
Place of birth for the foreign-born population - Lebanon (%)
Place of birth for the foreign-born population - Saudi Arabia (%)
Place of birth for the foreign-born population - Syria (%)
Place of birth for the foreign-born population - Turkey (%)
Place of birth for the foreign-born population - Yemen (%)
Place of birth for the foreign-born population - Other Western Asia (%)
Place of birth for the foreign-born population - Eritrea (%)
Place of birth for the foreign-born population - Ethiopia (%)
Place of birth for the foreign-born population - Kenya (%)
Place of birth for the foreign-born population - Somalia (%)
Place of birth for the foreign-born population - Uganda (%)
Place of birth for the foreign-born population - Zimbabwe (%)
Place of birth for the foreign-born population - Other Eastern Africa (%)
Place of birth for the foreign-born population - Cameroon (%)
Place of birth for the foreign-born population - Congo (%)
Place of birth for the foreign-born population - Democratic Republic of Congo (Zaire) (%)
Place of birth for the foreign-born population - Other Middle Africa (%)
Place of birth for the foreign-born population - Egypt (%)
Place of birth for the foreign-born population - Morocco (%)
Place of birth for the foreign-born population - Sudan (%)
Place of birth for the foreign-born population - Other Northern Africa (%)
Place of birth for the foreign-born population - South Africa (%)
Place of birth for the foreign-born population - Other Southern Africa (%)
Place of birth for the foreign-born population - Cabo Verde (%)
Place of birth for the foreign-born population - Ghana (%)
Place of birth for the foreign-born population - Liberia (%)
Place of birth for the foreign-born population - Nigeria (%)
Place of birth for the foreign-born population - Senegal (%)
Place of birth for the foreign-born population - Sierra Leone (%)
Place of birth for the foreign-born population - Other Western Africa (%)
Place of birth for the foreign-born population - Australia (%)
Place of birth for the foreign-born population - New Zealand (%)
Place of birth for the foreign-born population - Fiji (%)
Place of birth for the foreign-born population - Micronesia (%)
Place of birth for the foreign-born population - Bahamas (%)
Place of birth for the foreign-born population - Barbados (%)
Place of birth for the foreign-born population - Cuba (%)
Place of birth for the foreign-born population - Dominica (%)
Place of birth for the foreign-born population - Dominican Republic (%)
Place of birth for the foreign-born population - Grenada (%)
Place of birth for the foreign-born population - Haiti (%)
Place of birth for the foreign-born population - Jamaica (%)
Place of birth for the foreign-born population - St. Vincent and the Grenadines (%)
Place of birth for the foreign-born population - Trinidad and Tobago (%)
Place of birth for the foreign-born population - West Indies (%)
Place of birth for the foreign-born population - Other Caribbean (%)
Place of birth for the foreign-born population - Belize (%)
Place of birth for the foreign-born population - Costa Rica (%)
Place of birth for the foreign-born population - El Salvador (%)
Place of birth for the foreign-born population - Guatemala (%)
Place of birth for the foreign-born population - Honduras (%)
Place of birth for the foreign-born population - Mexico (%)
Place of birth for the foreign-born population - Nicaragua (%)
Place of birth for the foreign-born population - Panama (%)
Place of birth for the foreign-born population - Other Central America (%)
Place of birth for the foreign-born population - Argentina (%)
Place of birth for the foreign-born population - Bolivia (%)
Place of birth for the foreign-born population - Brazil (%)
Place of birth for the foreign-born population - Chile (%)
Place of birth for the foreign-born population - Colombia (%)
Place of birth for the foreign-born population - Ecuador (%)
Place of birth for the foreign-born population - Guyana (%)
Place of birth for the foreign-born population - Peru (%)
Place of birth for the foreign-born population - Uruguay (%)
Place of birth for the foreign-born population - Venezuela (%)
Place of birth for the foreign-born population - Other South America (%)
Place of birth for the foreign-born population - Canada (%)
Place of birth for the foreign-born population - Other Northern America (%)
Place of birth for the foreign-born population - Other (%)
Latest news about races in Papillion, NE collected exclusively by city-data.com from local newspapers, TV, and radio stations
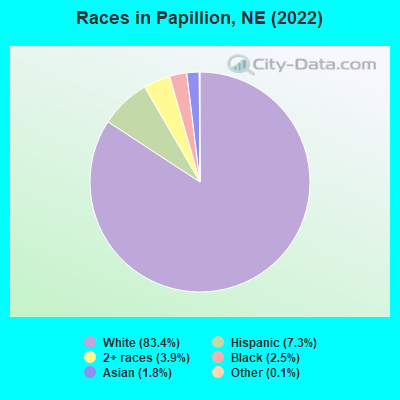
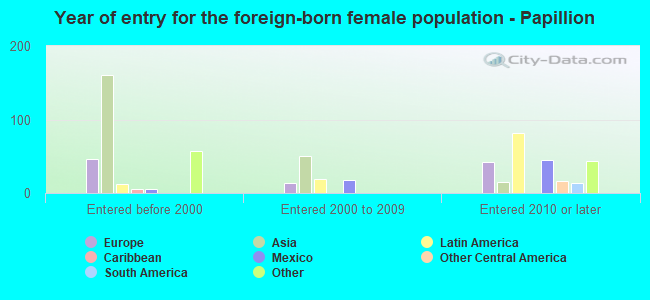
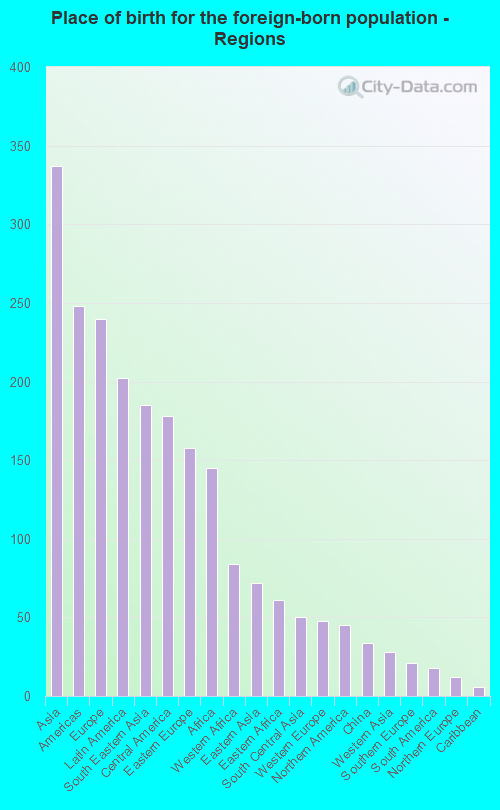
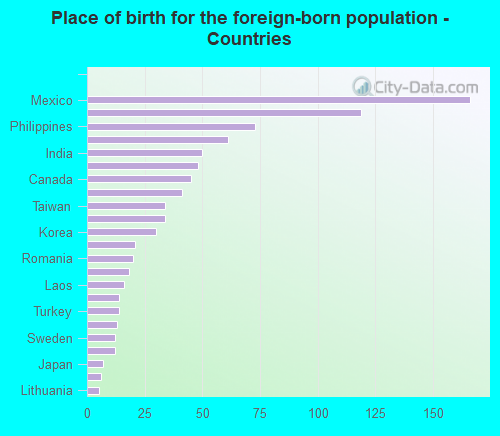
According to 2022 data, the most numerous races in Papillion, NE are White alone (20,581 residents), Hispanic (1,807 residents), and Black alone (606 residents). 94.4% of Papillion residents speak English at home. 3.9% of Papillion, NE residents are foreign-born (1.4% born in Asia, 1.0% born in Europe, 0.8% born in Latin America, 0.6% born in Africa), which is 77.7% less than the foreign-born rate of 7.0% across the entire state of Nebraska.
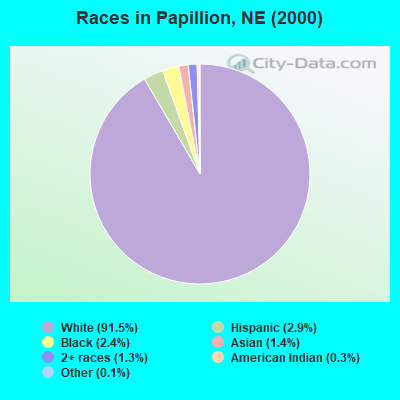
Race distribution in Papillion
2000 2022
1,494,494 87.3% White alone 94,425 5.5% Hispanic 67,537 3.9% Black alone 21,677 1.3% Asian alone 17,696 1.0% Two or more races 13,460 0.8% American Indian alone 1,327 0.08% Other race alone 647 0.04% Native Hawaiian and Other
1,492,005 75.8% White alone 241,898 12.3% Hispanic 89,520 4.5% Black alone 76,499 3.9% Two or more races 49,261 2.5% Asian alone 10,249 0.5% American Indian alone 7,425 0.4% Other race alone 1,066 0.05% Native Hawaiian and Other
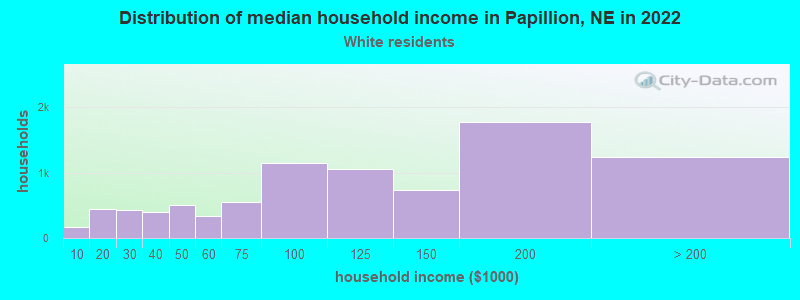
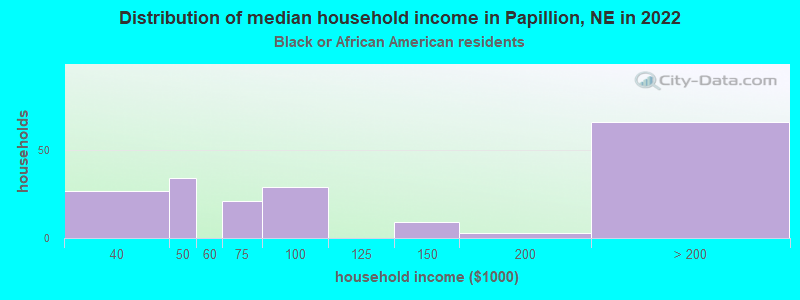
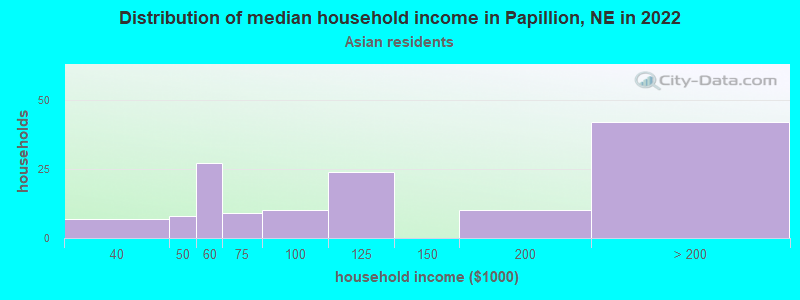
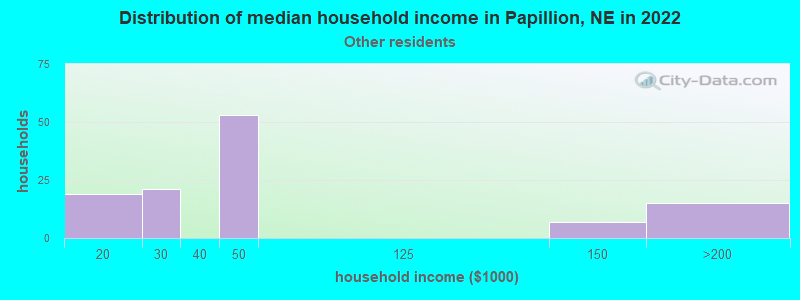
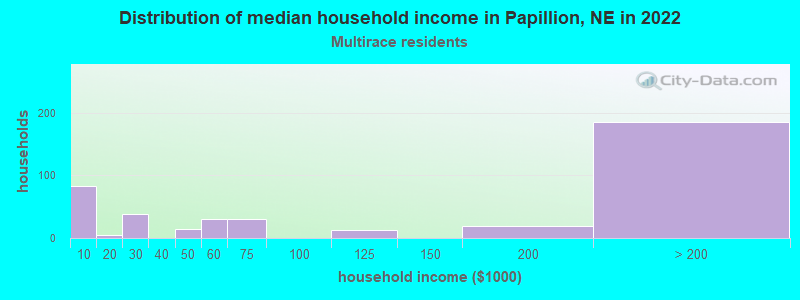
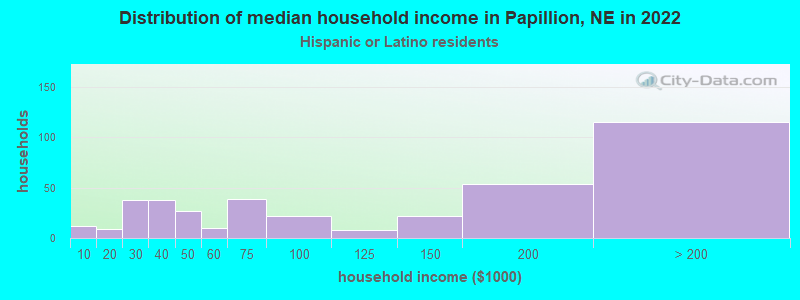
Income and house value in Papillion Median household income in 2022 $108,105 White non-Hispanic householders$66,439 Black householders$41,284 Some other race householdersMedian 2022 house value $303,257 White Non-Hispanic householders$267,833 Black or African American householders$227,383 American Indian or Alaska Native householders $316,182 Asian householders$269,269 Some other race householders$217,809 Two or more races householders$264,003 Hispanic or Latino householders
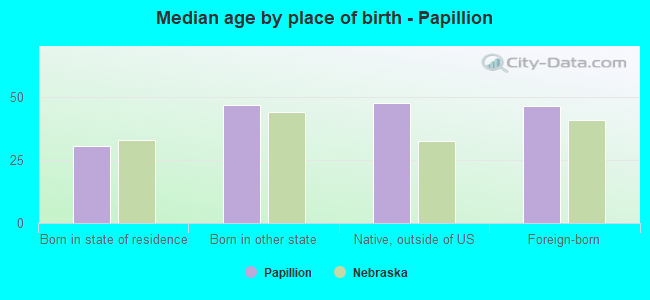
Median age by race in Papillion
43.7 Median age for White residents40.9 45.6 35.6 Median age for Black or African American residents34.0 52.4 23.0 Median age for American Indian / Alaska Native residents43.9 20.7 42.8 Median age for Asian residents54.5 40.1 -699,999,999.3 Median age for Native Hawaiian / Pacific Islander residents-672,108,842.9 -689,223,057.0 20.8 Median age for Other race residents18.0 24.0 24.5 Median age for Two or more races residents24.0 14.4 44.3 Median age for White alone residents42.6 45.5 24.1 Median age for Hispanic or Latino residents22.3 28.5
Owner/renter occupied households by race in Papillion
House owners and renters - White residents 6,397 73.2% Owner occupied2,345 26.8% Renter occupiedHouse owners and renters - Black or African American residents 60 39.1% Owner occupied93 60.9% Renter occupiedHouse owners and renters - American Indian / Alaska Native residents 16 100.0% Owner occupiedHouse owners and renters - Asian residents 125 68.7% Owner occupied57 31.3% Renter occupiedHouse owners and renters - Other race residents 18 18.8% Owner occupied79 81.2% Renter occupiedHouse owners and renters - Two or more races residents 283 68.0% Owner occupied133 32.0% Renter occupiedHouse owners and renters - White alone residents 6,329 72.2% Owner occupied2,435 27.8% Renter occupiedHouse owners and renters - Hispanic or Latino residents 294 74.0% Owner occupied104 26.0% Renter occupied
Language usage in Papillion
English speakers - Total 94.4% of residents of Papillion speak English at home.
2.1% of residents speak Spanish at home 324 65.3% Speak English very well172 34.7% Speak English less than very well3.5% of residents speak other language at home 677 82.7% Speak English very well142 17.3% Speak English less than very well
English speakers - Born in the United States 98.0% of residents of Papillion speak English at home.
0.9% of residents speak Spanish at home 81 93.1% Speak English very well6 6.9% Speak English less than very well1.2% of residents speak other language at home 106 91.4% Speak English very well10 8.6% Speak English less than very well
English speakers - Native, born elsewhere 87.4% of residents of Papillion speak English at home.
3.5% of residents speak Spanish at home 17 100.0% Speak English very well1.4% of residents speak other language at home 7 100.0% Speak English less than very well
English speakers - Foreign-born 19.3% of residents of Papillion speak English at home.
23.8% of residents speak Spanish at home 120 46.5% Speak English very well138 53.5% Speak English less than very well56.4% of residents speak other language at home 489 79.9% Speak English very well123 20.1% Speak English less than very well
White (Caucasian) - Speak only English Native:
99.6% (19,694)Foreign-born:
38.5% (176)
White (Caucasian) - Speak another language Native:
0.7% (140)Foreign-born:
59.5% (272)
Black or African American - Speak another language Native:
1.4% (6)Foreign-born:
94.2% (120)
Asian - Speak only English Native:
26.5% (40)Foreign-born:
7.7% (21)
Asian - Speak another language Native:
63.0% (94)Foreign-born:
100.0% (279)
Other race - Speak another language Native:
17.2% (59)Foreign-born:
100.0% (42)
Two or more races - Speak only English Native:
86.9% (1,024)Foreign-born:
16.9% (17)
Two or more races - Speak another language Native:
13.1% (154)Foreign-born:
76.4% (77)
White alone - Speak only English Native:
99.4% (19,133)Foreign-born:
39.5% (162)
White alone - Speak another language Native:
0.6% (118)Foreign-born:
60.5% (248)
Hispanic or Latino - Speak only English Native:
91.6% (1,327)Foreign-born:
2.5% (6)
Hispanic or Latino - Speak another language Native:
12.8% (185)Foreign-born:
97.4% (220)
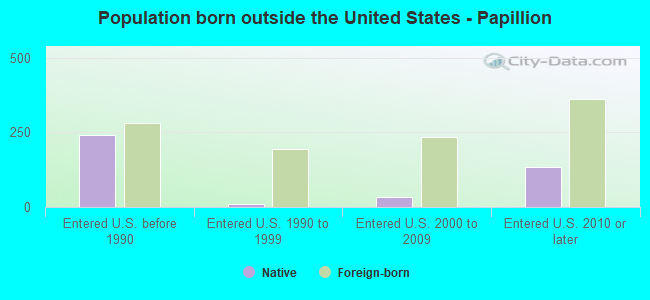
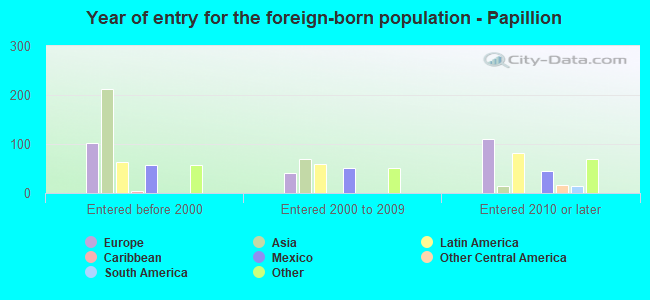
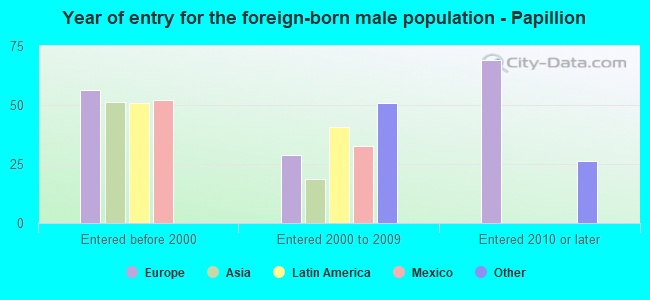
Foreign-born residents in Papillion 972 residents are foreign born (1.4% Asia , 1.0% Europe , 0.8% Latin America , 0.6% Africa ).
This city:
3.9%Nebraska:
7.5%
Marital status for residents in Papillion Marital status - White (Caucasian) population 15 years and over
Males 27.4% Never married63.1% Now married0.1% Separated2.3% Widowed7.2% DivorcedFemales 22.3% Never married55.0% Now married0.6% Separated8.9% Widowed13.2% DivorcedWomen who gave birth in the past 12 months Now married:
95.1% (131)Unmarried:
4.9% (7)
Women who did not give birth in the past 12 months Now married:
54.1% (2,334)Unmarried:
45.9% (1,980)
Marital status - Black or African American population 15 years and over
Males 25.1% Never married64.7% Now married5.2% Separated0.0% Widowed5.0% DivorcedFemales 24.1% Never married72.3% Now married3.7% Separated0.0% Widowed0.0% DivorcedWomen who did not give birth in the past 12 months Now married:
61.7% (72)Unmarried:
38.3% (45)
Marital status - American Indian / Alaska Native population 15 years and over
Males 45.7% Never married42.9% Now married0.0% Separated11.4% Widowed0.0% DivorcedFemales 50.0% Never married50.0% Now married0.0% Separated0.0% Widowed0.0% DivorcedWomen who did not give birth in the past 12 months Now married:
44.0% (12)Unmarried:
56.0% (16)
Marital status - Asian population 15 years and over
Males 30.3% Never married52.1% Now married0.0% Separated10.9% Widowed6.7% DivorcedFemales 37.1% Never married57.8% Now married0.0% Separated0.0% Widowed5.2% DivorcedWomen who did not give birth in the past 12 months Now married:
49.1% (86)Unmarried:
50.9% (89)
Marital status - Other race population 15 years and over
Males 66.4% Never married33.6% Now married0.0% Separated0.0% Widowed0.0% DivorcedFemales 37.9% Never married62.1% Now married0.0% Separated0.0% Widowed0.0% DivorcedWomen who did not give birth in the past 12 months Now married:
56.5% (74)Unmarried:
43.5% (57)
Marital status - Two or more races population 15 years and over
Males 41.8% Never married48.0% Now married0.0% Separated0.0% Widowed10.1% DivorcedFemales 9.7% Never married61.5% Now married8.4% Separated4.4% Widowed15.9% DivorcedWomen who gave birth in the past 12 months Now married:
100.0% (46)Unmarried:
0.0% (0)
Women who did not give birth in the past 12 months Now married:
66.3% (86)Unmarried:
33.7% (44)
Marital status - White alone, not Hispanic / Latino population 15 years and over
Males 26.4% Never married63.7% Now married0.1% Separated2.4% Widowed7.5% DivorcedFemales 22.5% Never married55.1% Now married0.2% Separated9.2% Widowed13.0% DivorcedWomen who gave birth in the past 12 months Now married:
95.1% (135)Unmarried:
4.9% (7)
Women who did not give birth in the past 12 months Now married:
54.1% (2,348)Unmarried:
45.9% (1,990)
Marital status - Hispanic or Latino population 15 years and over
Males 54.2% Never married45.8% Now married0.0% Separated0.0% Widowed0.0% DivorcedFemales 18.4% Never married56.7% Now married12.7% Separated2.0% Widowed10.2% DivorcedWomen who did not give birth in the past 12 months Now married:
62.2% (190)Unmarried:
37.8% (115)
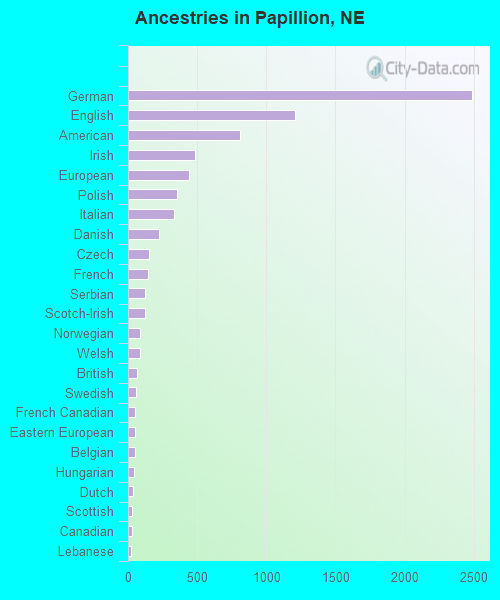
Ancestries in Papillion
2,486 25.7% German1,205 12.5% English813 8.4% American487 5.0% Irish438 4.5% European357 3.7% Polish333 3.4% Italian227 2.3% Danish155 1.6% Czech144 1.5% French123 1.3% Serbian121 1.3% Scotch-Irish87 0.9% Norwegian85 0.9% Welsh63 0.7% British60 0.6% Swedish51 0.5% French Canadian50 0.5% Eastern European48 0.5% Belgian42 0.4% Hungarian36 0.4% Dutch26 0.3% Scottish26 0.3% Canadian24 0.2% Lebanese22 0.2% Portuguese20 0.2% Northern European14 0.1% Scandinavian13 0.1% Pennsylvania German12 0.1% Luxembourger9 0.09% Austrian7 0.07% Russian7 0.07% Armenian7 0.07% Swiss6 0.06% Greek5 0.05% Croatian5 0.05% Slovak5 0.05% Lithuanian1 0.01% Romanian
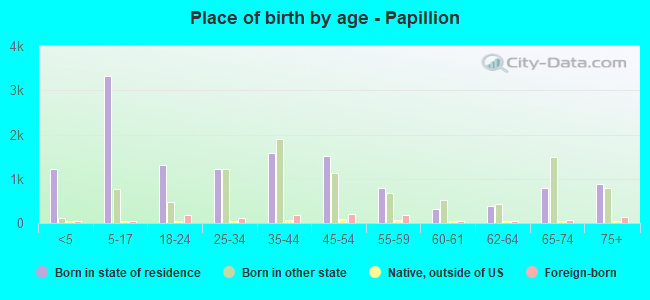
Children Nativity (place of birth) in Papillion
Children under 6 years - Living with two parents Both parents native 1,266 100.0% NativeBoth parents foreign-born 64 100.0% NativeOne native, one foreign-born parent 60 100.0% NativeChildren under 6 years - Living with one parent Native parent 155 100.0% NativeChildren 6 to 17 years - Living with two parents Both parents native 3,083 100.0% NativeBoth parents foreign-born 42 53.8% Native36 46.2% Foreign-bornOne native, one foreign-born parent 46 100.0% NativeChildren 6 to 17 years - Living with one parent Native parent 693 100.0% NativeForeign-born parent 36 48.9% Native38 51.1% Foreign-born
Grandparents responsible for own grandchildren in Papillion
Grandparents (30 to 59 years) White / Caucasian 50 41.7% Responsible for grandchildren70 58.3% Not responsible for grandchildrenAsian 39 100.0% Responsible for grandchildrenWhite alone, not Hispanic / Latino 50 55.0% Responsible for grandchildren41 45.0% Not responsible for grandchildren
Grandparents (60 years and over) White / Caucasian 7 2.9% Responsible for grandchildren239 97.1% Not responsible for grandchildrenAsian 6 100.0% Not responsible for grandchildrenWhite alone, not Hispanic / Latino 7 3.5% Responsible for grandchildren197 96.5% Not responsible for grandchildren