Races in Owensboro, Kentucky (KY) Detailed Stats
Data:
Races - White alone (%)
Races - White alone (% change since 2000)
Races - Black alone (%)
Races - Black alone (% change since 2000)
Races - American Indian alone (%)
Races - American Indian alone (% change since 2000)
Races - Asian alone (%)
Races - Asian alone (% change since 2000)
Races - Hispanic (%)
Races - Hispanic (% change since 2000)
Races - Native Hawaiian and Other Pacific Islander alone (%)
Races - Native Hawaiian and Other Pacific Islander alone (% change since 2000)
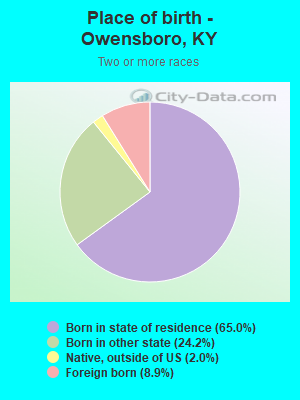
Races - Two or more races(%)
Races - Two or more races(% change since 2000)
Races - Other race alone (%)
Races - Other race alone (% change since 2000)
Racial diversity
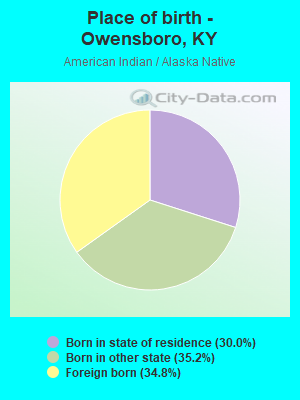
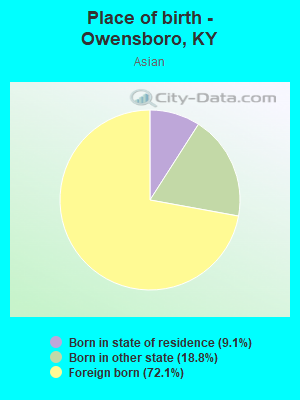
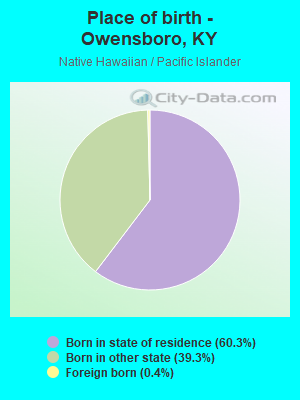
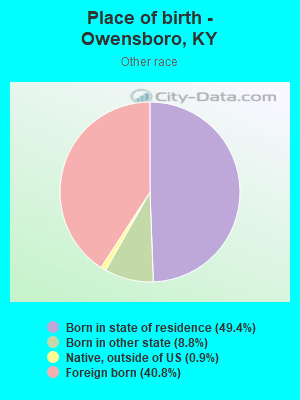
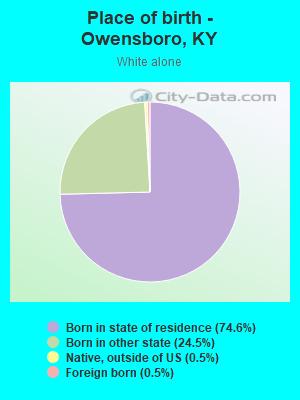
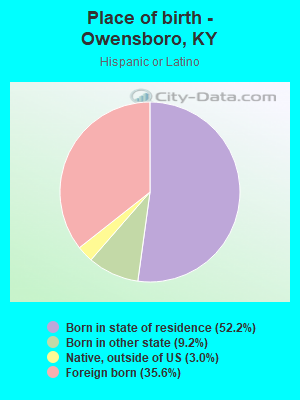
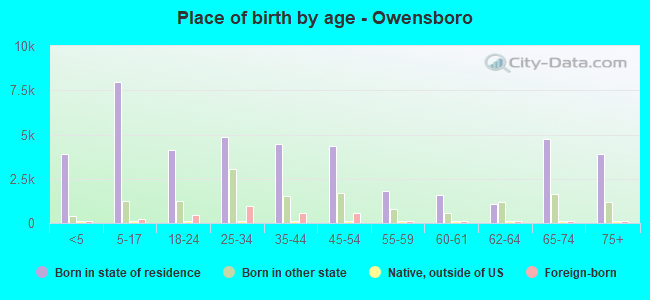
Place of birth - Born in state of residence (%)
Place of birth - Born in state of residence (%) - White
Place of birth - Born in state of residence (%) - Black or African American
Place of birth - Born in state of residence (%) - Asian
Place of birth - Born in state of residence (%) - Hispanic or Latino
Place of birth - Born in state of residence (%) - American Indian and Alaska Native
Place of birth - Born in state of residence (%) - Multirace
Place of birth - Born in state of residence (%) - Other Race
Place of birth - Born in other state (%)
Place of birth - Born in other state (%) - White
Place of birth - Born in other state (%) - Black or African American
Place of birth - Born in other state (%) - Asian
Place of birth - Born in other state (%) - Hispanic or Latino
Place of birth - Born in other state (%) - American Indian and Alaska Native
Place of birth - Born in other state (%) - Multirace
Place of birth - Born in other state (%) - Other Race
Place of birth - Native, outside of US (%)
Place of birth - Native, outside of US (%) - White
Place of birth - Native, outside of US (%) - Black or African American
Place of birth - Native, outside of US (%) - Asian
Place of birth - Native, outside of US (%) - Hispanic or Latino
Place of birth - Native, outside of US (%) - American Indian and Alaska Native
Place of birth - Native, outside of US (%) - Multirace
Place of birth - Native, outside of US (%) - Other Race
Place of birth - Foreign born (%)
Place of birth - Foreign born (%) - White
Place of birth - Foreign born (%) - Black or African American
Place of birth - Foreign born (%) - Asian
Place of birth - Foreign born (%) - Hispanic or Latino
Place of birth - Foreign born (%) - American Indian and Alaska Native
Place of birth - Foreign born (%) - Multirace
Place of birth - Foreign born (%) - Other Race
Residents speaking English at home (%)
Residents speaking English at home - Born in the United States (%)
Residents speaking English at home - Native, born elsewhere (%)
Residents speaking English at home - Foreign born (%)
Residents speaking Spanish at home (%)
Residents speaking Spanish at home - Born in the United States (%)
Residents speaking Spanish at home - Native, born elsewhere (%)
Residents speaking Spanish at home - Foreign born (%)
Residents speaking other language at home (%)
Residents speaking other language at home - Born in the United States (%)
Residents speaking other language at home - Native, born elsewhere (%)
Residents speaking other language at home - Foreign born (%)
Marital status - Never married (%)
Marital status - Now married (%)
Marital status - Separated (%)
Marital status - Widowed (%)
Marital status - Divorced (%)
Ancestries Reported - Arab (%)
Ancestries Reported - Czech (%)
Ancestries Reported - Danish (%)
Ancestries Reported - Dutch (%)
Ancestries Reported - English (%)
Ancestries Reported - French (%)
Ancestries Reported - French Canadian (%)
Ancestries Reported - German (%)
Ancestries Reported - Greek (%)
Ancestries Reported - Hungarian (%)
Ancestries Reported - Irish (%)
Ancestries Reported - Italian (%)
Ancestries Reported - Lithuanian (%)
Ancestries Reported - Norwegian (%)
Ancestries Reported - Polish (%)
Ancestries Reported - Portuguese (%)
Ancestries Reported - Russian (%)
Ancestries Reported - Scotch-Irish (%)
Ancestries Reported - Scottish (%)
Ancestries Reported - Slovak (%)
Ancestries Reported - Subsaharan African (%)
Ancestries Reported - Swedish (%)
Ancestries Reported - Swiss (%)
Ancestries Reported - Ukrainian (%)
Ancestries Reported - United States (%)
Ancestries Reported - Welsh (%)
Ancestries Reported - West Indian (%)
Ancestries Reported - Other (%)
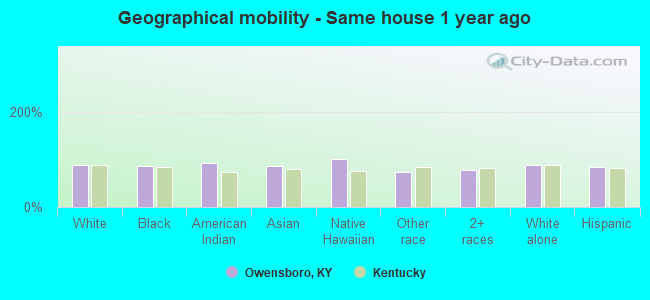
Geographical mobility - Same house 1 year ago (%)
Geographical mobility - Same house 1 year ago (%) - White
Geographical mobility - Same house 1 year ago (%) - Black or African American
Geographical mobility - Same house 1 year ago (%) - Asian
Geographical mobility - Same house 1 year ago (%) - Hispanic or Latino
Geographical mobility - Same house 1 year ago (%) - American Indian and Alaska Native
Geographical mobility - Same house 1 year ago (%) - Multirace
Geographical mobility - Same house 1 year ago (%) - Other Race
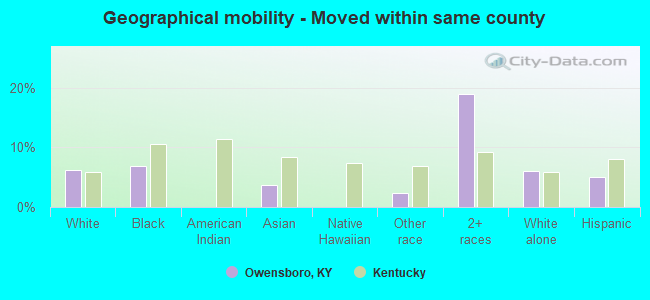
Geographical mobility - Moved within same county (%)
Geographical mobility - Moved within same county (%) - White
Geographical mobility - Moved within same county (%) - Black or African American
Geographical mobility - Moved within same county (%) - Asian
Geographical mobility - Moved within same county (%) - Hispanic or Latino
Geographical mobility - Moved within same county (%) - American Indian and Alaska Native
Geographical mobility - Moved within same county (%) - Multirace
Geographical mobility - Moved within same county (%) - Other Race
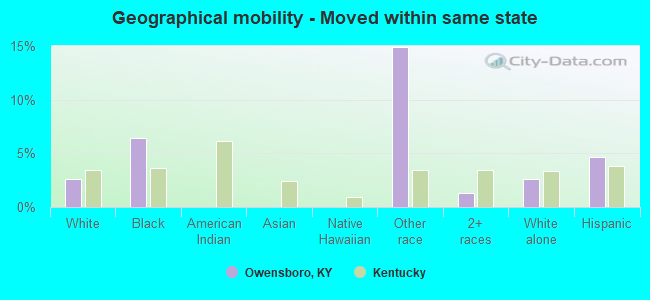
Geographical mobility - Moved from different county within same state (%)
Geographical mobility - Moved from different county within same state (%) - White
Geographical mobility - Moved from different county within same state (%) - Black or African American
Geographical mobility - Moved from different county within same state (%) - Asian
Geographical mobility - Moved from different county within same state (%) - Hispanic or Latino
Geographical mobility - Moved from different county within same state (%) - American Indian and Alaska Native
Geographical mobility - Moved from different county within same state (%) - Multirace
Geographical mobility - Moved from different county within same state (%) - Other Race
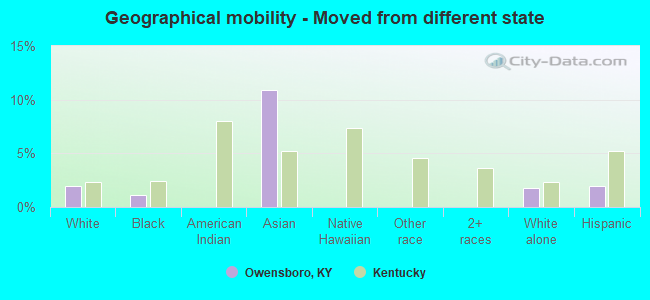
Geographical mobility - Moved from different state (%)
Geographical mobility - Moved from different state (%) - White
Geographical mobility - Moved from different state (%) - Black or African American
Geographical mobility - Moved from different state (%) - Asian
Geographical mobility - Moved from different state (%) - Hispanic or Latino
Geographical mobility - Moved from different state (%) - American Indian and Alaska Native
Geographical mobility - Moved from different state (%) - Multirace
Geographical mobility - Moved from different state (%) - Other Race
Geographical mobility - Moved from abroad (%)
Geographical mobility - Moved from abroad (%) - White
Geographical mobility - Moved from abroad (%) - Black or African American
Geographical mobility - Moved from abroad (%) - Asian
Geographical mobility - Moved from abroad (%) - Hispanic or Latino
Geographical mobility - Moved from abroad (%) - American Indian and Alaska Native
Geographical mobility - Moved from abroad (%) - Multirace
Geographical mobility - Moved from abroad (%) - Other Race
Place of birth for the foreign-born population - Ireland (%)
Place of birth for the foreign-born population - Denmark (%)
Place of birth for the foreign-born population - Norway (%)
Place of birth for the foreign-born population - Sweden (%)
Place of birth for the foreign-born population - United Kingdom (%)
Place of birth for the foreign-born population - England (%)
Place of birth for the foreign-born population - Scotland (%)
Place of birth for the foreign-born population - Other Northern Europe (%)
Place of birth for the foreign-born population - Austria (%)
Place of birth for the foreign-born population - Belgium (%)
Place of birth for the foreign-born population - France (%)
Place of birth for the foreign-born population - Germany (%)
Place of birth for the foreign-born population - Netherlands (%)
Place of birth for the foreign-born population - Switzerland (%)
Place of birth for the foreign-born population - Other Western Europe (%)
Place of birth for the foreign-born population - Greece (%)
Place of birth for the foreign-born population - Italy (%)
Place of birth for the foreign-born population - Portugal (%)
Place of birth for the foreign-born population - Spain (%)
Place of birth for the foreign-born population - Other Southern Europe (%)
Place of birth for the foreign-born population - Albania (%)
Place of birth for the foreign-born population - Belarus (%)
Place of birth for the foreign-born population - Bosnia and Herzegovina (%)
Place of birth for the foreign-born population - Bulgaria (%)
Place of birth for the foreign-born population - Croatia (%)
Place of birth for the foreign-born population - Czechoslovakia (%)
Place of birth for the foreign-born population - Hungary (%)
Place of birth for the foreign-born population - Latvia (%)
Place of birth for the foreign-born population - Lithuania (%)
Place of birth for the foreign-born population - North Macedonia (Macedonia) (%)
Place of birth for the foreign-born population - Moldova (%)
Place of birth for the foreign-born population - Poland (%)
Place of birth for the foreign-born population - Romania (%)
Place of birth for the foreign-born population - Russia (%)
Place of birth for the foreign-born population - Serbia (%)
Place of birth for the foreign-born population - Ukraine (%)
Place of birth for the foreign-born population - Other Eastern Europe (%)
Place of birth for the foreign-born population - China (%)
Place of birth for the foreign-born population - Hong Kong (%)
Place of birth for the foreign-born population - Taiwan (%)
Place of birth for the foreign-born population - Japan (%)
Place of birth for the foreign-born population - Korea (%)
Place of birth for the foreign-born population - Other Eastern Asia (%)
Place of birth for the foreign-born population - Afghanistan (%)
Place of birth for the foreign-born population - Bangladesh (%)
Place of birth for the foreign-born population - India (%)
Place of birth for the foreign-born population - Iran (%)
Place of birth for the foreign-born population - Kazakhstan (%)
Place of birth for the foreign-born population - Nepal (%)
Place of birth for the foreign-born population - Pakistan (%)
Place of birth for the foreign-born population - Sri Lanka (%)
Place of birth for the foreign-born population - Uzbekistan (%)
Place of birth for the foreign-born population - Other South Central Asia (%)
Place of birth for the foreign-born population - Burma (%)
Place of birth for the foreign-born population - Cambodia (%)
Place of birth for the foreign-born population - Indonesia (%)
Place of birth for the foreign-born population - Laos (%)
Place of birth for the foreign-born population - Malaysia (%)
Place of birth for the foreign-born population - Philippines (%)
Place of birth for the foreign-born population - Singapore (%)
Place of birth for the foreign-born population - Thailand (%)
Place of birth for the foreign-born population - Vietnam (%)
Place of birth for the foreign-born population - Other South Eastern Asia (%)
Place of birth for the foreign-born population - Armenia (%)
Place of birth for the foreign-born population - Iraq (%)
Place of birth for the foreign-born population - Israel (%)
Place of birth for the foreign-born population - Jordan (%)
Place of birth for the foreign-born population - Kuwait (%)
Place of birth for the foreign-born population - Lebanon (%)
Place of birth for the foreign-born population - Saudi Arabia (%)
Place of birth for the foreign-born population - Syria (%)
Place of birth for the foreign-born population - Turkey (%)
Place of birth for the foreign-born population - Yemen (%)
Place of birth for the foreign-born population - Other Western Asia (%)
Place of birth for the foreign-born population - Eritrea (%)
Place of birth for the foreign-born population - Ethiopia (%)
Place of birth for the foreign-born population - Kenya (%)
Place of birth for the foreign-born population - Somalia (%)
Place of birth for the foreign-born population - Uganda (%)
Place of birth for the foreign-born population - Zimbabwe (%)
Place of birth for the foreign-born population - Other Eastern Africa (%)
Place of birth for the foreign-born population - Cameroon (%)
Place of birth for the foreign-born population - Congo (%)
Place of birth for the foreign-born population - Democratic Republic of Congo (Zaire) (%)
Place of birth for the foreign-born population - Other Middle Africa (%)
Place of birth for the foreign-born population - Egypt (%)
Place of birth for the foreign-born population - Morocco (%)
Place of birth for the foreign-born population - Sudan (%)
Place of birth for the foreign-born population - Other Northern Africa (%)
Place of birth for the foreign-born population - South Africa (%)
Place of birth for the foreign-born population - Other Southern Africa (%)
Place of birth for the foreign-born population - Cabo Verde (%)
Place of birth for the foreign-born population - Ghana (%)
Place of birth for the foreign-born population - Liberia (%)
Place of birth for the foreign-born population - Nigeria (%)
Place of birth for the foreign-born population - Senegal (%)
Place of birth for the foreign-born population - Sierra Leone (%)
Place of birth for the foreign-born population - Other Western Africa (%)
Place of birth for the foreign-born population - Australia (%)
Place of birth for the foreign-born population - New Zealand (%)
Place of birth for the foreign-born population - Fiji (%)
Place of birth for the foreign-born population - Micronesia (%)
Place of birth for the foreign-born population - Bahamas (%)
Place of birth for the foreign-born population - Barbados (%)
Place of birth for the foreign-born population - Cuba (%)
Place of birth for the foreign-born population - Dominica (%)
Place of birth for the foreign-born population - Dominican Republic (%)
Place of birth for the foreign-born population - Grenada (%)
Place of birth for the foreign-born population - Haiti (%)
Place of birth for the foreign-born population - Jamaica (%)
Place of birth for the foreign-born population - St. Vincent and the Grenadines (%)
Place of birth for the foreign-born population - Trinidad and Tobago (%)
Place of birth for the foreign-born population - West Indies (%)
Place of birth for the foreign-born population - Other Caribbean (%)
Place of birth for the foreign-born population - Belize (%)
Place of birth for the foreign-born population - Costa Rica (%)
Place of birth for the foreign-born population - El Salvador (%)
Place of birth for the foreign-born population - Guatemala (%)
Place of birth for the foreign-born population - Honduras (%)
Place of birth for the foreign-born population - Mexico (%)
Place of birth for the foreign-born population - Nicaragua (%)
Place of birth for the foreign-born population - Panama (%)
Place of birth for the foreign-born population - Other Central America (%)
Place of birth for the foreign-born population - Argentina (%)
Place of birth for the foreign-born population - Bolivia (%)
Place of birth for the foreign-born population - Brazil (%)
Place of birth for the foreign-born population - Chile (%)
Place of birth for the foreign-born population - Colombia (%)
Place of birth for the foreign-born population - Ecuador (%)
Place of birth for the foreign-born population - Guyana (%)
Place of birth for the foreign-born population - Peru (%)
Place of birth for the foreign-born population - Uruguay (%)
Place of birth for the foreign-born population - Venezuela (%)
Place of birth for the foreign-born population - Other South America (%)
Place of birth for the foreign-born population - Canada (%)
Place of birth for the foreign-born population - Other Northern America (%)
Place of birth for the foreign-born population - Other (%)
Latest news about races in Owensboro, KY collected exclusively by city-data.com from local newspapers, TV, and radio stations
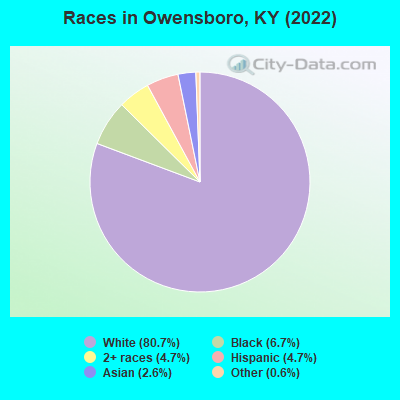
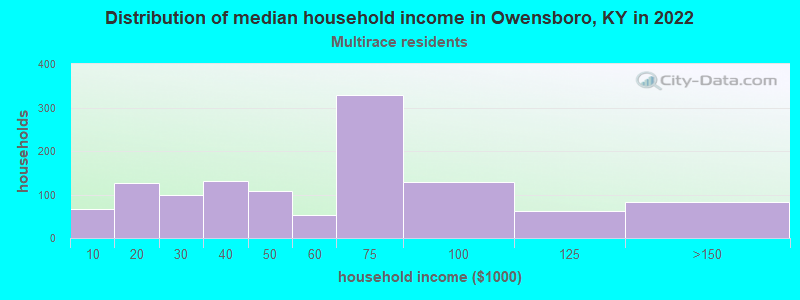
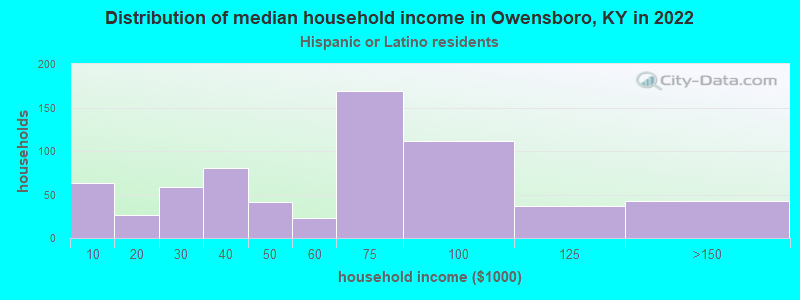
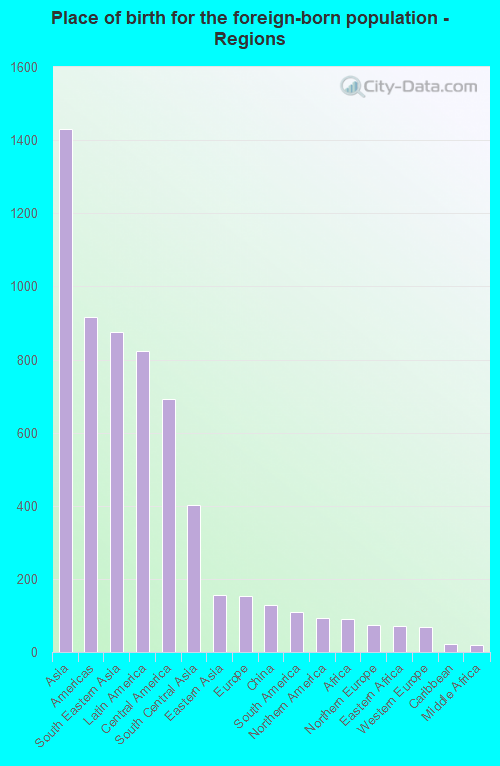
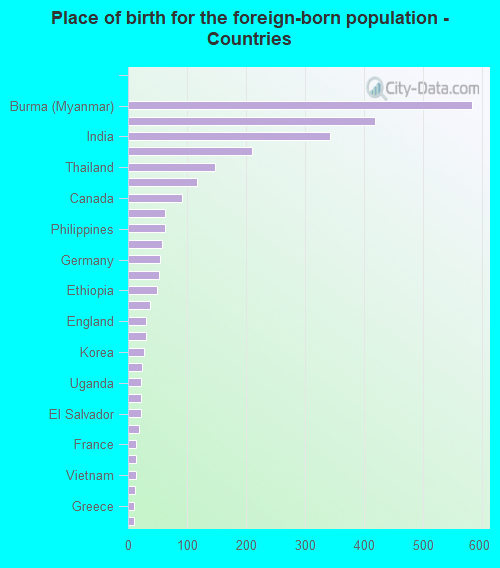
According to 2022 data, the most numerous races in Owensboro, KY are White alone (48,510 residents), Black alone (4,046 residents), and Hispanic (2,805 residents). 93.1% of Owensboro residents speak English at home. 4.3% of Owensboro, KY residents are foreign-born (2.3% born in Asia, 1.3% born in Latin America), which is 7.2% greater than the foreign-born rate of 4.0% across the entire state of Kentucky.
Race distribution in Owensboro
2000 2022
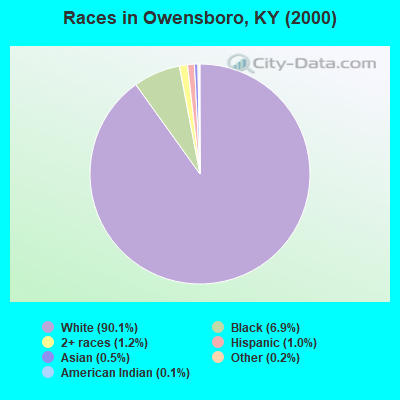
3,608,013 89.3% White alone 293,639 7.3% Black alone 59,939 1.5% Hispanic 37,750 0.9% Two or more races 29,368 0.7% Asian alone 7,939 0.2% American Indian alone 3,846 0.10% Other race alone 1,275 0.03% Native Hawaiian and Other
3,710,998 82.2% White alone 343,194 7.6% Black alone 187,483 4.2% Hispanic 187,394 4.2% Two or more races 62,240 1.4% Asian alone 13,529 0.3% Other race alone 4,302 0.10% American Indian alone 3,170 0.07% Native Hawaiian and Other
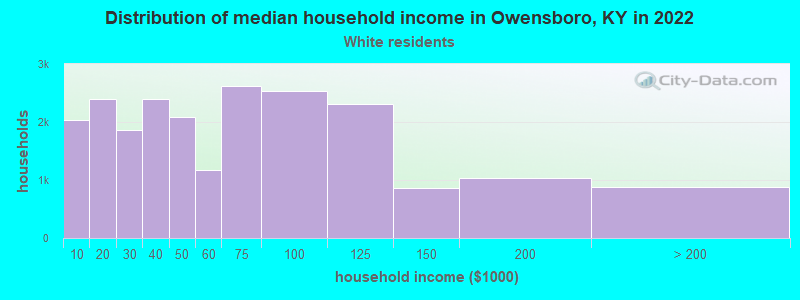
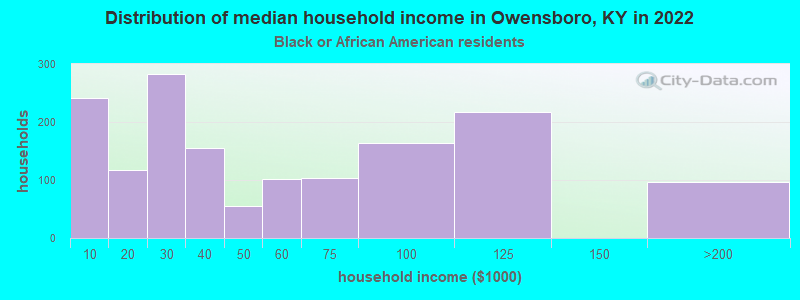
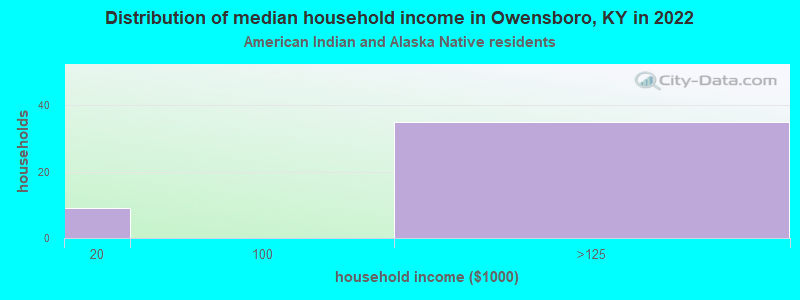
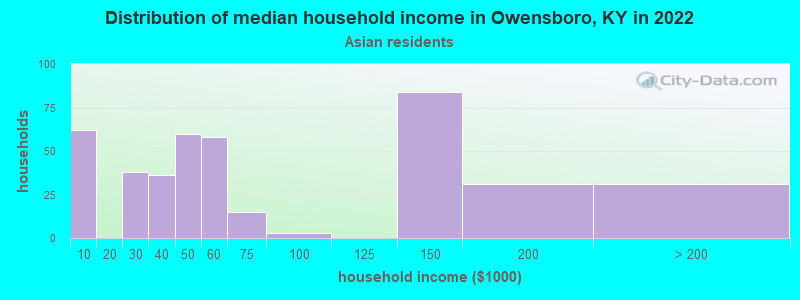
Income and house value in Owensboro Median household income in 2022 $52,820 White non-Hispanic householders$35,338 Black householders$60,679 Asian householders$62,266 Two or more races householders$93,876 Hispanic or Latino race householdersMedian 2022 house value $163,691 White Non-Hispanic householders$110,750 Black or African American householders$201,172 American Indian or Alaska Native householders $464,603 Asian householders$117,738 Two or more races householders$158,820 Hispanic or Latino householders
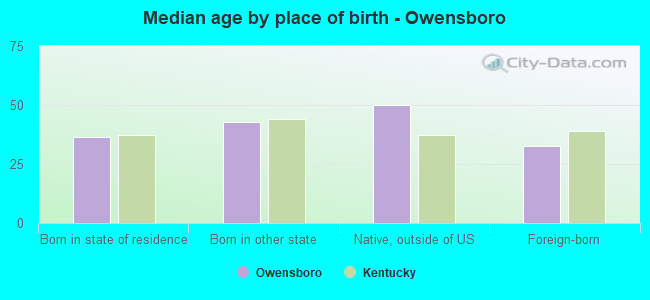
Median age by race in Owensboro
41.6 Median age for White residents39.1 43.6 30.1 Median age for Black or African American residents29.6 32.8 49.9 Median age for American Indian / Alaska Native residents57.6 64.7 24.7 Median age for Asian residents22.4 33.4 31.3 Median age for Native Hawaiian / Pacific Islander residents24.7 11.3 21.6 Median age for Other race residents20.7 23.3 23.4 Median age for Two or more races residents25.2 18.3 41.8 Median age for White alone residents39.2 44.0 17.6 Median age for Hispanic or Latino residents28.5 13.4
Owner/renter occupied households by race in Owensboro
House owners and renters - White residents 13,545 61.5% Owner occupied8,493 38.5% Renter occupiedHouse owners and renters - Black or African American residents 282 24.7% Owner occupied859 75.3% Renter occupiedHouse owners and renters - American Indian / Alaska Native residents 49 100.0% Renter occupiedHouse owners and renters - Asian residents 180 45.8% Owner occupied213 54.2% Renter occupiedHouse owners and renters - Native Hawaiian / Pacific Islander residents 9 20.7% Owner occupied36 79.3% Renter occupiedHouse owners and renters - Other race residents 31 12.9% Owner occupied211 87.1% Renter occupiedHouse owners and renters - Two or more races residents 720 62.2% Owner occupied437 37.8% Renter occupiedHouse owners and renters - White alone residents 13,535 61.8% Owner occupied8,361 38.2% Renter occupiedHouse owners and renters - Hispanic or Latino residents 161 25.6% Owner occupied469 74.4% Renter occupied
Language usage in Owensboro
English speakers - Total 93.1% of residents of Owensboro speak English at home.
3.3% of residents speak Spanish at home 1,058 57.1% Speak English very well795 42.9% Speak English less than very well3.5% of residents speak other language at home 721 36.4% Speak English very well1,260 63.6% Speak English less than very well
English speakers - Born in the United States 94.4% of residents of Owensboro speak English at home.
3.8% of residents speak Spanish at home 367 74.7% Speak English very well124 25.3% Speak English less than very well1.9% of residents speak other language at home 78 32.5% Speak English very well162 67.5% Speak English less than very well
English speakers - Native, born elsewhere 67.2% of residents of Owensboro speak English at home.
29.0% of residents speak Spanish at home 83 84.7% Speak English very well15 15.3% Speak English less than very well4.4% of residents speak other language at home 15 100.0% Speak English very well
English speakers - Foreign-born 12.8% of residents of Owensboro speak English at home.
29.9% of residents speak Spanish at home 231 31.3% Speak English very well507 68.7% Speak English less than very well56.9% of residents speak other language at home 376 26.8% Speak English very well1,028 73.2% Speak English less than very well
White (Caucasian) - Speak only English Native:
98.7% (45,004)Foreign-born:
40.4% (144)
White (Caucasian) - Speak another language Native:
1.3% (607)Foreign-born:
61.3% (218)
Black or African American - Speak only English Native:
99.3% (3,726)Foreign-born:
31.0% (44)
Black or African American - Speak another language Native:
0.8% (31)Foreign-born:
69.9% (99)
American Indian / Alaska Native - Speak another language Native:
10.8% (7)Foreign-born:
98.8% (31)
Asian - Speak only English Native:
13.8% (37)Foreign-born:
4.0% (46)
Asian - Speak another language Native:
87.5% (233)Foreign-born:
96.5% (1,099)
Native Hawaiian / Pacific Islander - Speak only English Native:
12.5% (28)Foreign-born:
96.3% (2)
Other race - Speak only English Native:
59.8% (459)Foreign-born:
8.4% (34)
Other race - Speak another language Native:
40.9% (314)Foreign-born:
91.3% (373)
Two or more races - Speak only English Native:
87.9% (2,637)Foreign-born:
14.2% (55)
Two or more races - Speak another language Native:
12.1% (362)Foreign-born:
86.2% (331)
White alone - Speak only English Native:
98.9% (44,817)Foreign-born:
53.6% (153)
White alone - Speak another language Native:
1.1% (508)Foreign-born:
47.8% (136)
Hispanic or Latino - Speak only English Native:
48.8% (491)Foreign-born:
5.2% (52)
Hispanic or Latino - Speak another language Native:
51.7% (519)Foreign-born:
93.3% (945)
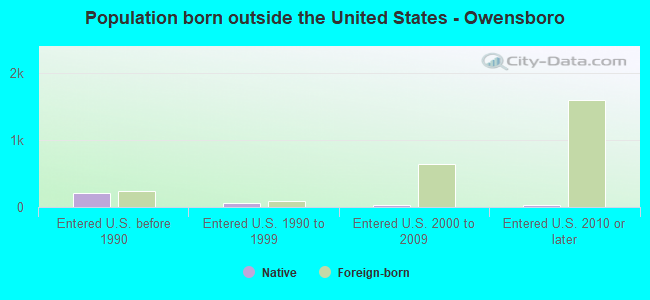
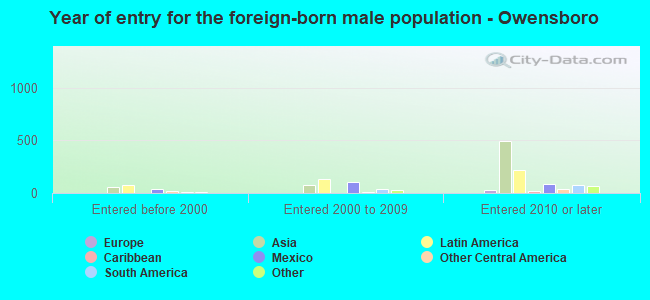
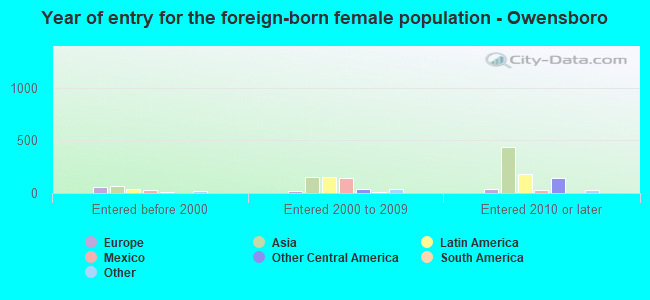
Foreign-born residents in Owensboro 2,595 residents are foreign born (2.3% Asia , 1.3% Latin America ).
This city:
4.3%Kentucky:
4.1%
Marital status for residents in Owensboro Marital status - White (Caucasian) population 15 years and over
Males 32.8% Never married46.6% Now married1.4% Separated4.3% Widowed14.9% DivorcedFemales 25.9% Never married39.9% Now married2.1% Separated11.0% Widowed21.0% DivorcedWomen who gave birth in the past 12 months Now married:
54.4% (352)Unmarried:
45.6% (295)
Women who did not give birth in the past 12 months Now married:
39.2% (4,234)Unmarried:
60.8% (6,580)
Marital status - Black or African American population 15 years and over
Males 53.5% Never married31.4% Now married1.2% Separated0.0% Widowed13.8% DivorcedFemales 39.0% Never married33.1% Now married0.6% Separated12.4% Widowed14.9% DivorcedWomen who gave birth in the past 12 months Now married:
100.0% (12)Unmarried:
0.0% (0)
Women who did not give birth in the past 12 months Now married:
35.2% (327)Unmarried:
64.8% (602)
Marital status - American Indian / Alaska Native population 15 years and over
Males 4.5% Never married75.0% Now married0.0% Separated20.5% Widowed0.0% DivorcedFemales 0.0% Never married40.0% Now married0.0% Separated0.0% Widowed60.0% DivorcedMarital status - Asian population 15 years and over
Males 21.2% Never married63.3% Now married1.2% Separated0.0% Widowed14.4% DivorcedFemales 26.1% Never married58.2% Now married0.0% Separated2.0% Widowed13.8% DivorcedWomen who gave birth in the past 12 months Now married:
100.0% (50)Unmarried:
0.0% (0)
Women who did not give birth in the past 12 months Now married:
47.5% (165)Unmarried:
52.5% (182)
Marital status - Native Hawaiian / Pacific Islander population 15 years and over
Males 71.9% Never married0.0% Now married28.1% Separated0.0% Widowed0.0% DivorcedFemales 92.9% Never married7.1% Now married0.0% Separated0.0% Widowed0.0% DivorcedWomen who gave birth in the past 12 months Now married:
0.0% (0)Unmarried:
100.0% (27)
Women who did not give birth in the past 12 months Now married:
100.0% (2)Unmarried:
0.0% (0)
Marital status - Other race population 15 years and over
Males 72.2% Never married20.2% Now married0.0% Separated0.0% Widowed7.6% DivorcedFemales 81.4% Never married18.6% Now married0.0% Separated0.0% Widowed0.0% DivorcedWomen who gave birth in the past 12 months Now married:
0.0% (0)Unmarried:
100.0% (108)
Women who did not give birth in the past 12 months Now married:
20.3% (46)Unmarried:
79.7% (180)
Marital status - Two or more races population 15 years and over
Males 55.0% Never married28.6% Now married9.3% Separated0.0% Widowed7.0% DivorcedFemales 58.0% Never married16.1% Now married1.5% Separated6.0% Widowed18.4% DivorcedWomen who gave birth in the past 12 months Now married:
0.9% (1)Unmarried:
99.1% (152)
Women who did not give birth in the past 12 months Now married:
13.9% (111)Unmarried:
86.1% (685)
Marital status - White alone, not Hispanic / Latino population 15 years and over
Males 32.7% Never married46.5% Now married1.4% Separated4.3% Widowed15.0% DivorcedFemales 25.6% Never married40.0% Now married2.2% Separated11.1% Widowed21.1% DivorcedWomen who gave birth in the past 12 months Now married:
53.8% (347)Unmarried:
46.2% (298)
Women who did not give birth in the past 12 months Now married:
39.3% (4,212)Unmarried:
60.7% (6,499)
Marital status - Hispanic or Latino population 15 years and over
Males 47.9% Never married35.9% Now married6.4% Separated0.0% Widowed9.8% DivorcedFemales 55.5% Never married23.4% Now married1.7% Separated8.5% Widowed10.8% DivorcedWomen who gave birth in the past 12 months Now married:
11.0% (10)Unmarried:
89.0% (79)
Women who did not give birth in the past 12 months Now married:
26.1% (140)Unmarried:
73.9% (396)
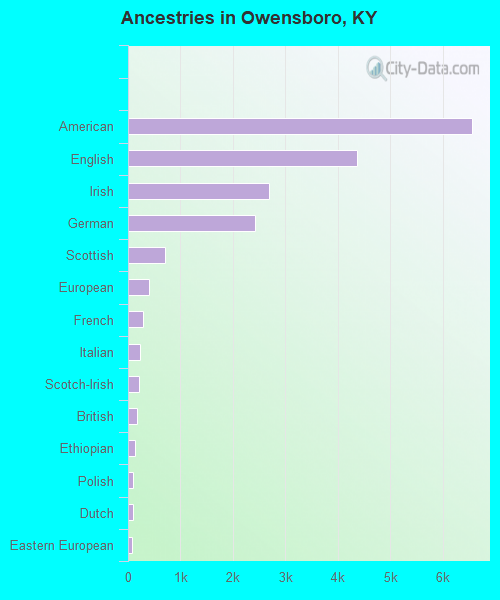
Ancestries in Owensboro
6,558 24.8% American4,365 16.5% English2,690 10.2% Irish2,421 9.2% German702 2.7% Scottish400 1.5% European283 1.1% French236 0.9% Italian204 0.8% Scotch-Irish178 0.7% British124 0.5% Ethiopian102 0.4% Polish89 0.3% Dutch68 0.3% Eastern European55 0.2% French Canadian45 0.2% African40 0.2% Greek39 0.1% Russian32 0.1% Welsh29 0.1% Canadian21 0.08% Finnish15 0.06% Czech13 0.05% Swiss12 0.05% Hungarian11 0.04% West Indian9 0.03% Northern European9 0.03% Norwegian7 0.03% Belgian6 0.02% Austrian
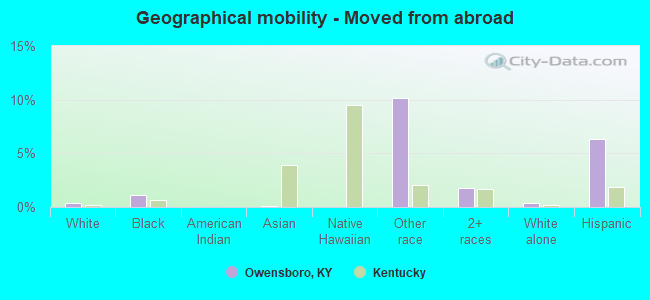
Geographical mobility in Owensboro Same house 1 year ago 43,157 88.9% White (Caucasian)3,521 86.1% Black or African American89 91.6% American Indian / Alaska Native1,318 85.2% Asian237 100.0% Native Hawaiian / Pacific Islander994 72.9% Other race2,909 77.8% Two or more races42,870 89.1% White alone, not Hispanic / Latino2,145 83.0% Hispanic or LatinoMoved within same county 2,973 6.1% White / Caucasian278 6.8% Black or African American58 3.8% Asian32 2.4% Other race707 18.9% Two or more races2,909 6.0% White alone, not Hispanic / Latino132 5.1% Hispanic or LatinoMoved within same state 1,245 2.6% White / Caucasian261 6.4% Black or African American203 14.9% Other race49 1.3% Two or more races1,256 2.6% White alone, not Hispanic / Latino120 4.6% Hispanic or LatinoMoved from different state 947 2.0% White / Caucasian47 1.1% Black or African American168 10.9% Asian870 1.8% White alone, not Hispanic / Latino52 2.0% Hispanic or LatinoMoved from abroad 188 0.4% White44 1.1% Black or African American2 0.1% Asian138 10.1% Other race65 1.7% Two or more races173 0.4% White alone, not Hispanic / Latino163 6.3% Hispanic or Latino
Children Nativity (place of birth) in Owensboro
Children under 6 years - Living with two parents Both parents native 2,299 99.9% Native1 0.1% Foreign-bornBoth parents foreign-born 222 73.8% Native79 26.2% Foreign-bornOne native, one foreign-born parent 38 100.0% NativeChildren under 6 years - Living with one parent Native parent 1,941 100.0% NativeForeign-born parent 90 84.8% Native16 15.2% Foreign-bornChildren 6 to 17 years - Living with two parents Both parents native 4,138 100.0% NativeBoth parents foreign-born 275 65.5% Native145 34.5% Foreign-bornOne native, one foreign-born parent 17 100.0% NativeChildren 6 to 17 years - Living with one parent Native parent 3,468 100.0% NativeForeign-born parent 314 51.6% Native294 48.4% Foreign-born
Grandparents responsible for own grandchildren in Owensboro
Grandparents (30 to 59 years) White / Caucasian 102 33.1% Responsible for grandchildren206 66.9% Not responsible for grandchildrenBlack or African American 33 100.0% Responsible for grandchildrenAsian 29 23.4% Responsible for grandchildren95 76.6% Not responsible for grandchildrenOther race 38 100.0% Not responsible for grandchildrenTwo or more races 6 100.0% Not responsible for grandchildrenWhite alone, not Hispanic / Latino 102 32.8% Responsible for grandchildren209 67.2% Not responsible for grandchildrenHispanic or Latino 26 100.0% Not responsible for grandchildrenGrandparents (60 years and over) White / Caucasian 274 66.9% Responsible for grandchildren135 33.1% Not responsible for grandchildrenBlack or African American 24 100.0% Not responsible for grandchildrenAsian 54 100.0% Not responsible for grandchildrenOther race 14 100.0% Not responsible for grandchildrenTwo or more races 24 100.0% Responsible for grandchildrenWhite alone, not Hispanic / Latino 275 66.8% Responsible for grandchildren137 33.2% Not responsible for grandchildrenHispanic or Latino 12 100.0% Not responsible for grandchildren