Races in Otsego, Minnesota (MN) Detailed Stats
Data:
Races - White alone (%)
Races - White alone (% change since 2000)
Races - Black alone (%)
Races - Black alone (% change since 2000)
Races - American Indian alone (%)
Races - American Indian alone (% change since 2000)
Races - Asian alone (%)
Races - Asian alone (% change since 2000)
Races - Hispanic (%)
Races - Hispanic (% change since 2000)
Races - Native Hawaiian and Other Pacific Islander alone (%)
Races - Native Hawaiian and Other Pacific Islander alone (% change since 2000)
Races - Two or more races(%)
Races - Two or more races(% change since 2000)
Races - Other race alone (%)
Races - Other race alone (% change since 2000)
Racial diversity
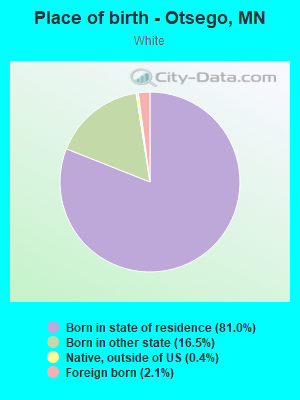
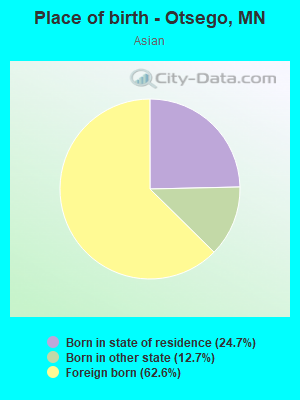
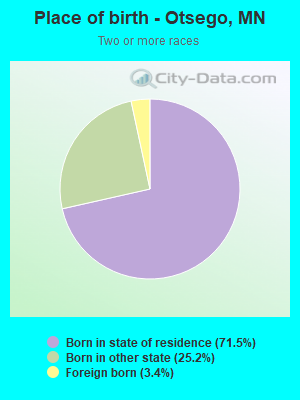
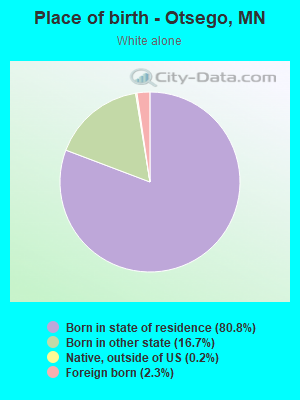
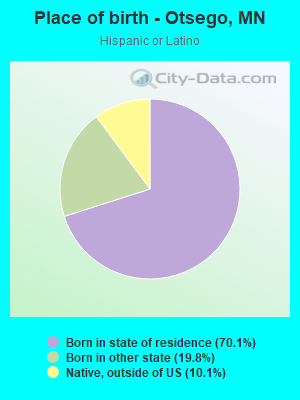
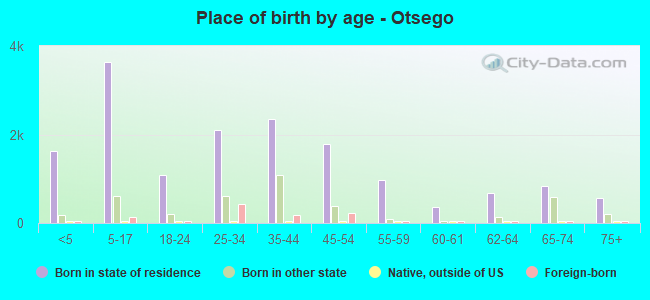
Place of birth - Born in state of residence (%)
Place of birth - Born in state of residence (%) - White
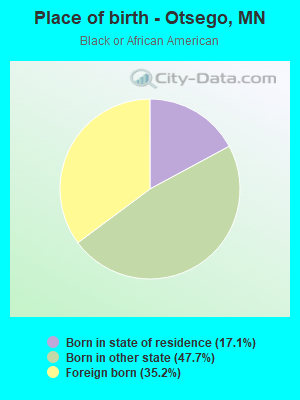
Place of birth - Born in state of residence (%) - Black or African American
Place of birth - Born in state of residence (%) - Asian
Place of birth - Born in state of residence (%) - Hispanic or Latino
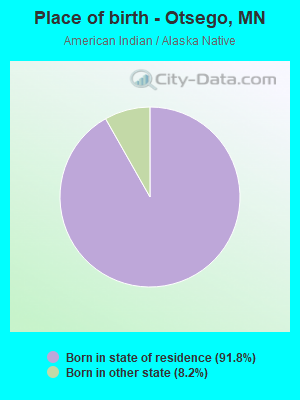
Place of birth - Born in state of residence (%) - American Indian and Alaska Native
Place of birth - Born in state of residence (%) - Multirace
Place of birth - Born in state of residence (%) - Other Race
Place of birth - Born in other state (%)
Place of birth - Born in other state (%) - White
Place of birth - Born in other state (%) - Black or African American
Place of birth - Born in other state (%) - Asian
Place of birth - Born in other state (%) - Hispanic or Latino
Place of birth - Born in other state (%) - American Indian and Alaska Native
Place of birth - Born in other state (%) - Multirace
Place of birth - Born in other state (%) - Other Race
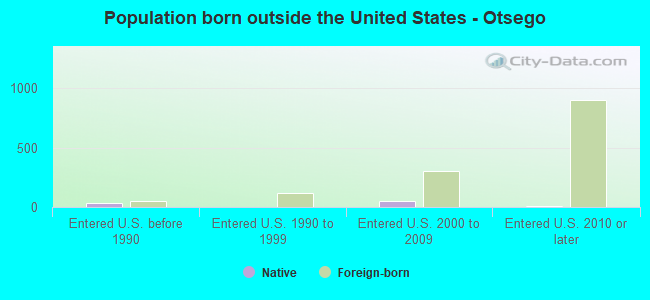
Place of birth - Native, outside of US (%)
Place of birth - Native, outside of US (%) - White
Place of birth - Native, outside of US (%) - Black or African American
Place of birth - Native, outside of US (%) - Asian
Place of birth - Native, outside of US (%) - Hispanic or Latino
Place of birth - Native, outside of US (%) - American Indian and Alaska Native
Place of birth - Native, outside of US (%) - Multirace
Place of birth - Native, outside of US (%) - Other Race
Place of birth - Foreign born (%)
Place of birth - Foreign born (%) - White
Place of birth - Foreign born (%) - Black or African American
Place of birth - Foreign born (%) - Asian
Place of birth - Foreign born (%) - Hispanic or Latino
Place of birth - Foreign born (%) - American Indian and Alaska Native
Place of birth - Foreign born (%) - Multirace
Place of birth - Foreign born (%) - Other Race
Residents speaking English at home (%)
Residents speaking English at home - Born in the United States (%)
Residents speaking English at home - Native, born elsewhere (%)
Residents speaking English at home - Foreign born (%)
Residents speaking Spanish at home (%)
Residents speaking Spanish at home - Born in the United States (%)
Residents speaking Spanish at home - Native, born elsewhere (%)
Residents speaking Spanish at home - Foreign born (%)
Residents speaking other language at home (%)
Residents speaking other language at home - Born in the United States (%)
Residents speaking other language at home - Native, born elsewhere (%)
Residents speaking other language at home - Foreign born (%)
Marital status - Never married (%)
Marital status - Now married (%)
Marital status - Separated (%)
Marital status - Widowed (%)
Marital status - Divorced (%)
Ancestries Reported - Arab (%)
Ancestries Reported - Czech (%)
Ancestries Reported - Danish (%)
Ancestries Reported - Dutch (%)
Ancestries Reported - English (%)
Ancestries Reported - French (%)
Ancestries Reported - French Canadian (%)
Ancestries Reported - German (%)
Ancestries Reported - Greek (%)
Ancestries Reported - Hungarian (%)
Ancestries Reported - Irish (%)
Ancestries Reported - Italian (%)
Ancestries Reported - Lithuanian (%)
Ancestries Reported - Norwegian (%)
Ancestries Reported - Polish (%)
Ancestries Reported - Portuguese (%)
Ancestries Reported - Russian (%)
Ancestries Reported - Scotch-Irish (%)
Ancestries Reported - Scottish (%)
Ancestries Reported - Slovak (%)
Ancestries Reported - Subsaharan African (%)
Ancestries Reported - Swedish (%)
Ancestries Reported - Swiss (%)
Ancestries Reported - Ukrainian (%)
Ancestries Reported - United States (%)
Ancestries Reported - Welsh (%)
Ancestries Reported - West Indian (%)
Ancestries Reported - Other (%)
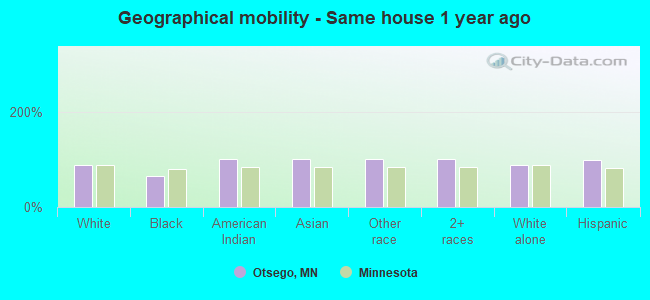
Geographical mobility - Same house 1 year ago (%)
Geographical mobility - Same house 1 year ago (%) - White
Geographical mobility - Same house 1 year ago (%) - Black or African American
Geographical mobility - Same house 1 year ago (%) - Asian
Geographical mobility - Same house 1 year ago (%) - Hispanic or Latino
Geographical mobility - Same house 1 year ago (%) - American Indian and Alaska Native
Geographical mobility - Same house 1 year ago (%) - Multirace
Geographical mobility - Same house 1 year ago (%) - Other Race
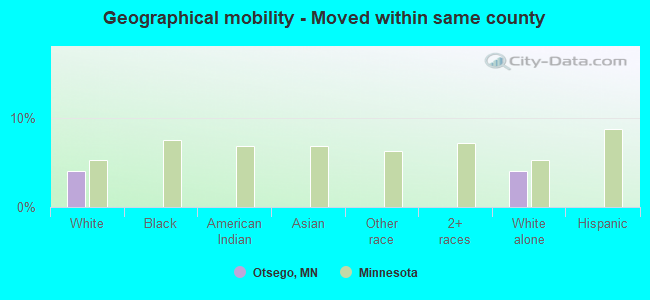
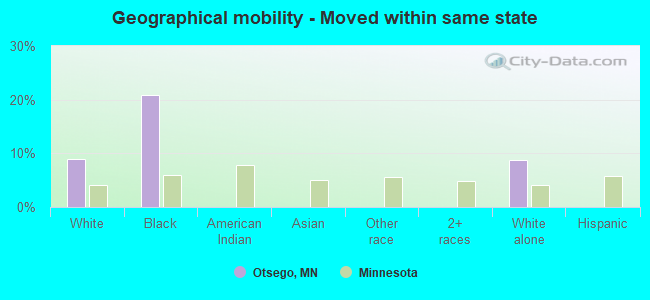
Geographical mobility - Moved within same county (%)
Geographical mobility - Moved within same county (%) - White
Geographical mobility - Moved within same county (%) - Black or African American
Geographical mobility - Moved within same county (%) - Asian
Geographical mobility - Moved within same county (%) - Hispanic or Latino
Geographical mobility - Moved within same county (%) - American Indian and Alaska Native
Geographical mobility - Moved within same county (%) - Multirace
Geographical mobility - Moved within same county (%) - Other Race
Geographical mobility - Moved from different county within same state (%)
Geographical mobility - Moved from different county within same state (%) - White
Geographical mobility - Moved from different county within same state (%) - Black or African American
Geographical mobility - Moved from different county within same state (%) - Asian
Geographical mobility - Moved from different county within same state (%) - Hispanic or Latino
Geographical mobility - Moved from different county within same state (%) - American Indian and Alaska Native
Geographical mobility - Moved from different county within same state (%) - Multirace
Geographical mobility - Moved from different county within same state (%) - Other Race
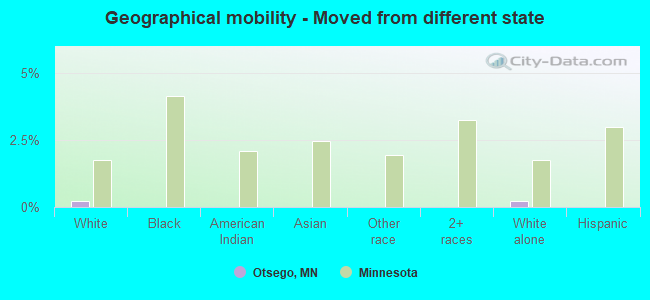
Geographical mobility - Moved from different state (%)
Geographical mobility - Moved from different state (%) - White
Geographical mobility - Moved from different state (%) - Black or African American
Geographical mobility - Moved from different state (%) - Asian
Geographical mobility - Moved from different state (%) - Hispanic or Latino
Geographical mobility - Moved from different state (%) - American Indian and Alaska Native
Geographical mobility - Moved from different state (%) - Multirace
Geographical mobility - Moved from different state (%) - Other Race
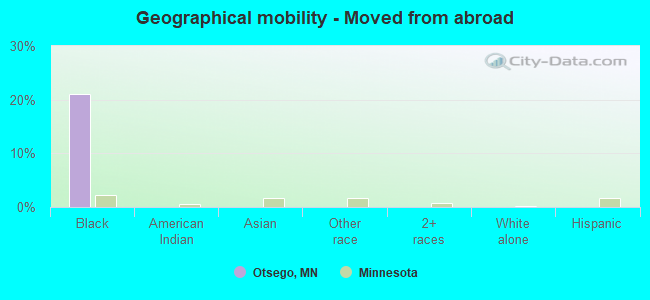
Geographical mobility - Moved from abroad (%)
Geographical mobility - Moved from abroad (%) - White
Geographical mobility - Moved from abroad (%) - Black or African American
Geographical mobility - Moved from abroad (%) - Asian
Geographical mobility - Moved from abroad (%) - Hispanic or Latino
Geographical mobility - Moved from abroad (%) - American Indian and Alaska Native
Geographical mobility - Moved from abroad (%) - Multirace
Geographical mobility - Moved from abroad (%) - Other Race
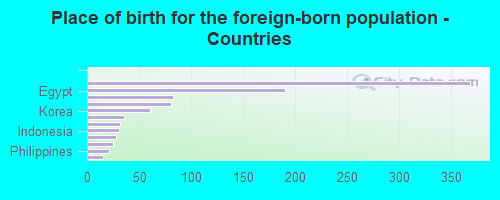
Place of birth for the foreign-born population - Ireland (%)
Place of birth for the foreign-born population - Denmark (%)
Place of birth for the foreign-born population - Norway (%)
Place of birth for the foreign-born population - Sweden (%)
Place of birth for the foreign-born population - United Kingdom (%)
Place of birth for the foreign-born population - England (%)
Place of birth for the foreign-born population - Scotland (%)
Place of birth for the foreign-born population - Other Northern Europe (%)
Place of birth for the foreign-born population - Austria (%)
Place of birth for the foreign-born population - Belgium (%)
Place of birth for the foreign-born population - France (%)
Place of birth for the foreign-born population - Germany (%)
Place of birth for the foreign-born population - Netherlands (%)
Place of birth for the foreign-born population - Switzerland (%)
Place of birth for the foreign-born population - Other Western Europe (%)
Place of birth for the foreign-born population - Greece (%)
Place of birth for the foreign-born population - Italy (%)
Place of birth for the foreign-born population - Portugal (%)
Place of birth for the foreign-born population - Spain (%)
Place of birth for the foreign-born population - Other Southern Europe (%)
Place of birth for the foreign-born population - Albania (%)
Place of birth for the foreign-born population - Belarus (%)
Place of birth for the foreign-born population - Bosnia and Herzegovina (%)
Place of birth for the foreign-born population - Bulgaria (%)
Place of birth for the foreign-born population - Croatia (%)
Place of birth for the foreign-born population - Czechoslovakia (%)
Place of birth for the foreign-born population - Hungary (%)
Place of birth for the foreign-born population - Latvia (%)
Place of birth for the foreign-born population - Lithuania (%)
Place of birth for the foreign-born population - North Macedonia (Macedonia) (%)
Place of birth for the foreign-born population - Moldova (%)
Place of birth for the foreign-born population - Poland (%)
Place of birth for the foreign-born population - Romania (%)
Place of birth for the foreign-born population - Russia (%)
Place of birth for the foreign-born population - Serbia (%)
Place of birth for the foreign-born population - Ukraine (%)
Place of birth for the foreign-born population - Other Eastern Europe (%)
Place of birth for the foreign-born population - China (%)
Place of birth for the foreign-born population - Hong Kong (%)
Place of birth for the foreign-born population - Taiwan (%)
Place of birth for the foreign-born population - Japan (%)
Place of birth for the foreign-born population - Korea (%)
Place of birth for the foreign-born population - Other Eastern Asia (%)
Place of birth for the foreign-born population - Afghanistan (%)
Place of birth for the foreign-born population - Bangladesh (%)
Place of birth for the foreign-born population - India (%)
Place of birth for the foreign-born population - Iran (%)
Place of birth for the foreign-born population - Kazakhstan (%)
Place of birth for the foreign-born population - Nepal (%)
Place of birth for the foreign-born population - Pakistan (%)
Place of birth for the foreign-born population - Sri Lanka (%)
Place of birth for the foreign-born population - Uzbekistan (%)
Place of birth for the foreign-born population - Other South Central Asia (%)
Place of birth for the foreign-born population - Burma (%)
Place of birth for the foreign-born population - Cambodia (%)
Place of birth for the foreign-born population - Indonesia (%)
Place of birth for the foreign-born population - Laos (%)
Place of birth for the foreign-born population - Malaysia (%)
Place of birth for the foreign-born population - Philippines (%)
Place of birth for the foreign-born population - Singapore (%)
Place of birth for the foreign-born population - Thailand (%)
Place of birth for the foreign-born population - Vietnam (%)
Place of birth for the foreign-born population - Other South Eastern Asia (%)
Place of birth for the foreign-born population - Armenia (%)
Place of birth for the foreign-born population - Iraq (%)
Place of birth for the foreign-born population - Israel (%)
Place of birth for the foreign-born population - Jordan (%)
Place of birth for the foreign-born population - Kuwait (%)
Place of birth for the foreign-born population - Lebanon (%)
Place of birth for the foreign-born population - Saudi Arabia (%)
Place of birth for the foreign-born population - Syria (%)
Place of birth for the foreign-born population - Turkey (%)
Place of birth for the foreign-born population - Yemen (%)
Place of birth for the foreign-born population - Other Western Asia (%)
Place of birth for the foreign-born population - Eritrea (%)
Place of birth for the foreign-born population - Ethiopia (%)
Place of birth for the foreign-born population - Kenya (%)
Place of birth for the foreign-born population - Somalia (%)
Place of birth for the foreign-born population - Uganda (%)
Place of birth for the foreign-born population - Zimbabwe (%)
Place of birth for the foreign-born population - Other Eastern Africa (%)
Place of birth for the foreign-born population - Cameroon (%)
Place of birth for the foreign-born population - Congo (%)
Place of birth for the foreign-born population - Democratic Republic of Congo (Zaire) (%)
Place of birth for the foreign-born population - Other Middle Africa (%)
Place of birth for the foreign-born population - Egypt (%)
Place of birth for the foreign-born population - Morocco (%)
Place of birth for the foreign-born population - Sudan (%)
Place of birth for the foreign-born population - Other Northern Africa (%)
Place of birth for the foreign-born population - South Africa (%)
Place of birth for the foreign-born population - Other Southern Africa (%)
Place of birth for the foreign-born population - Cabo Verde (%)
Place of birth for the foreign-born population - Ghana (%)
Place of birth for the foreign-born population - Liberia (%)
Place of birth for the foreign-born population - Nigeria (%)
Place of birth for the foreign-born population - Senegal (%)
Place of birth for the foreign-born population - Sierra Leone (%)
Place of birth for the foreign-born population - Other Western Africa (%)
Place of birth for the foreign-born population - Australia (%)
Place of birth for the foreign-born population - New Zealand (%)
Place of birth for the foreign-born population - Fiji (%)
Place of birth for the foreign-born population - Micronesia (%)
Place of birth for the foreign-born population - Bahamas (%)
Place of birth for the foreign-born population - Barbados (%)
Place of birth for the foreign-born population - Cuba (%)
Place of birth for the foreign-born population - Dominica (%)
Place of birth for the foreign-born population - Dominican Republic (%)
Place of birth for the foreign-born population - Grenada (%)
Place of birth for the foreign-born population - Haiti (%)
Place of birth for the foreign-born population - Jamaica (%)
Place of birth for the foreign-born population - St. Vincent and the Grenadines (%)
Place of birth for the foreign-born population - Trinidad and Tobago (%)
Place of birth for the foreign-born population - West Indies (%)
Place of birth for the foreign-born population - Other Caribbean (%)
Place of birth for the foreign-born population - Belize (%)
Place of birth for the foreign-born population - Costa Rica (%)
Place of birth for the foreign-born population - El Salvador (%)
Place of birth for the foreign-born population - Guatemala (%)
Place of birth for the foreign-born population - Honduras (%)
Place of birth for the foreign-born population - Mexico (%)
Place of birth for the foreign-born population - Nicaragua (%)
Place of birth for the foreign-born population - Panama (%)
Place of birth for the foreign-born population - Other Central America (%)
Place of birth for the foreign-born population - Argentina (%)
Place of birth for the foreign-born population - Bolivia (%)
Place of birth for the foreign-born population - Brazil (%)
Place of birth for the foreign-born population - Chile (%)
Place of birth for the foreign-born population - Colombia (%)
Place of birth for the foreign-born population - Ecuador (%)
Place of birth for the foreign-born population - Guyana (%)
Place of birth for the foreign-born population - Peru (%)
Place of birth for the foreign-born population - Uruguay (%)
Place of birth for the foreign-born population - Venezuela (%)
Place of birth for the foreign-born population - Other South America (%)
Place of birth for the foreign-born population - Canada (%)
Place of birth for the foreign-born population - Other Northern America (%)
Place of birth for the foreign-born population - Other (%)
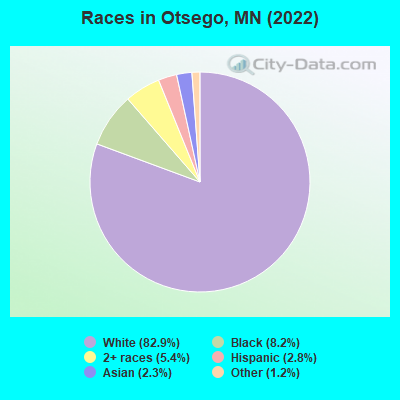
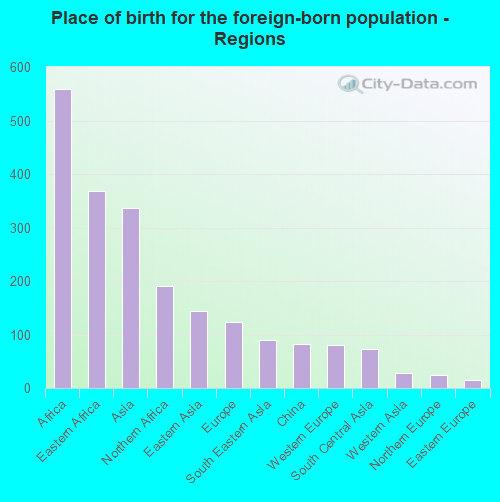
According to 2022 data, the most numerous races in Otsego, MN are White alone (17,602 residents), Black alone (1,747 residents), and Hispanic (604 residents). 94.7% of Otsego residents speak English at home. 4.8% of Otsego, MN residents are foreign-born (2.6% born in Africa, 1.6% born in Asia, 0.6% born in Europe), which is 66.9% less than the foreign-born rate of 8.0% across the entire state of Minnesota.
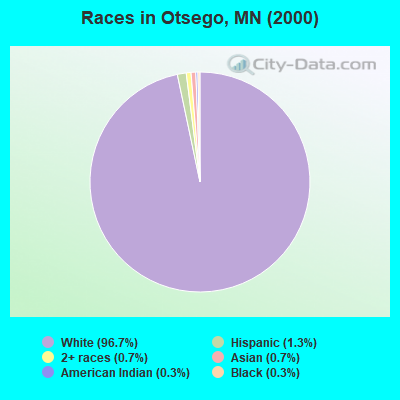
Race distribution in Otsego
2000 2022
4,337,143 88.2% White alone 168,813 3.4% Black alone 143,382 2.9% Hispanic 141,083 2.9% Asian alone 70,304 1.4% Two or more races 52,009 1.1% American Indian alone 5,031 0.1% Other race alone 1,714 0.03% Native Hawaiian and Other
4,356,347 76.2% White alone 395,179 6.9% Black alone 333,830 5.8% Hispanic 294,800 5.2% Asian alone 259,649 4.5% Two or more races 42,125 0.7% American Indian alone 32,976 0.6% Other race alone 2,278 0.04% Native Hawaiian and Other
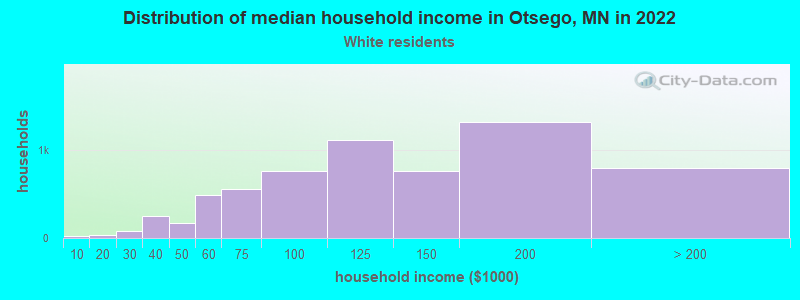
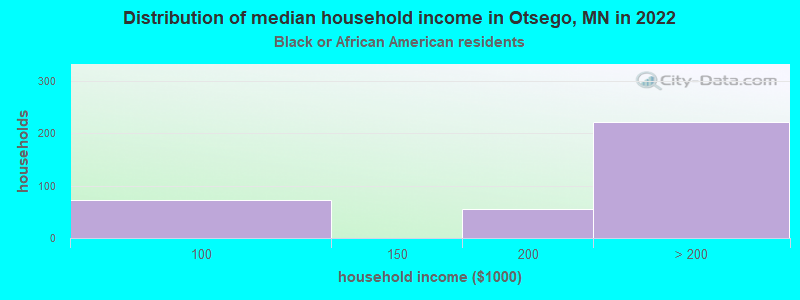
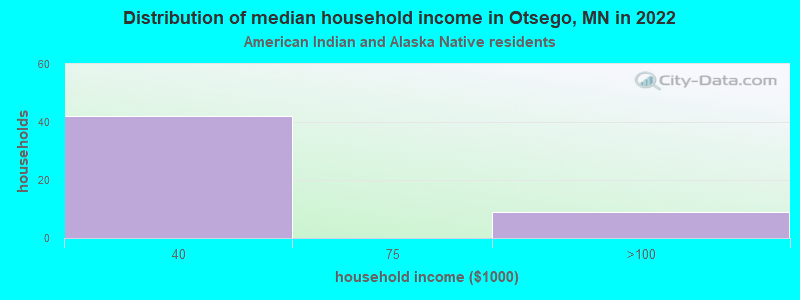
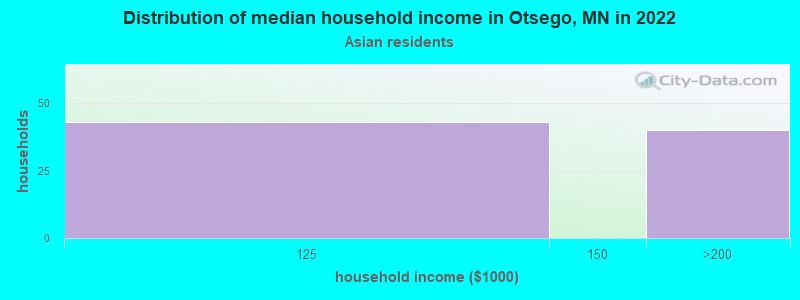
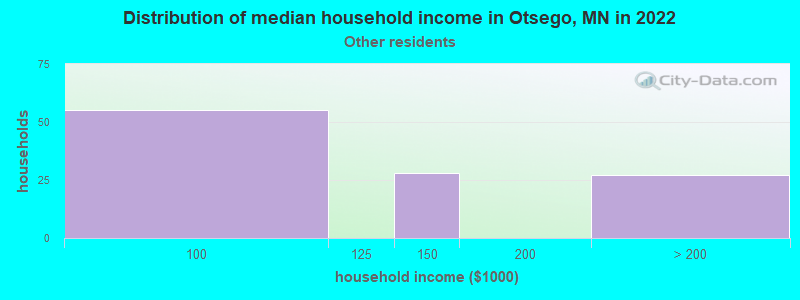
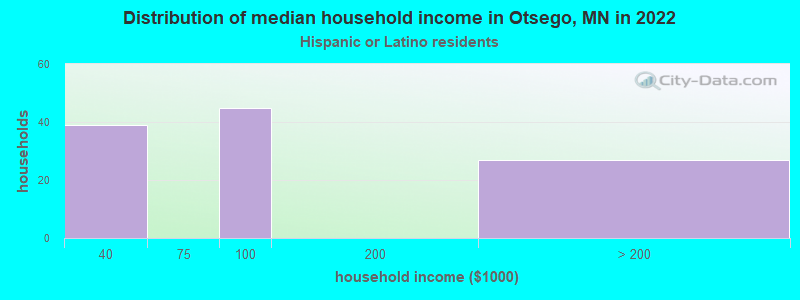
Income and house value in Otsego Median household income in 2022 $110,456 White non-Hispanic householdersover $200,000 Black householders$151,756 Some other race householders$82,205 Hispanic or Latino race householdersMedian 2022 house value $404,023 White Non-Hispanic householders$366,412 Black or African American householders$408,573 Two or more races householders$375,511 Hispanic or Latino householders
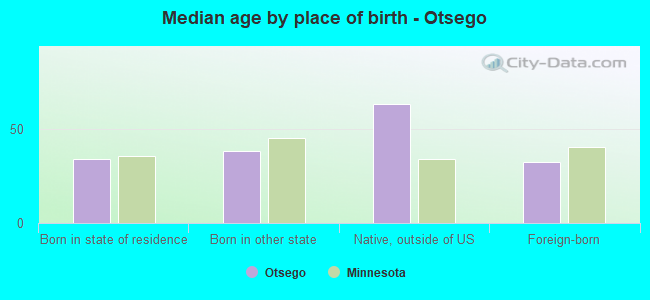
Median age by race in Otsego
36.5 Median age for White residents35.1 38.3 32.9 Median age for Black or African American residents19.5 32.8 11.0 Median age for American Indian / Alaska Native residents-615,023,473.6 4.4 31.0 Median age for Asian residents26.8 31.4 -666,666,666.0 Median age for Native Hawaiian / Pacific Islander residents-666,666,666.0 -666,666,666.0 49.5 Median age for Other race residents40.4 44.4 17.6 Median age for Two or more races residents43.5 12.4 36.7 Median age for White alone residents35.2 38.5 10.4 Median age for Hispanic or Latino residents23.0 8.7
Owner/renter occupied households by race in Otsego
House owners and renters - White residents 5,901 90.0% Owner occupied658 10.0% Renter occupiedHouse owners and renters - Black or African American residents 332 100.0% Owner occupiedHouse owners and renters - American Indian / Alaska Native residents 8 16.7% Owner occupied41 83.3% Renter occupiedHouse owners and renters - Asian residents 66 100.0% Owner occupiedHouse owners and renters - Other race residents 114 100.0% Owner occupiedHouse owners and renters - White alone residents 5,887 89.9% Owner occupied665 10.1% Renter occupiedHouse owners and renters - Hispanic or Latino residents 89 75.0% Owner occupied30 25.0% Renter occupied
Language usage in Otsego
English speakers - Total 94.7% of residents of Otsego speak English at home.
0.4% of residents speak Spanish at home 69 87.3% Speak English very well10 12.7% Speak English less than very well6.2% of residents speak other language at home 1,184 97.6% Speak English very well29 2.4% Speak English less than very well
English speakers - Born in the United States 97.2% of residents of Otsego speak English at home.
3.0% of residents speak other language at home 108 100.0% Speak English very well
All residents speak only English at home
English speakers - Foreign-born 17.9% of residents of Otsego speak English at home.
103.7% of residents speak other language at home 1,191 97.1% Speak English very well35 2.9% Speak English less than very well
White (Caucasian) - Speak only English Native:
99.7% (15,966)Foreign-born:
8.2% (28)
White (Caucasian) - Speak another language Native:
0.5% (81)Foreign-born:
100.0% (340)
Asian - Speak only English Native:
26.7% (50)Foreign-born:
54.1% (133)
Asian - Speak another language Native:
29.4% (55)Foreign-born:
39.9% (98)
Two or more races - Speak only English Native:
95.5% (970)Foreign-born:
86.9% (51)
White alone - Speak only English Native:
99.6% (15,877)Foreign-born:
6.1% (23)
White alone - Speak another language Native:
0.5% (80)Foreign-born:
100.0% (379)
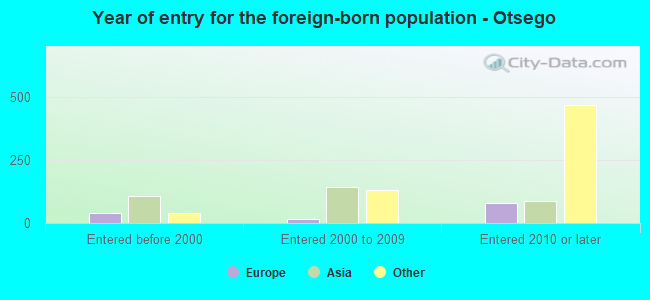
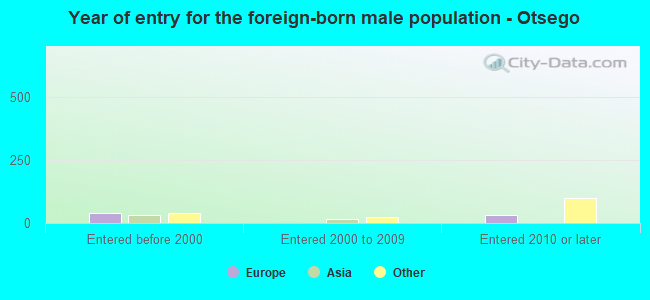
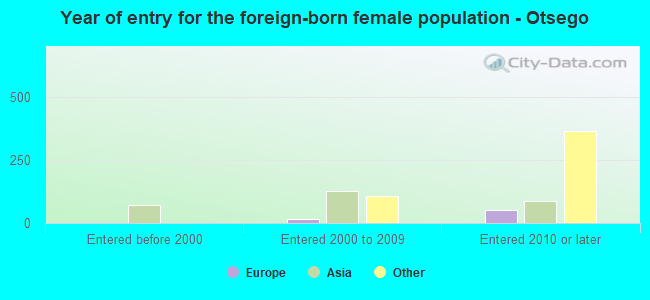
Foreign-born residents in Otsego 1,018 residents are foreign born (2.6% Africa , 1.6% Asia , 0.6% Europe ).
This city:
4.8%Minnesota:
8.5%
Marital status for residents in Otsego Marital status - White (Caucasian) population 15 years and over
Males 31.9% Never married60.9% Now married1.2% Separated1.1% Widowed4.8% DivorcedFemales 13.6% Never married66.5% Now married0.4% Separated7.6% Widowed11.9% DivorcedWomen who gave birth in the past 12 months Now married:
95.6% (351)Unmarried:
4.4% (16)
Women who did not give birth in the past 12 months Now married:
63.5% (2,304)Unmarried:
36.5% (1,325)
Marital status - Black or African American population 15 years and over
Males 39.8% Never married55.4% Now married0.0% Separated0.0% Widowed4.8% DivorcedFemales 48.5% Never married47.1% Now married0.0% Separated0.0% Widowed4.4% DivorcedWomen who did not give birth in the past 12 months Now married:
41.6% (178)Unmarried:
58.4% (251)
Marital status - American Indian / Alaska Native population 15 years and over
Males 0.0% Never married100.0% Now married0.0% Separated0.0% Widowed0.0% DivorcedFemales 100.0% Never married0.0% Now married0.0% Separated0.0% Widowed0.0% DivorcedWomen who did not give birth in the past 12 months Now married:
0.0% (0)Unmarried:
100.0% (37)
Marital status - Asian population 15 years and over
Males 1.3% Never married98.7% Now married0.0% Separated0.0% Widowed0.0% DivorcedFemales 47.8% Never married52.2% Now married0.0% Separated0.0% Widowed0.0% DivorcedWomen who gave birth in the past 12 months Now married:
93.8% (15)Unmarried:
6.2% (1)
Women who did not give birth in the past 12 months Now married:
47.6% (70)Unmarried:
52.4% (77)
Marital status - Other race population 15 years and over
Males 49.4% Never married50.6% Now married0.0% Separated0.0% Widowed0.0% DivorcedFemales 0.0% Never married100.0% Now married0.0% Separated0.0% Widowed0.0% DivorcedWomen who did not give birth in the past 12 months Now married:
100.0% (22)Unmarried:
0.0% (0)
Marital status - Two or more races population 15 years and over
Males 65.4% Never married26.6% Now married1.4% Separated3.8% Widowed2.8% DivorcedFemales 60.0% Never married40.0% Now married0.0% Separated0.0% Widowed0.0% DivorcedWomen who did not give birth in the past 12 months Now married:
40.0% (52)Unmarried:
60.0% (78)
Marital status - White alone, not Hispanic / Latino population 15 years and over
Males 32.0% Never married60.8% Now married1.2% Separated1.1% Widowed4.8% DivorcedFemales 13.7% Never married66.3% Now married0.4% Separated7.6% Widowed12.0% DivorcedWomen who gave birth in the past 12 months Now married:
95.6% (351)Unmarried:
4.4% (16)
Women who did not give birth in the past 12 months Now married:
63.5% (2,305)Unmarried:
36.5% (1,326)
Marital status - Hispanic or Latino population 15 years and over
Males 65.2% Never married30.3% Now married4.5% Separated0.0% Widowed0.0% DivorcedFemales 29.8% Never married70.2% Now married0.0% Separated0.0% Widowed0.0% DivorcedWomen who did not give birth in the past 12 months Now married:
0.0% (0)Unmarried:
100.0% (38)
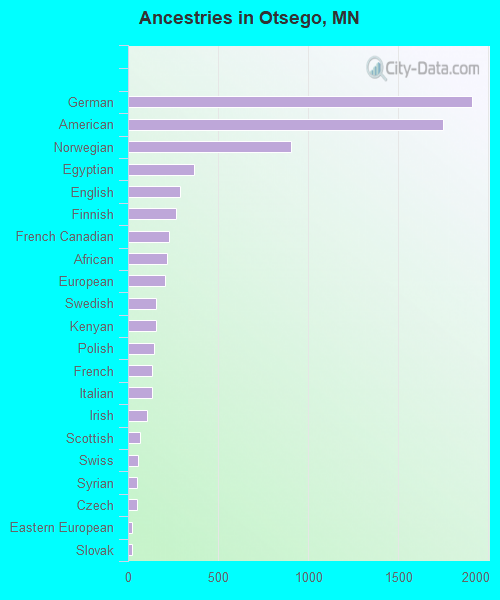
Ancestries in Otsego
1,910 21.7% German1,751 19.9% American903 10.3% Norwegian368 4.2% Egyptian287 3.3% English267 3.0% Finnish230 2.6% French Canadian218 2.5% African204 2.3% European155 1.8% Swedish154 1.8% Kenyan142 1.6% Polish136 1.5% French132 1.5% Italian104 1.2% Irish64 0.7% Scottish56 0.6% Swiss50 0.6% Syrian49 0.6% Czech23 0.3% Eastern European21 0.2% Slovak16 0.2% Northern European15 0.2% Scandinavian12 0.1% Russian10 0.1% British
Children Nativity (place of birth) in Otsego
Children under 6 years - Living with two parents Both parents native 1,737 100.0% NativeBoth parents foreign-born 144 100.0% NativeOne native, one foreign-born parent 26 100.0% NativeChildren under 6 years - Living with one parent Native parent 182 100.0% NativeForeign-born parent 16 100.0% NativeChildren 6 to 17 years - Living with two parents Both parents native 2,388 95.0% Native126 5.0% Foreign-bornBoth parents foreign-born 37 100.0% NativeOne native, one foreign-born parent 202 100.0% NativeChildren 6 to 17 years - Living with one parent Native parent 916 100.0% NativeForeign-born parent 18 50.4% Native17 49.6% Foreign-born
Grandparents responsible for own grandchildren in Otsego
Grandparents (30 to 59 years) White / Caucasian 205 100.0% Not responsible for grandchildrenWhite alone, not Hispanic / Latino 222 100.0% Not responsible for grandchildren
Grandparents (60 years and over) White / Caucasian 478 100.0% Not responsible for grandchildrenWhite alone, not Hispanic / Latino 478 100.0% Not responsible for grandchildren