Races in Osborne, Pennsylvania (PA) Detailed Stats
Ancestries, Foreign-born residents, place of birth

Recent posts about races in Osborne, Pennsylvania on our local forum with over 2,400,000 registered users:
 | Moving from Boston, Help us Pick an Area (23 replies) |
| Relocating North Pittsburgh (14 replies) |
| I am tired of hearing how great Pittsburgh is! (703 replies) |
| Buying a house around Pittsburgh (16 replies) |
| family potentially moving to Pittsburgh - neighborhoods to visit during trip (74 replies) |
| If Western PA county lines were originally drawn different... (15 replies) |
3.5% of Osborne, PA residents are foreign-born (2.7% born in Europe, 0.9% born in North America), which is 98.1% less than the foreign-born rate of 7.0% across the entire state of Pennsylvania.
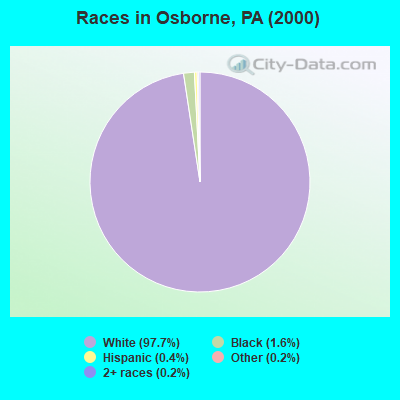
Race distribution in Osborne

- 55397.7%White alone
- 91.6%Black alone
- 20.4%Hispanic
- 10.2%Two or more races
- 10.2%Other race alone
2000
2022
-
- 10,322,45584.1%White alone
- 1,202,4379.8%Black alone
- 394,0883.2%Hispanic
- 218,2961.8%Asian alone
- 113,0970.9%Two or more races
- 13,0860.1%Other race alone
- 14,9040.1%American Indian alone
- 2,6910.02%Native Hawaiian and Other
Pacific Islander alone

-
- 9,487,22873.1%White alone
- 1,311,58110.1%Black alone
- 1,115,9978.6%Hispanic
- 493,9423.8%Two or more races
- 487,1243.8%Asian alone
- 63,5820.5%Other race alone
- 10,1300.08%American Indian alone
- 2,4240.02%Native Hawaiian and Other
Pacific Islander alone

Income and house value in Osborne
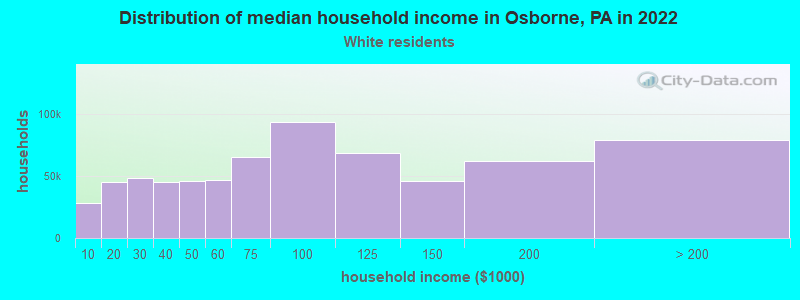
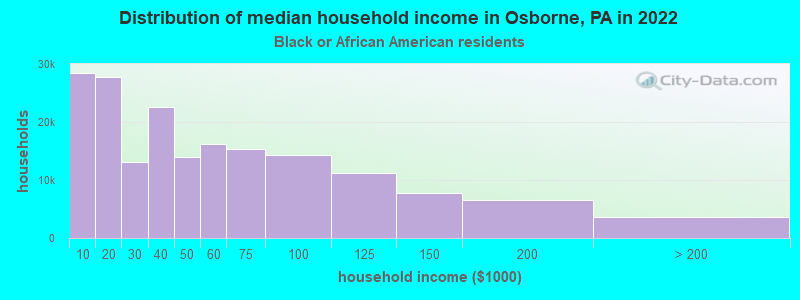
- Median household income in 2022
- $121,018White non-Hispanic householders
- $118,473Black householders
- Median 2022 house value
- $497,829White Non-Hispanic householders
- over $1,000,000Black or African American householders
Household income for White non-Hispanic householders
Household income for Black householders
Foreign-born residents in Osborne
20 residents are foreign born (2.7% Europe, 0.9% North America).
| This city: | 3.5% |
| Pennsylvania: | 4.1% |
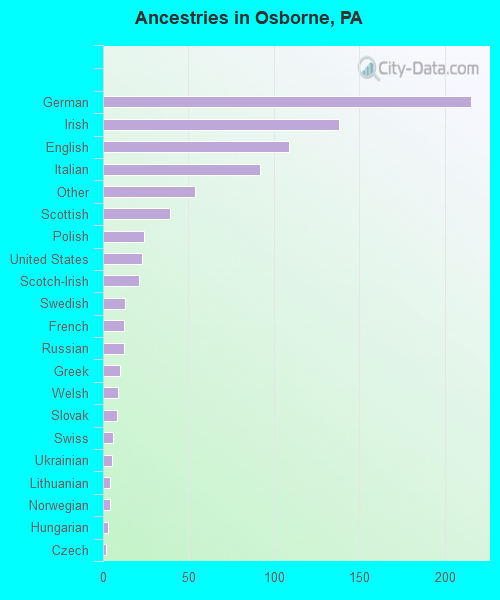
Ancestries in Osborne

- 21526.8%German
- 13817.2%Irish
- 10913.6%English
- 9211.5%Italian
- 546.7%Other
- 394.9%Scottish
- 243.0%Polish
- 232.9%United States
- 212.6%Scotch-Irish
- 131.6%Swedish
- 121.5%French
- 121.5%Russian
- 101.2%Greek
- 91.1%Welsh
- 81.0%Slovak
- 60.7%Swiss
- 50.6%Ukrainian
- 40.5%Lithuanian
- 40.5%Norwegian
- 30.4%Hungarian
- 20.2%Czech
Zip codes: 15143.