Races in Old Jefferson, Louisiana (LA) Detailed Stats
Data:
Races - White alone (%)
Races - White alone (% change since 2000)
Races - Black alone (%)
Races - Black alone (% change since 2000)
Races - American Indian alone (%)
Races - American Indian alone (% change since 2000)
Races - Asian alone (%)
Races - Asian alone (% change since 2000)
Races - Hispanic (%)
Races - Hispanic (% change since 2000)
Races - Native Hawaiian and Other Pacific Islander alone (%)
Races - Native Hawaiian and Other Pacific Islander alone (% change since 2000)
Races - Two or more races(%)
Races - Two or more races(% change since 2000)
Races - Other race alone (%)
Races - Other race alone (% change since 2000)
Racial diversity
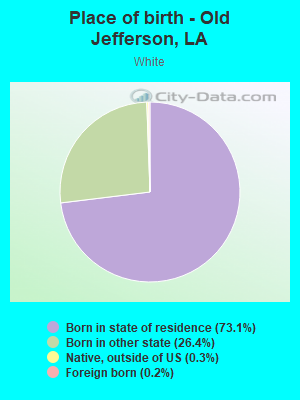
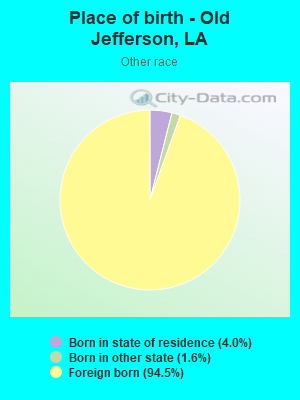
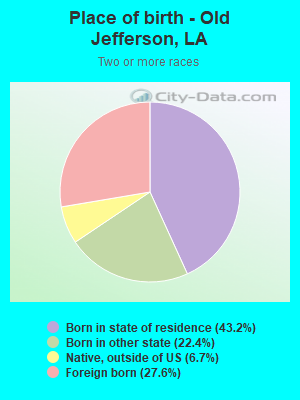
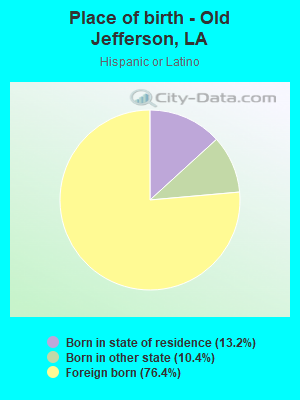
Place of birth - Born in state of residence (%)
Place of birth - Born in state of residence (%) - White
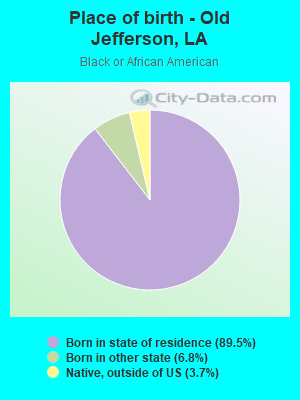
Place of birth - Born in state of residence (%) - Black or African American
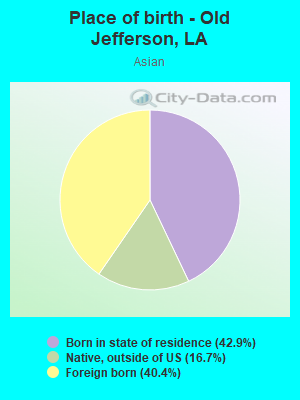
Place of birth - Born in state of residence (%) - Asian
Place of birth - Born in state of residence (%) - Hispanic or Latino
Place of birth - Born in state of residence (%) - American Indian and Alaska Native
Place of birth - Born in state of residence (%) - Multirace
Place of birth - Born in state of residence (%) - Other Race
Place of birth - Born in other state (%)
Place of birth - Born in other state (%) - White
Place of birth - Born in other state (%) - Black or African American
Place of birth - Born in other state (%) - Asian
Place of birth - Born in other state (%) - Hispanic or Latino
Place of birth - Born in other state (%) - American Indian and Alaska Native
Place of birth - Born in other state (%) - Multirace
Place of birth - Born in other state (%) - Other Race
Place of birth - Native, outside of US (%)
Place of birth - Native, outside of US (%) - White
Place of birth - Native, outside of US (%) - Black or African American
Place of birth - Native, outside of US (%) - Asian
Place of birth - Native, outside of US (%) - Hispanic or Latino
Place of birth - Native, outside of US (%) - American Indian and Alaska Native
Place of birth - Native, outside of US (%) - Multirace
Place of birth - Native, outside of US (%) - Other Race
Place of birth - Foreign born (%)
Place of birth - Foreign born (%) - White
Place of birth - Foreign born (%) - Black or African American
Place of birth - Foreign born (%) - Asian
Place of birth - Foreign born (%) - Hispanic or Latino
Place of birth - Foreign born (%) - American Indian and Alaska Native
Place of birth - Foreign born (%) - Multirace
Place of birth - Foreign born (%) - Other Race
Residents speaking English at home (%)
Residents speaking English at home - Born in the United States (%)
Residents speaking English at home - Native, born elsewhere (%)
Residents speaking English at home - Foreign born (%)
Residents speaking Spanish at home (%)
Residents speaking Spanish at home - Born in the United States (%)
Residents speaking Spanish at home - Native, born elsewhere (%)
Residents speaking Spanish at home - Foreign born (%)
Residents speaking other language at home (%)
Residents speaking other language at home - Born in the United States (%)
Residents speaking other language at home - Native, born elsewhere (%)
Residents speaking other language at home - Foreign born (%)
Marital status - Never married (%)
Marital status - Now married (%)
Marital status - Separated (%)
Marital status - Widowed (%)
Marital status - Divorced (%)
Ancestries Reported - Arab (%)
Ancestries Reported - Czech (%)
Ancestries Reported - Danish (%)
Ancestries Reported - Dutch (%)
Ancestries Reported - English (%)
Ancestries Reported - French (%)
Ancestries Reported - French Canadian (%)
Ancestries Reported - German (%)
Ancestries Reported - Greek (%)
Ancestries Reported - Hungarian (%)
Ancestries Reported - Irish (%)
Ancestries Reported - Italian (%)
Ancestries Reported - Lithuanian (%)
Ancestries Reported - Norwegian (%)
Ancestries Reported - Polish (%)
Ancestries Reported - Portuguese (%)
Ancestries Reported - Russian (%)
Ancestries Reported - Scotch-Irish (%)
Ancestries Reported - Scottish (%)
Ancestries Reported - Slovak (%)
Ancestries Reported - Subsaharan African (%)
Ancestries Reported - Swedish (%)
Ancestries Reported - Swiss (%)
Ancestries Reported - Ukrainian (%)
Ancestries Reported - United States (%)
Ancestries Reported - Welsh (%)
Ancestries Reported - West Indian (%)
Ancestries Reported - Other (%)
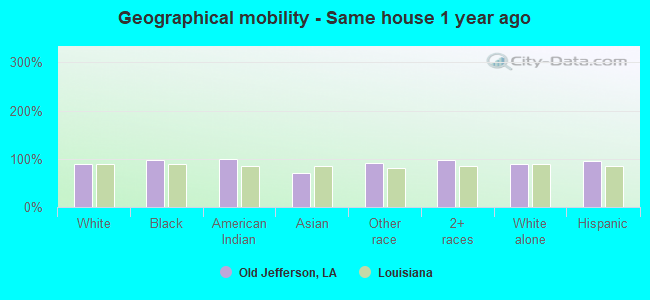
Geographical mobility - Same house 1 year ago (%)
Geographical mobility - Same house 1 year ago (%) - White
Geographical mobility - Same house 1 year ago (%) - Black or African American
Geographical mobility - Same house 1 year ago (%) - Asian
Geographical mobility - Same house 1 year ago (%) - Hispanic or Latino
Geographical mobility - Same house 1 year ago (%) - American Indian and Alaska Native
Geographical mobility - Same house 1 year ago (%) - Multirace
Geographical mobility - Same house 1 year ago (%) - Other Race
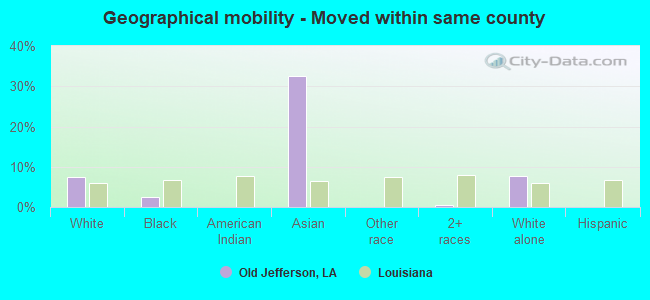
Geographical mobility - Moved within same county (%)
Geographical mobility - Moved within same county (%) - White
Geographical mobility - Moved within same county (%) - Black or African American
Geographical mobility - Moved within same county (%) - Asian
Geographical mobility - Moved within same county (%) - Hispanic or Latino
Geographical mobility - Moved within same county (%) - American Indian and Alaska Native
Geographical mobility - Moved within same county (%) - Multirace
Geographical mobility - Moved within same county (%) - Other Race
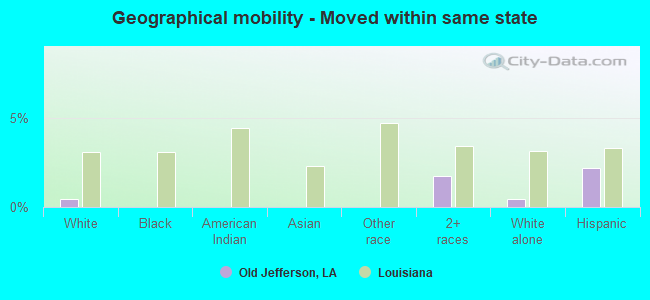
Geographical mobility - Moved from different county within same state (%)
Geographical mobility - Moved from different county within same state (%) - White
Geographical mobility - Moved from different county within same state (%) - Black or African American
Geographical mobility - Moved from different county within same state (%) - Asian
Geographical mobility - Moved from different county within same state (%) - Hispanic or Latino
Geographical mobility - Moved from different county within same state (%) - American Indian and Alaska Native
Geographical mobility - Moved from different county within same state (%) - Multirace
Geographical mobility - Moved from different county within same state (%) - Other Race
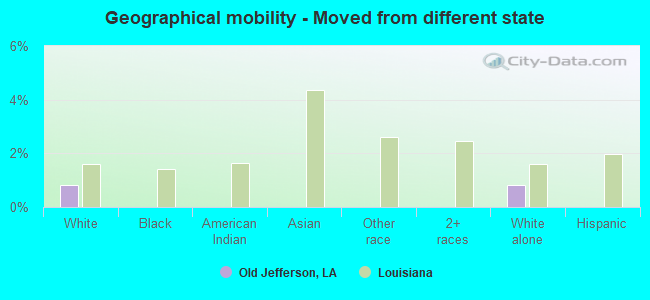
Geographical mobility - Moved from different state (%)
Geographical mobility - Moved from different state (%) - White
Geographical mobility - Moved from different state (%) - Black or African American
Geographical mobility - Moved from different state (%) - Asian
Geographical mobility - Moved from different state (%) - Hispanic or Latino
Geographical mobility - Moved from different state (%) - American Indian and Alaska Native
Geographical mobility - Moved from different state (%) - Multirace
Geographical mobility - Moved from different state (%) - Other Race
Geographical mobility - Moved from abroad (%)
Geographical mobility - Moved from abroad (%) - White
Geographical mobility - Moved from abroad (%) - Black or African American
Geographical mobility - Moved from abroad (%) - Asian
Geographical mobility - Moved from abroad (%) - Hispanic or Latino
Geographical mobility - Moved from abroad (%) - American Indian and Alaska Native
Geographical mobility - Moved from abroad (%) - Multirace
Geographical mobility - Moved from abroad (%) - Other Race
Place of birth for the foreign-born population - Ireland (%)
Place of birth for the foreign-born population - Denmark (%)
Place of birth for the foreign-born population - Norway (%)
Place of birth for the foreign-born population - Sweden (%)
Place of birth for the foreign-born population - United Kingdom (%)
Place of birth for the foreign-born population - England (%)
Place of birth for the foreign-born population - Scotland (%)
Place of birth for the foreign-born population - Other Northern Europe (%)
Place of birth for the foreign-born population - Austria (%)
Place of birth for the foreign-born population - Belgium (%)
Place of birth for the foreign-born population - France (%)
Place of birth for the foreign-born population - Germany (%)
Place of birth for the foreign-born population - Netherlands (%)
Place of birth for the foreign-born population - Switzerland (%)
Place of birth for the foreign-born population - Other Western Europe (%)
Place of birth for the foreign-born population - Greece (%)
Place of birth for the foreign-born population - Italy (%)
Place of birth for the foreign-born population - Portugal (%)
Place of birth for the foreign-born population - Spain (%)
Place of birth for the foreign-born population - Other Southern Europe (%)
Place of birth for the foreign-born population - Albania (%)
Place of birth for the foreign-born population - Belarus (%)
Place of birth for the foreign-born population - Bosnia and Herzegovina (%)
Place of birth for the foreign-born population - Bulgaria (%)
Place of birth for the foreign-born population - Croatia (%)
Place of birth for the foreign-born population - Czechoslovakia (%)
Place of birth for the foreign-born population - Hungary (%)
Place of birth for the foreign-born population - Latvia (%)
Place of birth for the foreign-born population - Lithuania (%)
Place of birth for the foreign-born population - North Macedonia (Macedonia) (%)
Place of birth for the foreign-born population - Moldova (%)
Place of birth for the foreign-born population - Poland (%)
Place of birth for the foreign-born population - Romania (%)
Place of birth for the foreign-born population - Russia (%)
Place of birth for the foreign-born population - Serbia (%)
Place of birth for the foreign-born population - Ukraine (%)
Place of birth for the foreign-born population - Other Eastern Europe (%)
Place of birth for the foreign-born population - China (%)
Place of birth for the foreign-born population - Hong Kong (%)
Place of birth for the foreign-born population - Taiwan (%)
Place of birth for the foreign-born population - Japan (%)
Place of birth for the foreign-born population - Korea (%)
Place of birth for the foreign-born population - Other Eastern Asia (%)
Place of birth for the foreign-born population - Afghanistan (%)
Place of birth for the foreign-born population - Bangladesh (%)
Place of birth for the foreign-born population - India (%)
Place of birth for the foreign-born population - Iran (%)
Place of birth for the foreign-born population - Kazakhstan (%)
Place of birth for the foreign-born population - Nepal (%)
Place of birth for the foreign-born population - Pakistan (%)
Place of birth for the foreign-born population - Sri Lanka (%)
Place of birth for the foreign-born population - Uzbekistan (%)
Place of birth for the foreign-born population - Other South Central Asia (%)
Place of birth for the foreign-born population - Burma (%)
Place of birth for the foreign-born population - Cambodia (%)
Place of birth for the foreign-born population - Indonesia (%)
Place of birth for the foreign-born population - Laos (%)
Place of birth for the foreign-born population - Malaysia (%)
Place of birth for the foreign-born population - Philippines (%)
Place of birth for the foreign-born population - Singapore (%)
Place of birth for the foreign-born population - Thailand (%)
Place of birth for the foreign-born population - Vietnam (%)
Place of birth for the foreign-born population - Other South Eastern Asia (%)
Place of birth for the foreign-born population - Armenia (%)
Place of birth for the foreign-born population - Iraq (%)
Place of birth for the foreign-born population - Israel (%)
Place of birth for the foreign-born population - Jordan (%)
Place of birth for the foreign-born population - Kuwait (%)
Place of birth for the foreign-born population - Lebanon (%)
Place of birth for the foreign-born population - Saudi Arabia (%)
Place of birth for the foreign-born population - Syria (%)
Place of birth for the foreign-born population - Turkey (%)
Place of birth for the foreign-born population - Yemen (%)
Place of birth for the foreign-born population - Other Western Asia (%)
Place of birth for the foreign-born population - Eritrea (%)
Place of birth for the foreign-born population - Ethiopia (%)
Place of birth for the foreign-born population - Kenya (%)
Place of birth for the foreign-born population - Somalia (%)
Place of birth for the foreign-born population - Uganda (%)
Place of birth for the foreign-born population - Zimbabwe (%)
Place of birth for the foreign-born population - Other Eastern Africa (%)
Place of birth for the foreign-born population - Cameroon (%)
Place of birth for the foreign-born population - Congo (%)
Place of birth for the foreign-born population - Democratic Republic of Congo (Zaire) (%)
Place of birth for the foreign-born population - Other Middle Africa (%)
Place of birth for the foreign-born population - Egypt (%)
Place of birth for the foreign-born population - Morocco (%)
Place of birth for the foreign-born population - Sudan (%)
Place of birth for the foreign-born population - Other Northern Africa (%)
Place of birth for the foreign-born population - South Africa (%)
Place of birth for the foreign-born population - Other Southern Africa (%)
Place of birth for the foreign-born population - Cabo Verde (%)
Place of birth for the foreign-born population - Ghana (%)
Place of birth for the foreign-born population - Liberia (%)
Place of birth for the foreign-born population - Nigeria (%)
Place of birth for the foreign-born population - Senegal (%)
Place of birth for the foreign-born population - Sierra Leone (%)
Place of birth for the foreign-born population - Other Western Africa (%)
Place of birth for the foreign-born population - Australia (%)
Place of birth for the foreign-born population - New Zealand (%)
Place of birth for the foreign-born population - Fiji (%)
Place of birth for the foreign-born population - Micronesia (%)
Place of birth for the foreign-born population - Bahamas (%)
Place of birth for the foreign-born population - Barbados (%)
Place of birth for the foreign-born population - Cuba (%)
Place of birth for the foreign-born population - Dominica (%)
Place of birth for the foreign-born population - Dominican Republic (%)
Place of birth for the foreign-born population - Grenada (%)
Place of birth for the foreign-born population - Haiti (%)
Place of birth for the foreign-born population - Jamaica (%)
Place of birth for the foreign-born population - St. Vincent and the Grenadines (%)
Place of birth for the foreign-born population - Trinidad and Tobago (%)
Place of birth for the foreign-born population - West Indies (%)
Place of birth for the foreign-born population - Other Caribbean (%)
Place of birth for the foreign-born population - Belize (%)
Place of birth for the foreign-born population - Costa Rica (%)
Place of birth for the foreign-born population - El Salvador (%)
Place of birth for the foreign-born population - Guatemala (%)
Place of birth for the foreign-born population - Honduras (%)
Place of birth for the foreign-born population - Mexico (%)
Place of birth for the foreign-born population - Nicaragua (%)
Place of birth for the foreign-born population - Panama (%)
Place of birth for the foreign-born population - Other Central America (%)
Place of birth for the foreign-born population - Argentina (%)
Place of birth for the foreign-born population - Bolivia (%)
Place of birth for the foreign-born population - Brazil (%)
Place of birth for the foreign-born population - Chile (%)
Place of birth for the foreign-born population - Colombia (%)
Place of birth for the foreign-born population - Ecuador (%)
Place of birth for the foreign-born population - Guyana (%)
Place of birth for the foreign-born population - Peru (%)
Place of birth for the foreign-born population - Uruguay (%)
Place of birth for the foreign-born population - Venezuela (%)
Place of birth for the foreign-born population - Other South America (%)
Place of birth for the foreign-born population - Canada (%)
Place of birth for the foreign-born population - Other Northern America (%)
Place of birth for the foreign-born population - Other (%)
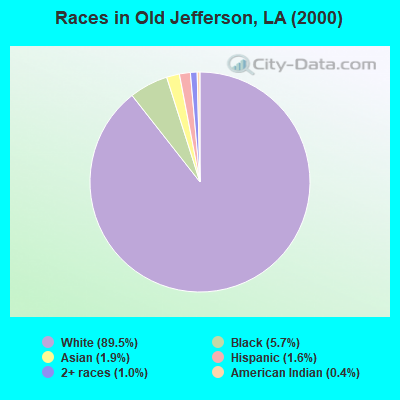
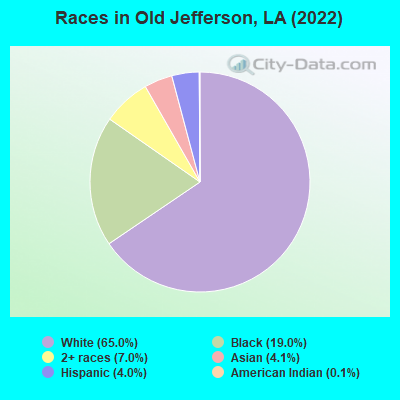
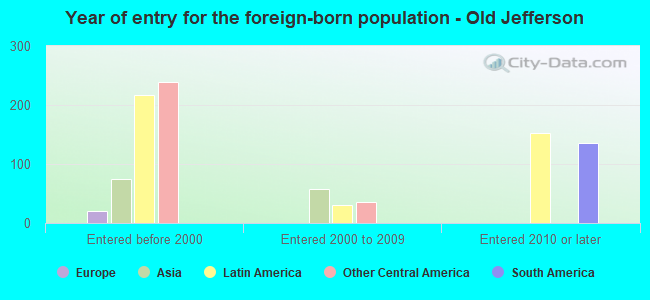
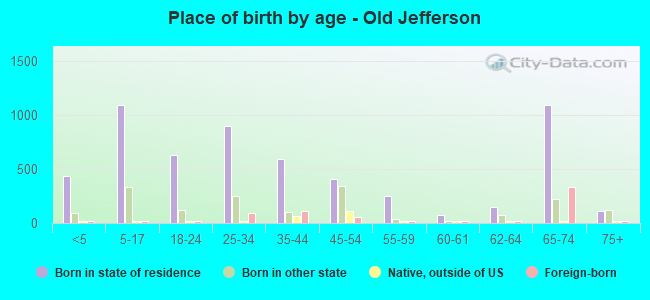
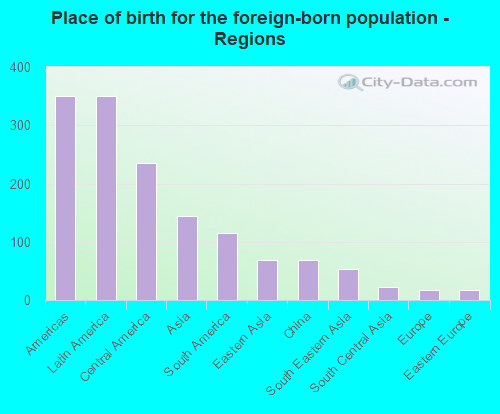
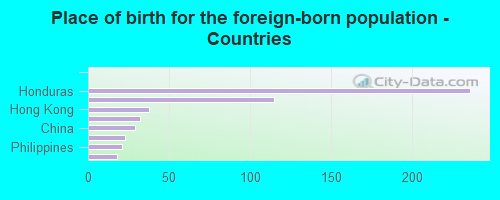
According to 2022 data, the most numerous races in Old Jefferson, LA are White alone (5,257 residents), Black alone (1,537 residents), and Hispanic (326 residents). 91.7% of Old Jefferson residents speak English at home. 6.4% of Old Jefferson, LA residents are foreign-born (4.2% born in Latin America, 1.7% born in Asia), which is 37.3% greater than the foreign-born rate of 4.0% across the entire state of Louisiana.
Race distribution in Old Jefferson
2000 2022
2,794,391 62.5% White alone 1,443,390 32.3% Black alone 107,738 2.4% Hispanic 54,256 1.2% Asian alone 39,260 0.9% Two or more races 24,129 0.5% American Indian alone 4,736 0.1% Other race alone 1,076 0.02% Native Hawaiian and Other
2,603,221 56.7% White alone 1,420,055 30.9% Black alone 262,213 5.7% Hispanic 183,270 4.0% Two or more races 81,169 1.8% Asian alone 19,991 0.4% American Indian alone 18,043 0.4% Other race alone 2,279 0.05% Native Hawaiian and Other
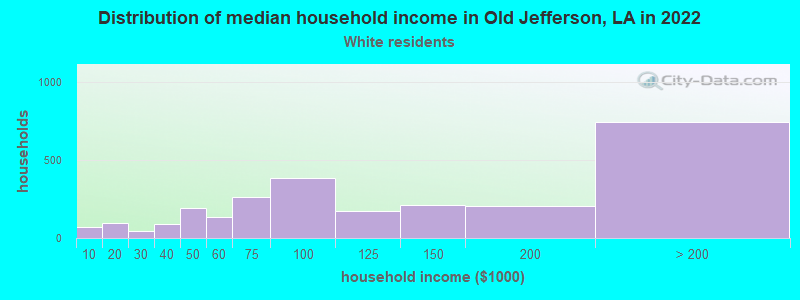
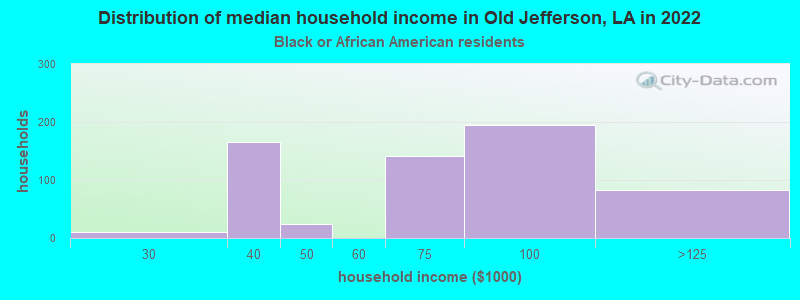
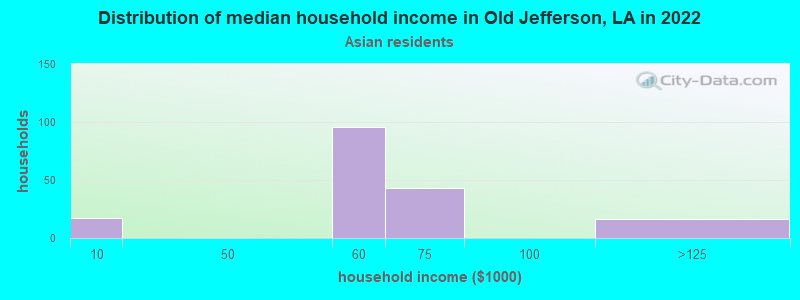
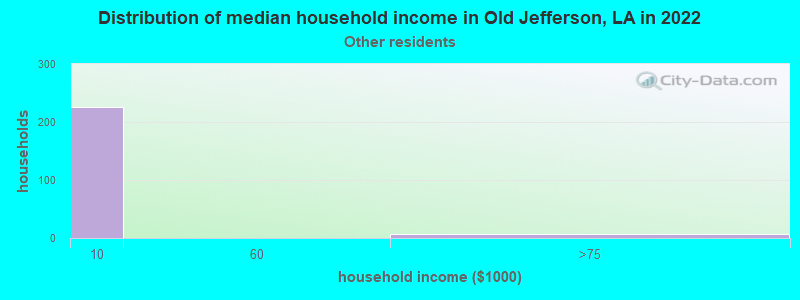
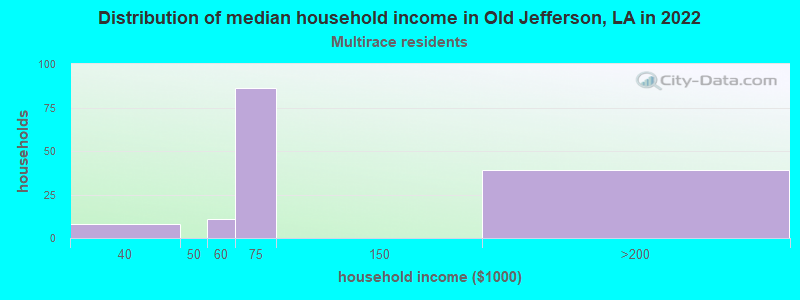
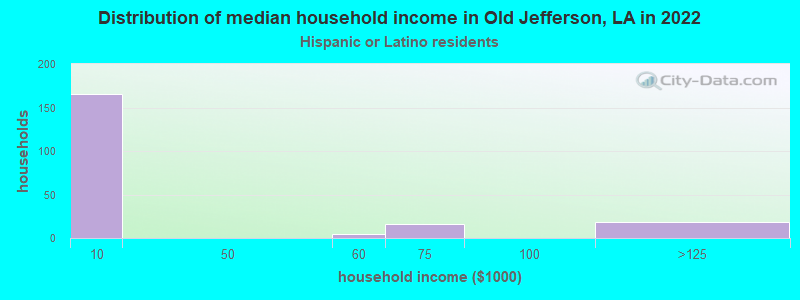
Income and house value in Old Jefferson Median household income in 2022 $114,693 White non-Hispanic householders$66,742 Black householders$56,853 Asian householders$83,296 Two or more races householders$2,615 Hispanic or Latino race householdersMedian 2022 house value $207,632 White Non-Hispanic householders$201,044 Black or African American householders$201,894 American Indian or Alaska Native householders $178,304 Asian householders$201,894 Hispanic or Latino householders
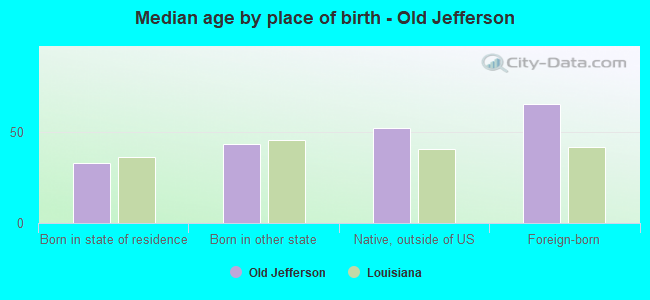
Median age by race in Old Jefferson
46.5 Median age for White residents52.4 46.2 25.4 Median age for Black or African American residents20.0 30.1 -736,637,511.4 Median age for American Indian / Alaska Native residents-666,666,666.0 -1,445,312,498.6 41.4 Median age for Asian residents35.9 44.1 -666,666,666.0 Median age for Native Hawaiian / Pacific Islander residents-666,666,666.0 -666,666,666.0 65.2 Median age for Other race residents43.9 54.8 19.1 Median age for Two or more races residents12.7 21.9 45.9 Median age for White alone residents52.2 45.3 63.9 Median age for Hispanic or Latino residents46.5 65.5
Owner/renter occupied households by race in Old Jefferson
House owners and renters - White residents 2,325 86.8% Owner occupied353 13.2% Renter occupiedHouse owners and renters - Black or African American residents 267 46.3% Owner occupied310 53.7% Renter occupiedHouse owners and renters - American Indian / Alaska Native residents 9 100.0% Renter occupiedHouse owners and renters - Asian residents 164 89.1% Owner occupied20 10.9% Renter occupiedHouse owners and renters - Other race residents 219 100.0% Renter occupiedHouse owners and renters - Two or more races residents 51 54.0% Owner occupied44 46.0% Renter occupiedHouse owners and renters - White alone residents 2,325 86.6% Owner occupied360 13.4% Renter occupiedHouse owners and renters - Hispanic or Latino residents 27 11.0% Owner occupied216 89.0% Renter occupied
Language usage in Old Jefferson
English speakers - Total 91.7% of residents of Old Jefferson speak English at home.
4.0% of residents speak Spanish at home 24 7.8% Speak English very well282 92.2% Speak English less than very well4.8% of residents speak other language at home 252 69.8% Speak English very well109 30.2% Speak English less than very well
All residents speak only English at home
English speakers - Native, born elsewhere 97.2% of residents of Old Jefferson speak English at home.
English speakers - Foreign-born 6.5% of residents of Old Jefferson speak English at home.
50.9% of residents speak Spanish at home 4 1.5% Speak English very well271 98.5% Speak English less than very well48.3% of residents speak other language at home 227 87.0% Speak English very well34 13.0% Speak English less than very well
White (Caucasian) - Speak another language Native:
0.5% (26)Foreign-born:
100.0% (13)
Asian - Speak only English Native:
60.7% (122)Foreign-born:
28.3% (41)
Asian - Speak another language Native:
39.4% (79)Foreign-born:
66.0% (95)
Other race - Speak another language Native:
52.4% (7)Foreign-born:
100.0% (302)
Two or more races - Speak another language Native:
2.5% (9)Foreign-born:
100.0% (197)
White alone - Speak another language Native:
0.6% (30)Foreign-born:
100.0% (16)
Hispanic or Latino - Speak another language Native:
18.7% (14)Foreign-born:
100.0% (264)
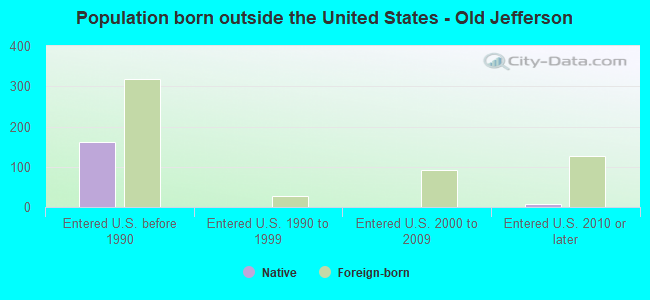
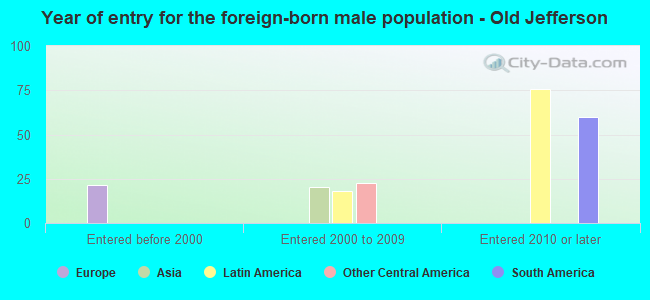
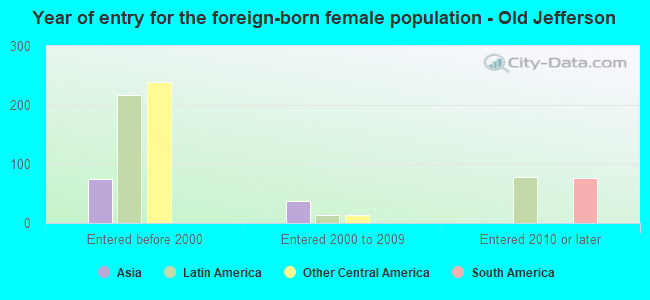
Foreign-born residents in Old Jefferson 516 residents are foreign born (4.2% Latin America , 1.7% Asia ).
This city:
6.4%Louisiana:
4.2%
Marital status for residents in Old Jefferson Marital status - White (Caucasian) population 15 years and over
Males 21.3% Never married41.7% Now married0.7% Separated1.1% Widowed35.1% DivorcedFemales 26.7% Never married47.4% Now married0.0% Separated5.6% Widowed20.3% DivorcedWomen who gave birth in the past 12 months Now married:
100.0% (24)Unmarried:
0.0% (0)
Women who did not give birth in the past 12 months Now married:
45.6% (471)Unmarried:
54.4% (561)
Marital status - Black or African American population 15 years and over
Males 72.7% Never married21.1% Now married0.0% Separated2.5% Widowed3.7% DivorcedFemales 55.6% Never married17.6% Now married7.9% Separated2.1% Widowed16.8% DivorcedWomen who gave birth in the past 12 months Now married:
100.0% (50)Unmarried:
0.0% (0)
Women who did not give birth in the past 12 months Now married:
14.3% (73)Unmarried:
85.7% (436)
Marital status - Asian population 15 years and over
Males 65.0% Never married35.0% Now married0.0% Separated0.0% Widowed0.0% DivorcedFemales 29.5% Never married57.2% Now married0.0% Separated0.0% Widowed13.3% DivorcedWomen who did not give birth in the past 12 months Now married:
28.2% (32)Unmarried:
71.8% (81)
Marital status - Other race population 15 years and over
Males 61.1% Never married38.9% Now married0.0% Separated0.0% Widowed0.0% DivorcedFemales 2.3% Never married5.9% Now married0.0% Separated91.8% Widowed0.0% DivorcedWomen who did not give birth in the past 12 months Now married:
72.2% (18)Unmarried:
27.8% (7)
Marital status - Two or more races population 15 years and over
Males 34.1% Never married51.6% Now married0.0% Separated0.0% Widowed14.3% DivorcedFemales 37.4% Never married47.3% Now married0.0% Separated0.0% Widowed15.3% DivorcedWomen who gave birth in the past 12 months Now married:
100.0% (35)Unmarried:
0.0% (0)
Women who did not give birth in the past 12 months Now married:
44.5% (85)Unmarried:
55.5% (106)
Marital status - White alone, not Hispanic / Latino population 15 years and over
Males 21.5% Never married41.4% Now married0.7% Separated1.1% Widowed35.4% DivorcedFemales 26.9% Never married47.0% Now married0.0% Separated5.6% Widowed20.5% DivorcedWomen who gave birth in the past 12 months Now married:
100.0% (24)Unmarried:
0.0% (0)
Women who did not give birth in the past 12 months Now married:
44.8% (460)Unmarried:
55.2% (567)
Marital status - Hispanic or Latino population 15 years and over
Males 33.3% Never married66.7% Now married0.0% Separated0.0% Widowed0.0% DivorcedFemales 7.1% Never married11.3% Now married0.0% Separated75.9% Widowed5.6% DivorcedWomen who did not give birth in the past 12 months Now married:
61.2% (31)Unmarried:
38.8% (20)
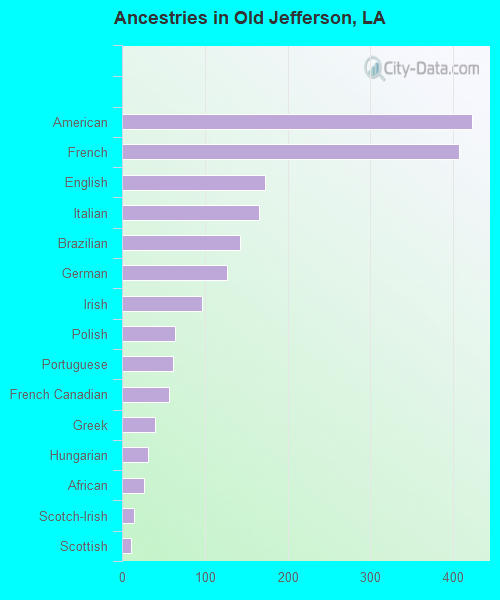
Ancestries in Old Jefferson
422 12.5% American407 12.1% French173 5.1% English165 4.9% Italian143 4.2% Brazilian127 3.8% German96 2.9% Irish64 1.9% Polish62 1.8% Portuguese57 1.7% French Canadian40 1.2% Greek31 0.9% Hungarian27 0.8% African14 0.4% Scotch-Irish11 0.3% Scottish
Children Nativity (place of birth) in Old Jefferson
Children under 6 years - Living with two parents Both parents native 224 100.0% NativeBoth parents foreign-born 210 100.0% NativeChildren under 6 years - Living with one parent Native parent 125 100.0% NativeChildren 6 to 17 years - Living with two parents Both parents native 679 100.0% NativeBoth parents foreign-born 7 100.0% NativeOne native, one foreign-born parent 58 100.0% NativeChildren 6 to 17 years - Living with one parent Native parent 427 100.0% NativeForeign-born parent 31 48.1% Native33 51.9% Foreign-born
Grandparents responsible for own grandchildren in Old Jefferson
Grandparents (30 to 59 years) White / Caucasian 39 100.0% Not responsible for grandchildrenBlack or African American 10 100.0% Responsible for grandchildrenWhite alone, not Hispanic / Latino 41 100.0% Not responsible for grandchildrenGrandparents (60 years and over) White / Caucasian 17 24.8% Responsible for grandchildren52 75.2% Not responsible for grandchildrenBlack or African American 13 100.0% Responsible for grandchildrenWhite alone, not Hispanic / Latino 17 24.7% Responsible for grandchildren53 75.3% Not responsible for grandchildren