Races in Ocean City, Florida (FL) Detailed Stats
Data:
Races - White alone (%)
Races - White alone (% change since 2000)
Races - Black alone (%)
Races - Black alone (% change since 2000)
Races - American Indian alone (%)
Races - American Indian alone (% change since 2000)
Races - Asian alone (%)
Races - Asian alone (% change since 2000)
Races - Hispanic (%)
Races - Hispanic (% change since 2000)
Races - Native Hawaiian and Other Pacific Islander alone (%)
Races - Native Hawaiian and Other Pacific Islander alone (% change since 2000)
Races - Two or more races(%)
Races - Two or more races(% change since 2000)
Races - Other race alone (%)
Races - Other race alone (% change since 2000)
Racial diversity
Place of birth - Born in state of residence (%)
Place of birth - Born in state of residence (%) - White
Place of birth - Born in state of residence (%) - Black or African American
Place of birth - Born in state of residence (%) - Asian
Place of birth - Born in state of residence (%) - Hispanic or Latino
Place of birth - Born in state of residence (%) - American Indian and Alaska Native
Place of birth - Born in state of residence (%) - Multirace
Place of birth - Born in state of residence (%) - Other Race
Place of birth - Born in other state (%)
Place of birth - Born in other state (%) - White
Place of birth - Born in other state (%) - Black or African American
Place of birth - Born in other state (%) - Asian
Place of birth - Born in other state (%) - Hispanic or Latino
Place of birth - Born in other state (%) - American Indian and Alaska Native
Place of birth - Born in other state (%) - Multirace
Place of birth - Born in other state (%) - Other Race
Place of birth - Native, outside of US (%)
Place of birth - Native, outside of US (%) - White
Place of birth - Native, outside of US (%) - Black or African American
Place of birth - Native, outside of US (%) - Asian
Place of birth - Native, outside of US (%) - Hispanic or Latino
Place of birth - Native, outside of US (%) - American Indian and Alaska Native
Place of birth - Native, outside of US (%) - Multirace
Place of birth - Native, outside of US (%) - Other Race
Place of birth - Foreign born (%)
Place of birth - Foreign born (%) - White
Place of birth - Foreign born (%) - Black or African American
Place of birth - Foreign born (%) - Asian
Place of birth - Foreign born (%) - Hispanic or Latino
Place of birth - Foreign born (%) - American Indian and Alaska Native
Place of birth - Foreign born (%) - Multirace
Place of birth - Foreign born (%) - Other Race
Residents speaking English at home (%)
Residents speaking English at home - Born in the United States (%)
Residents speaking English at home - Native, born elsewhere (%)
Residents speaking English at home - Foreign born (%)
Residents speaking Spanish at home (%)
Residents speaking Spanish at home - Born in the United States (%)
Residents speaking Spanish at home - Native, born elsewhere (%)
Residents speaking Spanish at home - Foreign born (%)
Residents speaking other language at home (%)
Residents speaking other language at home - Born in the United States (%)
Residents speaking other language at home - Native, born elsewhere (%)
Residents speaking other language at home - Foreign born (%)
Marital status - Never married (%)
Marital status - Now married (%)
Marital status - Separated (%)
Marital status - Widowed (%)
Marital status - Divorced (%)
Ancestries Reported - Arab (%)
Ancestries Reported - Czech (%)
Ancestries Reported - Danish (%)
Ancestries Reported - Dutch (%)
Ancestries Reported - English (%)
Ancestries Reported - French (%)
Ancestries Reported - French Canadian (%)
Ancestries Reported - German (%)
Ancestries Reported - Greek (%)
Ancestries Reported - Hungarian (%)
Ancestries Reported - Irish (%)
Ancestries Reported - Italian (%)
Ancestries Reported - Lithuanian (%)
Ancestries Reported - Norwegian (%)
Ancestries Reported - Polish (%)
Ancestries Reported - Portuguese (%)
Ancestries Reported - Russian (%)
Ancestries Reported - Scotch-Irish (%)
Ancestries Reported - Scottish (%)
Ancestries Reported - Slovak (%)
Ancestries Reported - Subsaharan African (%)
Ancestries Reported - Swedish (%)
Ancestries Reported - Swiss (%)
Ancestries Reported - Ukrainian (%)
Ancestries Reported - United States (%)
Ancestries Reported - Welsh (%)
Ancestries Reported - West Indian (%)
Ancestries Reported - Other (%)
Geographical mobility - Same house 1 year ago (%)
Geographical mobility - Same house 1 year ago (%) - White
Geographical mobility - Same house 1 year ago (%) - Black or African American
Geographical mobility - Same house 1 year ago (%) - Asian
Geographical mobility - Same house 1 year ago (%) - Hispanic or Latino
Geographical mobility - Same house 1 year ago (%) - American Indian and Alaska Native
Geographical mobility - Same house 1 year ago (%) - Multirace
Geographical mobility - Same house 1 year ago (%) - Other Race
Geographical mobility - Moved within same county (%)
Geographical mobility - Moved within same county (%) - White
Geographical mobility - Moved within same county (%) - Black or African American
Geographical mobility - Moved within same county (%) - Asian
Geographical mobility - Moved within same county (%) - Hispanic or Latino
Geographical mobility - Moved within same county (%) - American Indian and Alaska Native
Geographical mobility - Moved within same county (%) - Multirace
Geographical mobility - Moved within same county (%) - Other Race
Geographical mobility - Moved from different county within same state (%)
Geographical mobility - Moved from different county within same state (%) - White
Geographical mobility - Moved from different county within same state (%) - Black or African American
Geographical mobility - Moved from different county within same state (%) - Asian
Geographical mobility - Moved from different county within same state (%) - Hispanic or Latino
Geographical mobility - Moved from different county within same state (%) - American Indian and Alaska Native
Geographical mobility - Moved from different county within same state (%) - Multirace
Geographical mobility - Moved from different county within same state (%) - Other Race
Geographical mobility - Moved from different state (%)
Geographical mobility - Moved from different state (%) - White
Geographical mobility - Moved from different state (%) - Black or African American
Geographical mobility - Moved from different state (%) - Asian
Geographical mobility - Moved from different state (%) - Hispanic or Latino
Geographical mobility - Moved from different state (%) - American Indian and Alaska Native
Geographical mobility - Moved from different state (%) - Multirace
Geographical mobility - Moved from different state (%) - Other Race
Geographical mobility - Moved from abroad (%)
Geographical mobility - Moved from abroad (%) - White
Geographical mobility - Moved from abroad (%) - Black or African American
Geographical mobility - Moved from abroad (%) - Asian
Geographical mobility - Moved from abroad (%) - Hispanic or Latino
Geographical mobility - Moved from abroad (%) - American Indian and Alaska Native
Geographical mobility - Moved from abroad (%) - Multirace
Geographical mobility - Moved from abroad (%) - Other Race
Place of birth for the foreign-born population - Ireland (%)
Place of birth for the foreign-born population - Denmark (%)
Place of birth for the foreign-born population - Norway (%)
Place of birth for the foreign-born population - Sweden (%)
Place of birth for the foreign-born population - United Kingdom (%)
Place of birth for the foreign-born population - England (%)
Place of birth for the foreign-born population - Scotland (%)
Place of birth for the foreign-born population - Other Northern Europe (%)
Place of birth for the foreign-born population - Austria (%)
Place of birth for the foreign-born population - Belgium (%)
Place of birth for the foreign-born population - France (%)
Place of birth for the foreign-born population - Germany (%)
Place of birth for the foreign-born population - Netherlands (%)
Place of birth for the foreign-born population - Switzerland (%)
Place of birth for the foreign-born population - Other Western Europe (%)
Place of birth for the foreign-born population - Greece (%)
Place of birth for the foreign-born population - Italy (%)
Place of birth for the foreign-born population - Portugal (%)
Place of birth for the foreign-born population - Spain (%)
Place of birth for the foreign-born population - Other Southern Europe (%)
Place of birth for the foreign-born population - Albania (%)
Place of birth for the foreign-born population - Belarus (%)
Place of birth for the foreign-born population - Bosnia and Herzegovina (%)
Place of birth for the foreign-born population - Bulgaria (%)
Place of birth for the foreign-born population - Croatia (%)
Place of birth for the foreign-born population - Czechoslovakia (%)
Place of birth for the foreign-born population - Hungary (%)
Place of birth for the foreign-born population - Latvia (%)
Place of birth for the foreign-born population - Lithuania (%)
Place of birth for the foreign-born population - North Macedonia (Macedonia) (%)
Place of birth for the foreign-born population - Moldova (%)
Place of birth for the foreign-born population - Poland (%)
Place of birth for the foreign-born population - Romania (%)
Place of birth for the foreign-born population - Russia (%)
Place of birth for the foreign-born population - Serbia (%)
Place of birth for the foreign-born population - Ukraine (%)
Place of birth for the foreign-born population - Other Eastern Europe (%)
Place of birth for the foreign-born population - China (%)
Place of birth for the foreign-born population - Hong Kong (%)
Place of birth for the foreign-born population - Taiwan (%)
Place of birth for the foreign-born population - Japan (%)
Place of birth for the foreign-born population - Korea (%)
Place of birth for the foreign-born population - Other Eastern Asia (%)
Place of birth for the foreign-born population - Afghanistan (%)
Place of birth for the foreign-born population - Bangladesh (%)
Place of birth for the foreign-born population - India (%)
Place of birth for the foreign-born population - Iran (%)
Place of birth for the foreign-born population - Kazakhstan (%)
Place of birth for the foreign-born population - Nepal (%)
Place of birth for the foreign-born population - Pakistan (%)
Place of birth for the foreign-born population - Sri Lanka (%)
Place of birth for the foreign-born population - Uzbekistan (%)
Place of birth for the foreign-born population - Other South Central Asia (%)
Place of birth for the foreign-born population - Burma (%)
Place of birth for the foreign-born population - Cambodia (%)
Place of birth for the foreign-born population - Indonesia (%)
Place of birth for the foreign-born population - Laos (%)
Place of birth for the foreign-born population - Malaysia (%)
Place of birth for the foreign-born population - Philippines (%)
Place of birth for the foreign-born population - Singapore (%)
Place of birth for the foreign-born population - Thailand (%)
Place of birth for the foreign-born population - Vietnam (%)
Place of birth for the foreign-born population - Other South Eastern Asia (%)
Place of birth for the foreign-born population - Armenia (%)
Place of birth for the foreign-born population - Iraq (%)
Place of birth for the foreign-born population - Israel (%)
Place of birth for the foreign-born population - Jordan (%)
Place of birth for the foreign-born population - Kuwait (%)
Place of birth for the foreign-born population - Lebanon (%)
Place of birth for the foreign-born population - Saudi Arabia (%)
Place of birth for the foreign-born population - Syria (%)
Place of birth for the foreign-born population - Turkey (%)
Place of birth for the foreign-born population - Yemen (%)
Place of birth for the foreign-born population - Other Western Asia (%)
Place of birth for the foreign-born population - Eritrea (%)
Place of birth for the foreign-born population - Ethiopia (%)
Place of birth for the foreign-born population - Kenya (%)
Place of birth for the foreign-born population - Somalia (%)
Place of birth for the foreign-born population - Uganda (%)
Place of birth for the foreign-born population - Zimbabwe (%)
Place of birth for the foreign-born population - Other Eastern Africa (%)
Place of birth for the foreign-born population - Cameroon (%)
Place of birth for the foreign-born population - Congo (%)
Place of birth for the foreign-born population - Democratic Republic of Congo (Zaire) (%)
Place of birth for the foreign-born population - Other Middle Africa (%)
Place of birth for the foreign-born population - Egypt (%)
Place of birth for the foreign-born population - Morocco (%)
Place of birth for the foreign-born population - Sudan (%)
Place of birth for the foreign-born population - Other Northern Africa (%)
Place of birth for the foreign-born population - South Africa (%)
Place of birth for the foreign-born population - Other Southern Africa (%)
Place of birth for the foreign-born population - Cabo Verde (%)
Place of birth for the foreign-born population - Ghana (%)
Place of birth for the foreign-born population - Liberia (%)
Place of birth for the foreign-born population - Nigeria (%)
Place of birth for the foreign-born population - Senegal (%)
Place of birth for the foreign-born population - Sierra Leone (%)
Place of birth for the foreign-born population - Other Western Africa (%)
Place of birth for the foreign-born population - Australia (%)
Place of birth for the foreign-born population - New Zealand (%)
Place of birth for the foreign-born population - Fiji (%)
Place of birth for the foreign-born population - Micronesia (%)
Place of birth for the foreign-born population - Bahamas (%)
Place of birth for the foreign-born population - Barbados (%)
Place of birth for the foreign-born population - Cuba (%)
Place of birth for the foreign-born population - Dominica (%)
Place of birth for the foreign-born population - Dominican Republic (%)
Place of birth for the foreign-born population - Grenada (%)
Place of birth for the foreign-born population - Haiti (%)
Place of birth for the foreign-born population - Jamaica (%)
Place of birth for the foreign-born population - St. Vincent and the Grenadines (%)
Place of birth for the foreign-born population - Trinidad and Tobago (%)
Place of birth for the foreign-born population - West Indies (%)
Place of birth for the foreign-born population - Other Caribbean (%)
Place of birth for the foreign-born population - Belize (%)
Place of birth for the foreign-born population - Costa Rica (%)
Place of birth for the foreign-born population - El Salvador (%)
Place of birth for the foreign-born population - Guatemala (%)
Place of birth for the foreign-born population - Honduras (%)
Place of birth for the foreign-born population - Mexico (%)
Place of birth for the foreign-born population - Nicaragua (%)
Place of birth for the foreign-born population - Panama (%)
Place of birth for the foreign-born population - Other Central America (%)
Place of birth for the foreign-born population - Argentina (%)
Place of birth for the foreign-born population - Bolivia (%)
Place of birth for the foreign-born population - Brazil (%)
Place of birth for the foreign-born population - Chile (%)
Place of birth for the foreign-born population - Colombia (%)
Place of birth for the foreign-born population - Ecuador (%)
Place of birth for the foreign-born population - Guyana (%)
Place of birth for the foreign-born population - Peru (%)
Place of birth for the foreign-born population - Uruguay (%)
Place of birth for the foreign-born population - Venezuela (%)
Place of birth for the foreign-born population - Other South America (%)
Place of birth for the foreign-born population - Canada (%)
Place of birth for the foreign-born population - Other Northern America (%)
Place of birth for the foreign-born population - Other (%)
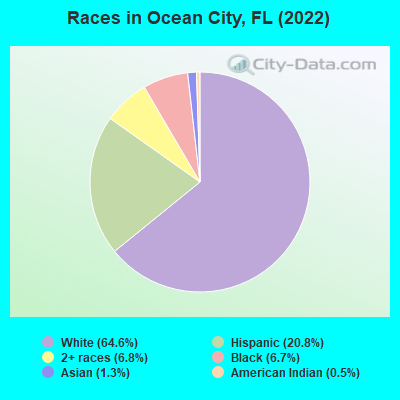
According to 2022 data, the most numerous races in Ocean City, FL are White alone (4,027 residents), Hispanic (1,298 residents), and Black alone (416 residents). 82.7% of Ocean City residents speak English at home. 17.3% of Ocean City, FL residents are foreign-born (13.2% born in Latin America, 2.1% born in Europe), which is 21.3% less than the foreign-born rate of 21.0% across the entire state of Florida.
Race distribution in Ocean City
2000 2022
10,458,509 65.4% White alone 2,682,715 16.8% Hispanic 2,264,268 14.2% Black alone 261,693 1.6% Asian alone 236,954 1.5% Two or more races 42,358 0.3% American Indian alone 28,994 0.2% Other race alone 6,887 0.04% Native Hawaiian and Other
11,309,403 50.8% White alone 6,025,039 27.1% Hispanic 3,241,015 14.6% Black alone 861,630 3.9% Two or more races 623,692 2.8% Asian alone 152,054 0.7% Other race alone 22,504 0.1% American Indian alone 9,486 0.04% Native Hawaiian and Other
Income and house value in Ocean City Median household income in 2022 $56,235 White non-Hispanic householders$55,609 Black householders$78,462 Asian householders$53,389 Some other race householders$43,780 Two or more races householders$53,663 Hispanic or Latino race householdersMedian 2022 house value $344,050 White Non-Hispanic householders$363,828 Black or African American householders$446,235 American Indian or Alaska Native householders $309,027 Asian householders$185,416 Some other race householders$296,254 Two or more races householdersover $1,000,000 Hispanic or Latino householders
Median age by race in Ocean City
40.0 Median age for White residents41.1 38.0 32.0 Median age for Black or African American residents37.3 30.0 -598,566,307.6 Median age for American Indian / Alaska Native residents-611,418,047.3 -594,925,633.7 47.3 Median age for Asian residents25.2 67.9 -570,491,802.7 Median age for Native Hawaiian / Pacific Islander residents-588,888,888.3 -402,088,772.4 31.3 Median age for Other race residents32.8 27.4 30.0 Median age for Two or more races residents29.5 18.4 41.5 Median age for White alone residents44.0 40.4 31.9 Median age for Hispanic or Latino residents32.3 31.2
Owner/renter occupied households by race in Ocean City
House owners and renters - White residents 1,235 67.1% Owner occupied605 32.9% Renter occupiedHouse owners and renters - Black or African American residents 107 37.6% Owner occupied177 62.4% Renter occupiedHouse owners and renters - American Indian / Alaska Native residents 5 100.0% Owner occupiedHouse owners and renters - Asian residents 39 46.1% Owner occupied45 53.9% Renter occupiedHouse owners and renters - Other race residents 27 11.5% Owner occupied205 88.5% Renter occupiedHouse owners and renters - Two or more races residents 212 56.8% Owner occupied161 43.2% Renter occupiedHouse owners and renters - White alone residents 1,225 70.3% Owner occupied517 29.7% Renter occupiedHouse owners and renters - Hispanic or Latino residents 90 18.6% Owner occupied393 81.4% Renter occupied
Language usage in Ocean City
English speakers - Total 82.7% of residents of Ocean City speak English at home.
17.7% of residents speak Spanish at home 217 20.9% Speak English very well823 79.1% Speak English less than very well2.0% of residents speak other language at home 87 74.4% Speak English very well30 25.6% Speak English less than very well
English speakers - Born in the United States 96.1% of residents of Ocean City speak English at home.
2.4% of residents speak Spanish at home 66 81.5% Speak English very well15 18.5% Speak English less than very well1.0% of residents speak other language at home 35 100.0% Speak English very well
English speakers - Native, born elsewhere 84.8% of residents of Ocean City speak English at home.
14.6% of residents speak Spanish at home 22 100.0% Speak English very well
English speakers - Foreign-born 17.1% of residents of Ocean City speak English at home.
85.4% of residents speak Spanish at home 40 4.9% Speak English very well773 95.1% Speak English less than very well8.2% of residents speak other language at home 48 61.5% Speak English very well30 38.5% Speak English less than very well
White (Caucasian) - Speak only English Native:
98.2% (3,757)Foreign-born:
27.8% (81)
White (Caucasian) - Speak another language Native:
1.9% (71)Foreign-born:
73.7% (216)
Asian - Speak only English Native:
100.0% (21)Foreign-born:
13.6% (10)
Other race - Speak only English Native:
25.3% (22)Foreign-born:
12.6% (49)
Other race - Speak another language Native:
78.9% (69)Foreign-born:
90.5% (356)
Two or more races - Speak only English Native:
87.6% (543)Foreign-born:
7.6% (13)
Two or more races - Speak another language Native:
11.9% (74)Foreign-born:
82.3% (139)
White alone - Speak only English Native:
97.9% (3,741)Foreign-born:
87.8% (84)
White alone - Speak another language Native:
1.9% (73)Foreign-born:
19.7% (19)
Hispanic or Latino - Speak only English Native:
49.4% (141)Foreign-born:
4.8% (37)
Hispanic or Latino - Speak another language Native:
50.0% (143)Foreign-born:
91.9% (715)
Foreign-born residents in Ocean City 1,080 residents are foreign born (13.2% Latin America , 2.1% Europe ).
This city:
17.3%Florida:
21.1%
Marital status for residents in Ocean City Marital status - White (Caucasian) population 15 years and over
Males 37.6% Never married44.8% Now married3.5% Separated1.6% Widowed12.4% DivorcedFemales 22.8% Never married53.9% Now married1.4% Separated10.3% Widowed11.6% DivorcedWomen who gave birth in the past 12 months Now married:
100.0% (47)Unmarried:
0.0% (0)
Women who did not give birth in the past 12 months Now married:
57.1% (569)Unmarried:
42.9% (428)
Marital status - Black or African American population 15 years and over
Males 57.7% Never married6.3% Now married0.0% Separated0.0% Widowed36.0% DivorcedFemales 62.6% Never married9.7% Now married9.7% Separated3.2% Widowed14.7% DivorcedWomen who did not give birth in the past 12 months Now married:
18.0% (34)Unmarried:
82.0% (156)
Marital status - American Indian / Alaska Native population 15 years and over
Males 0.0% Never married100.0% Now married0.0% Separated0.0% Widowed0.0% DivorcedFemales 0.0% Never married0.0% Now married0.0% Separated0.0% Widowed100.0% DivorcedMarital status - Asian population 15 years and over
Males 61.0% Never married39.0% Now married0.0% Separated0.0% Widowed0.0% DivorcedFemales 0.0% Never married44.4% Now married0.0% Separated55.6% Widowed0.0% DivorcedWomen who did not give birth in the past 12 months Now married:
100.0% (12)Unmarried:
0.0% (0)
Marital status - Other race population 15 years and over
Males 28.1% Never married44.3% Now married27.6% Separated0.0% Widowed0.0% DivorcedFemales 59.2% Never married30.8% Now married0.0% Separated10.1% Widowed0.0% DivorcedWomen who did not give birth in the past 12 months Now married:
30.8% (70)Unmarried:
69.2% (157)
Marital status - Two or more races population 15 years and over
Males 31.0% Never married52.8% Now married0.0% Separated0.0% Widowed16.2% DivorcedFemales 75.8% Never married18.3% Now married0.0% Separated0.0% Widowed5.9% DivorcedWomen who gave birth in the past 12 months Now married:
100.0% (1)Unmarried:
0.0% (0)
Women who did not give birth in the past 12 months Now married:
14.7% (21)Unmarried:
85.3% (122)
Marital status - White alone, not Hispanic / Latino population 15 years and over
Males 35.8% Never married45.5% Now married3.7% Separated1.7% Widowed13.3% DivorcedFemales 18.4% Never married56.6% Now married1.5% Separated11.1% Widowed12.4% DivorcedWomen who gave birth in the past 12 months Now married:
100.0% (47)Unmarried:
0.0% (0)
Women who did not give birth in the past 12 months Now married:
63.1% (562)Unmarried:
36.9% (328)
Marital status - Hispanic or Latino population 15 years and over
Males 40.6% Never married41.2% Now married10.7% Separated0.0% Widowed7.4% DivorcedFemales 71.6% Never married24.1% Now married0.0% Separated4.3% Widowed0.0% DivorcedWomen who gave birth in the past 12 months Now married:
100.0% (1)Unmarried:
0.0% (0)
Women who did not give birth in the past 12 months Now married:
21.5% (86)Unmarried:
78.5% (315)
Ancestries in Ocean City
492 15.6% English305 9.7% German151 4.8% American125 4.0% Irish109 3.5% Ghanaian100 3.2% Scottish72 2.3% Scotch-Irish66 2.1% Lithuanian62 2.0% Polish58 1.8% European32 1.0% Italian22 0.7% Greek19 0.6% Eastern European6 0.2% Canadian
Children Nativity (place of birth) in Ocean City
Children under 6 years - Living with two parents Both parents native 123 100.0% NativeBoth parents foreign-born 8 100.0% NativeOne native, one foreign-born parent 20 100.0% NativeChildren under 6 years - Living with one parent Foreign-born parent 323 90.8% Native33 9.2% Foreign-bornChildren 6 to 17 years - Living with two parents Both parents native 405 100.0% NativeBoth parents foreign-born 45 100.0% NativeOne native, one foreign-born parent 10 100.0% NativeChildren 6 to 17 years - Living with one parent Native parent 27 100.0% Foreign-bornForeign-born parent 218 78.5% Native60 21.5% Foreign-born