Races in Northwest Escambia, Florida (FL) Detailed Stats
Ancestries, Foreign-born residents, place of birth
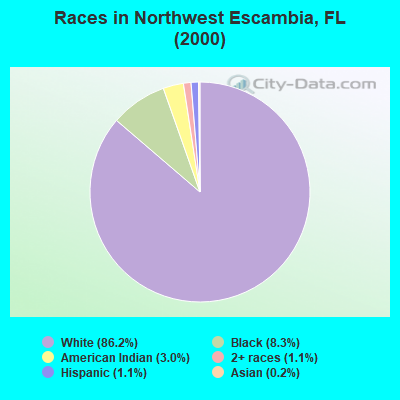
Race distribution in Northwest Escambia

- 3,86786.2%White alone
- 3728.3%Black alone
- 1353.0%American Indian alone
- 501.1%Hispanic
- 511.1%Two or more races
- 80.2%Asian alone
- 20.04%Other race alone
2000
2022
-
- 10,458,50965.4%White alone
- 2,682,71516.8%Hispanic
- 2,264,26814.2%Black alone
- 261,6931.6%Asian alone
- 236,9541.5%Two or more races
- 42,3580.3%American Indian alone
- 28,9940.2%Other race alone
- 6,8870.04%Native Hawaiian and Other
Pacific Islander alone

-
- 11,309,40350.8%White alone
- 6,025,03927.1%Hispanic
- 3,241,01514.6%Black alone
- 861,6303.9%Two or more races
- 623,6922.8%Asian alone
- 152,0540.7%Other race alone
- 22,5040.1%American Indian alone
- 9,4860.04%Native Hawaiian and Other
Pacific Islander alone

Income and house value in Northwest Escambia
- Median household income in 2022
- $81,309White non-Hispanic householders
- $35,397Black householders
- $151,144American Indian and Alaska Native householders
- $71,428Two or more races householders
- $142,201Hispanic or Latino race householders
- Median 2022 house value
- $320,344White Non-Hispanic householders
- $122,651Black or African American householders
- $303,633American Indian or Alaska Native householders
- $204,944Two or more races householders
- $268,004Hispanic or Latino householders
Household income for White non-Hispanic householders

Household income for Black householders

Household income for American Indian and Alaska Native householders

Household income for Two or more races householders

Household income for Hispanic or Latino race householders

Zip code: 32568