Races in Northeast Glades, Florida (FL) Detailed Stats
Ancestries, Foreign-born residents, place of birth
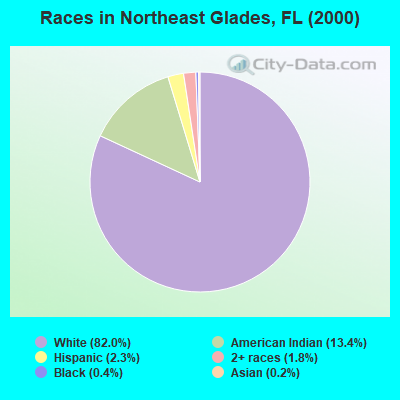
Race distribution in Northeast Glades

- 2,71282.0%White alone
- 44213.4%American Indian alone
- 762.3%Hispanic
- 591.8%Two or more races
- 130.4%Black alone
- 70.2%Asian alone
2000
2022
-
- 10,458,50965.4%White alone
- 2,682,71516.8%Hispanic
- 2,264,26814.2%Black alone
- 261,6931.6%Asian alone
- 236,9541.5%Two or more races
- 42,3580.3%American Indian alone
- 28,9940.2%Other race alone
- 6,8870.04%Native Hawaiian and Other
Pacific Islander alone

-
- 11,309,40350.8%White alone
- 6,025,03927.1%Hispanic
- 3,241,01514.6%Black alone
- 861,6303.9%Two or more races
- 623,6922.8%Asian alone
- 152,0540.7%Other race alone
- 22,5040.1%American Indian alone
- 9,4860.04%Native Hawaiian and Other
Pacific Islander alone

Income and house value in Northeast Glades
- Median household income in 2022
- $48,467White non-Hispanic householders
- $120,772American Indian and Alaska Native householders
- $69,541Asian householders
- $139,196Some other race householders
- $21,171Two or more races householders
- over $200,000Hispanic or Latino race householders
- Median 2022 house value
- $140,231White Non-Hispanic householders
- $129,387American Indian or Alaska Native householders
- $188,383Asian householders
- $82,705Some other race householders
- $344,604Two or more races householders
- $68,920Hispanic or Latino householders
Household income for White non-Hispanic householders

Household income for American Indian and Alaska Native householders

Household income for Asian householders

Household income for Two or more races householders

Household income for Hispanic or Latino race householders

Zip code: 34974