Races in North Siuslaw, Oregon (OR) Detailed Stats
Ancestries, Foreign-born residents, place of birth
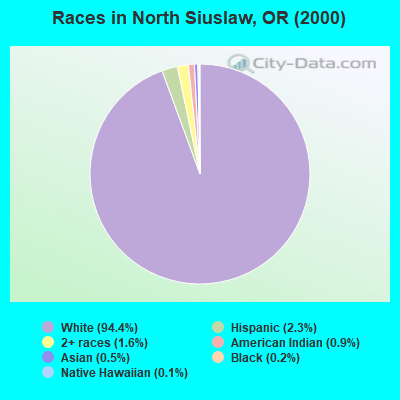
Race distribution in North Siuslaw

- 10,29894.4%White alone
- 2502.3%Hispanic
- 1731.6%Two or more races
- 950.9%American Indian alone
- 500.5%Asian alone
- 230.2%Black alone
- 110.1%Native Hawaiian and Other
Pacific Islander alone - 50.05%Other race alone
2000
2022
-
- 2,857,61683.5%White alone
- 275,3148.0%Hispanic
- 100,3332.9%Asian alone
- 82,7332.4%Two or more races
- 53,3251.6%Black alone
- 40,1301.2%American Indian alone
- 7,3980.2%Native Hawaiian and Other
Pacific Islander alone - 4,5500.1%Other race alone

-
- 3,037,57171.6%White alone
- 609,53814.4%Hispanic
- 252,7446.0%Two or more races
- 191,2834.5%Asian alone
- 78,2281.8%Black alone
- 29,3990.7%American Indian alone
- 25,7310.6%Other race alone
- 15,6430.4%Native Hawaiian and Other
Pacific Islander alone

Income and house value in North Siuslaw
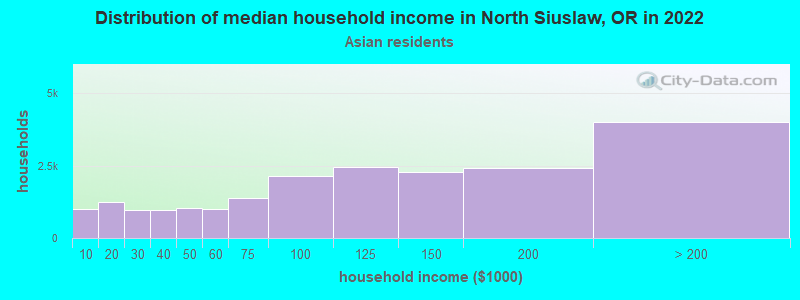
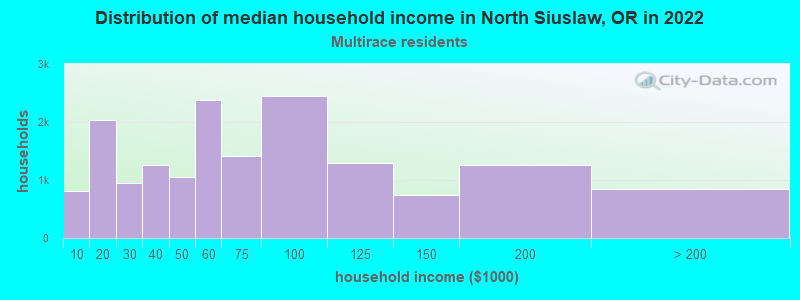
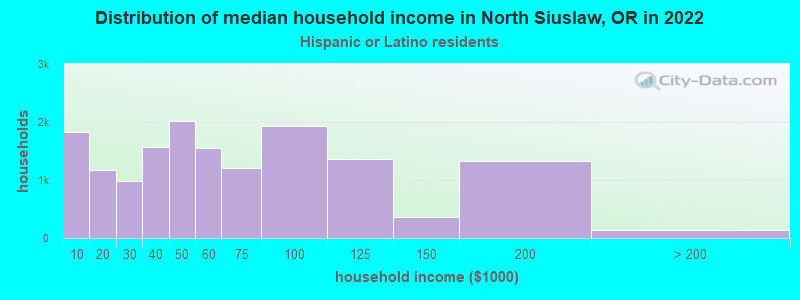
- Median household income in 2022
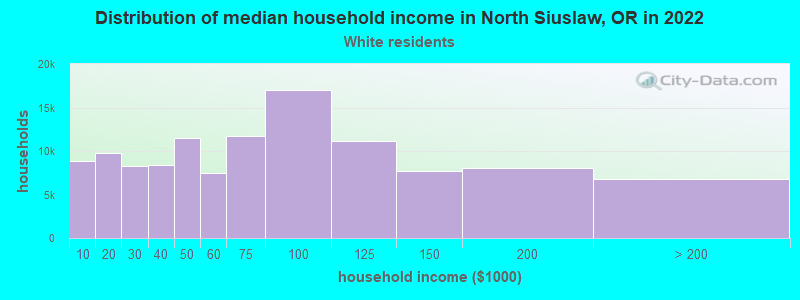
- $55,610White non-Hispanic householders
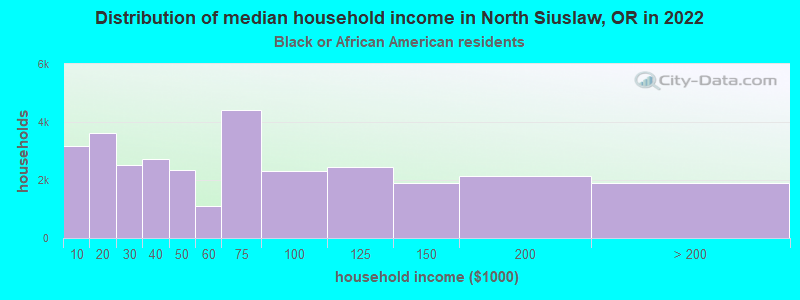
- $59,465Black householders
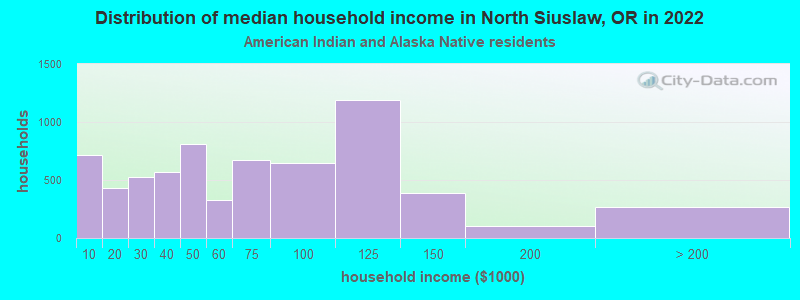
- $47,432American Indian and Alaska Native householders
- $31,899Asian householders
- $78,881Some other race householders
- $80,281Two or more races householders
- $64,753Hispanic or Latino race householders
- Median 2022 house value
- $409,144White Non-Hispanic householders
- $272,338American Indian or Alaska Native householders
- $302,952Some other race householders
- $126,283Two or more races householders
- $395,751Hispanic or Latino householders
Household income for White non-Hispanic householders
Household income for Black householders
Household income for American Indian and Alaska Native householders
Household income for Asian householders
Household income for Two or more races householders
Household income for Hispanic or Latino race householders
Zip code: 97439